| Param | Original file | Final file |
|---|---|---|
| Filename | modeM0/AS1C07_001T12_9000005826_42808cztM0_level2.fits | modeM0/AS1C07_001T12_9000005826_42808cztM0_level2_quad_clean.evt |
| Size (bytes) | 214,467,840 | 62,830,080 |
| Size | 204.5 MB | 59.9 MB |
| Events in quadrant A | 1,934,956 | 417,613 |
| Events in quadrant B | 1,925,643 | 432,054 |
| Events in quadrant C | 2,056,583 | 416,109 |
| Events in quadrant D | 1,737,216 | 379,840 |
| Mode M0 | |||
|---|---|---|---|
| Quadrant | BADHDUFLAG | Total packets | Discarded packets |
| A | 0 | 7927 | 1 |
| B | 0 | 8214 | 1 |
| C | 0 | 8430 | 1 |
| D | 0 | 7994 | 1 |
| Mode SS | |||
|---|---|---|---|
| Quadrant | BADHDUFLAG | Total packets | Discarded packets |
| A | 0 | 74 | 0 |
| B | 0 | 74 | 0 |
| C | 0 | 74 | 0 |
| D | 0 | 74 | 0 |
| Mode M9 | |||
|---|---|---|---|
| Quadrant | BADHDUFLAG | Total packets | Discarded packets |
| A | 0 | 22 | 0 |
| B | 0 | 22 | 0 |
| C | 0 | 22 | 0 |
| D | 0 | 22 | 0 |
| Quadrant | Total seconds | Saturated seconds | Saturation percentage |
|---|---|---|---|
| A | 3635 | 6 | 0.165062% |
| B | 3634 | 29 | 0.798019% |
| C | 3634 | 40 | 1.100715% |
| D | 3634 | 68 | 1.871216% |
Noise dominated data is calculated using 1-second bins in cleaned event files. If a bin has >2000 counts, and if more than 50% of those come from <1% of pixels, then it is considered to be noise-dominated and hence unusable.
| Quadrant | # 1 sec bins | Bins with >0 counts | Bins with >2000 counts | High rate bins dominated by noise | Noise dominated (total time) | Noise dominated (detector-on time) | Marked lightcurve |
|---|---|---|---|---|---|---|---|
| A | 5758 | 3636 | 3 | 3 | 0.05% | 0.08% | 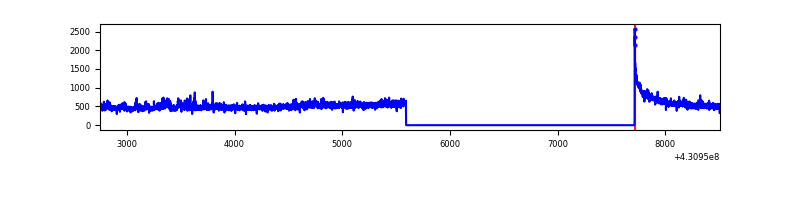 |
| B | 5757 | 3635 | 17 | 17 | 0.30% | 0.47% | 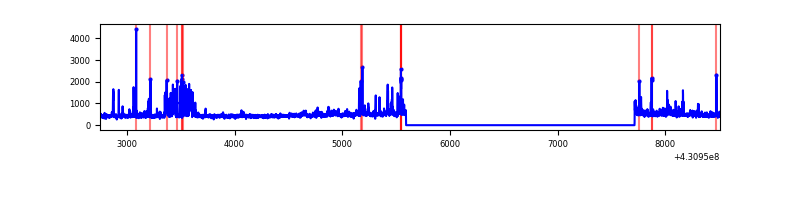 |
| C | 5757 | 3635 | 36 | 36 | 0.63% | 0.99% | 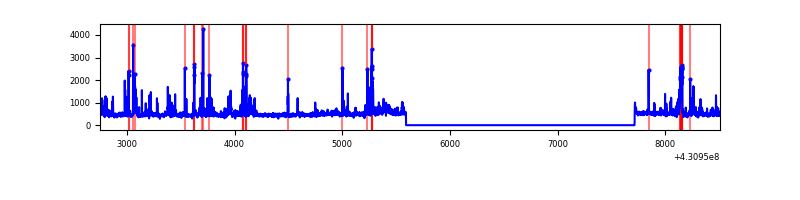 |
| D | 5757 | 3635 | 69 | 69 | 1.20% | 1.90% | 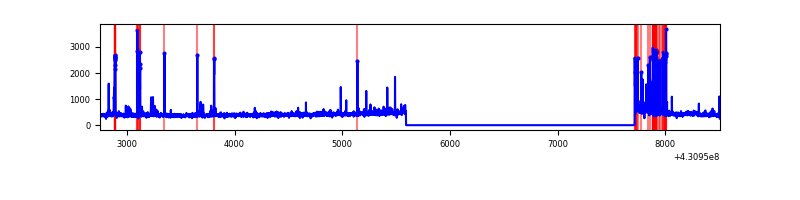 |
Top three noisy pixels from each quadrant. If the there are fewer than three noisy pixels in the level2.evt file, extra rows are filled as -1
| Pixel properties | Quadrant properties | ||||||
|---|---|---|---|---|---|---|---|
| Quadrant | DetID | PixID | Counts | Sigma | Mean | Median | Sigma |
| A | 10 | 83 | 342784 | 4195.91 | 391 | 383 | 81.6 |
| A | 12 | 189 | 48732 | 592.48 | 391 | 383 | 81.6 |
| A | 2 | 79 | 19622 | 235.76 | 391 | 383 | 81.6 |
| B | 4 | 171 | 214223 | 2801.89 | 393 | 383 | 76.3 |
| B | 0 | 229 | 73142 | 953.34 | 393 | 383 | 76.3 |
| B | 5 | 255 | 32235 | 417.35 | 393 | 383 | 76.3 |
| C | 4 | 254 | 388213 | 4300.62 | 384 | 386 | 90.2 |
| C | 15 | 214 | 143841 | 1590.77 | 384 | 386 | 90.2 |
| C | 14 | 254 | 14552 | 157.09 | 384 | 386 | 90.2 |
| D | 13 | 249 | 168012 | 1827.91 | 377 | 366 | 91.7 |
| D | 1 | 52 | 34366 | 370.72 | 377 | 366 | 91.7 |
| D | 7 | 96 | 32166 | 346.73 | 377 | 366 | 91.7 |
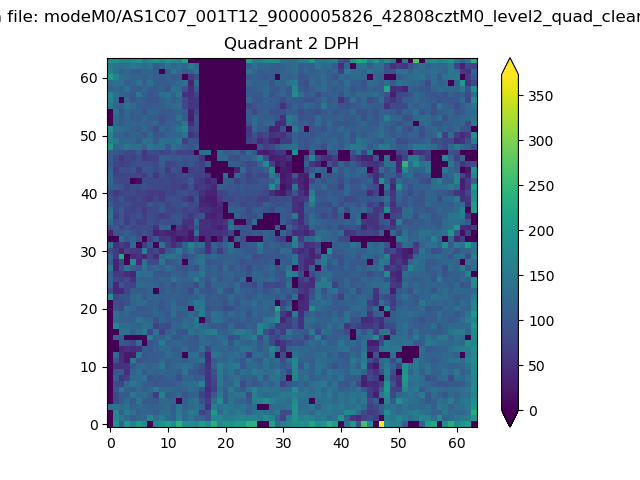
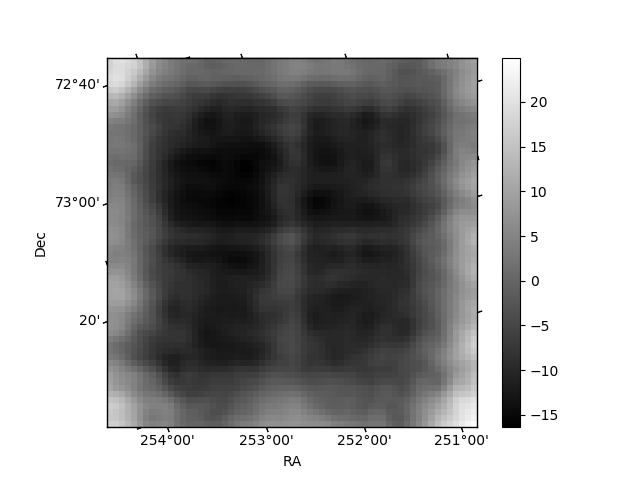
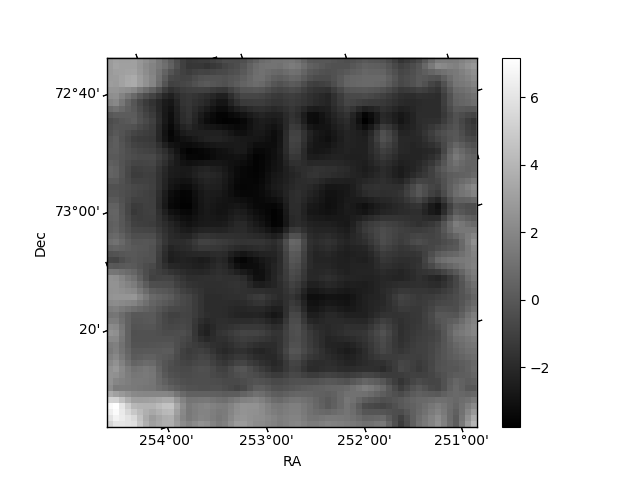
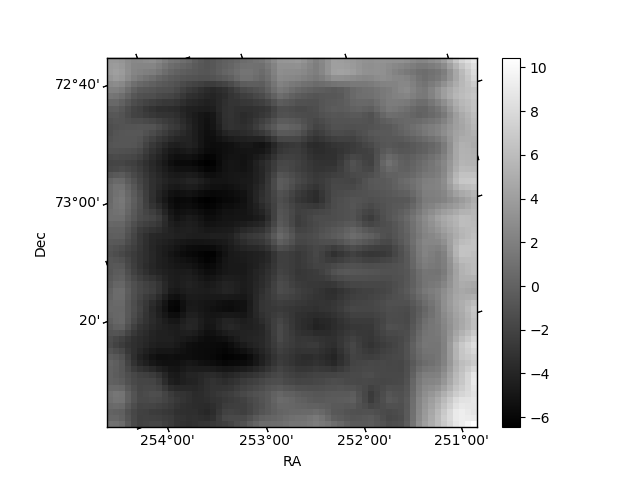
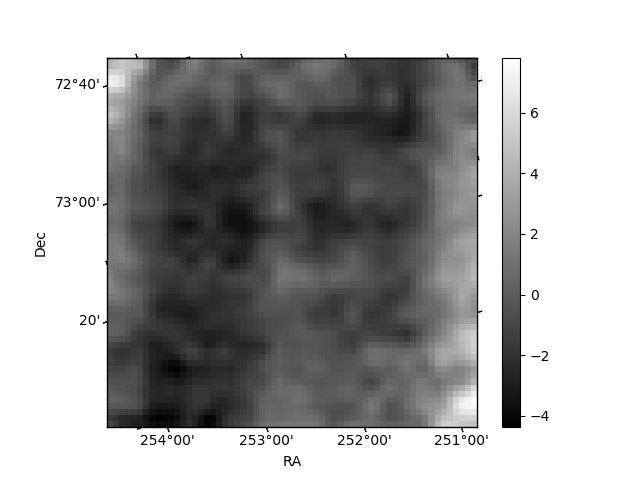
Histogram calculated using DETX and DETY for each event in the final _common_clean file
| Quadrant A | 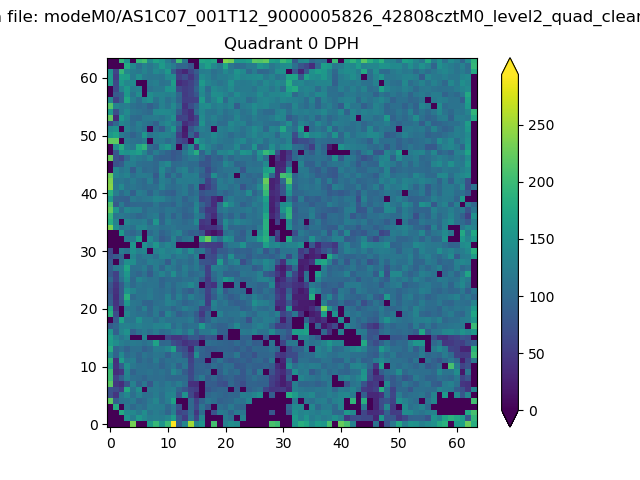 |
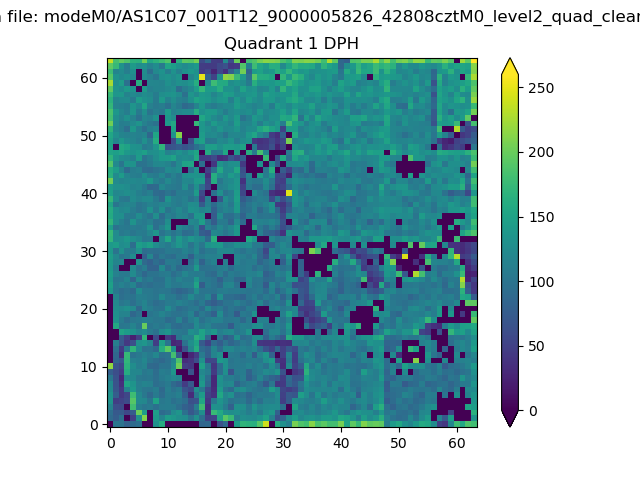 |
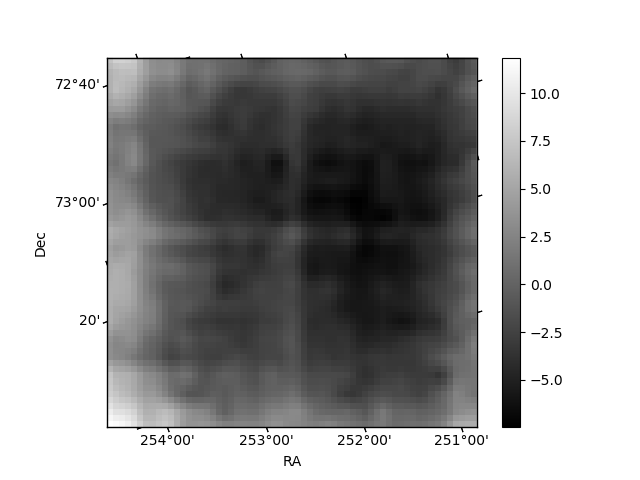
Quadrant B |
|---|---|---|---|
| Quadrant D | 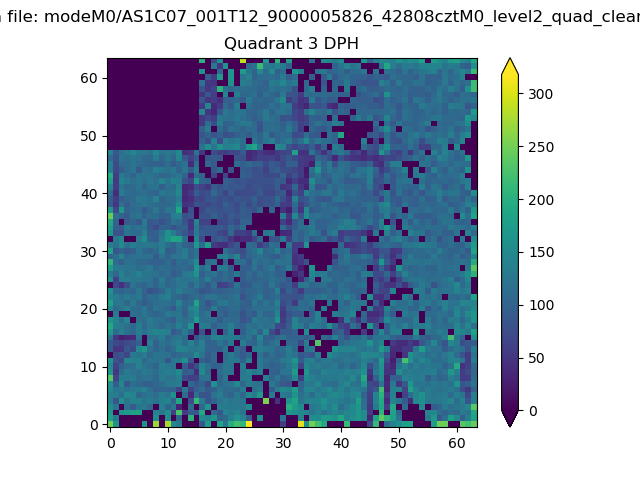 |
 |
Quadrant C |
| Plot type | Count rate plots | Images |
|---|---|---|
| Comparison with Poisson distribution Blue bars denote a histogram of data divided into 1 sec bins. Red curve is a Poisson curve with rate = median count rate of data. |
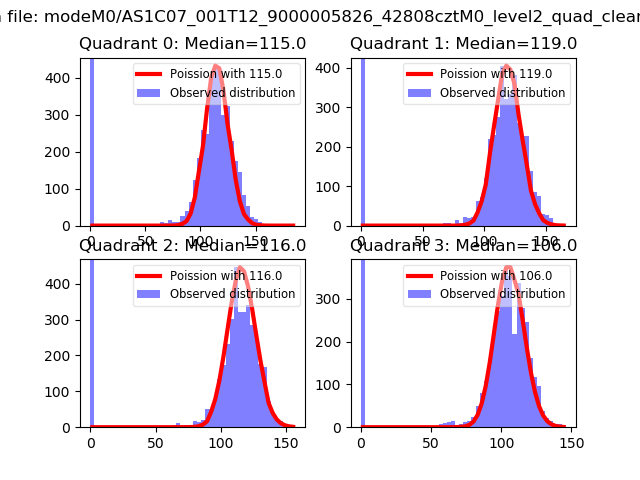 |
 |
| Quadrant-wise count rates Data is divided into 100 sec bins |
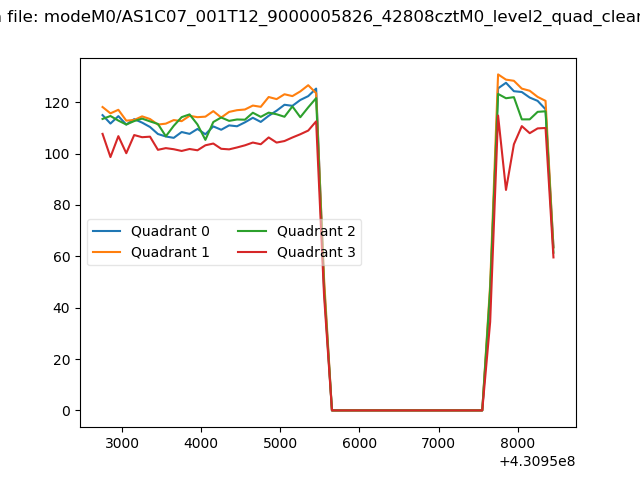 |
|
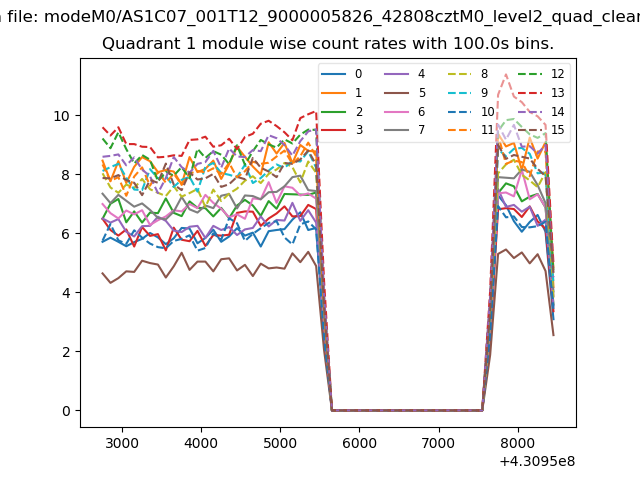
| Module-wise count rates for Quadrant A Data is divided into 100 sec bins |
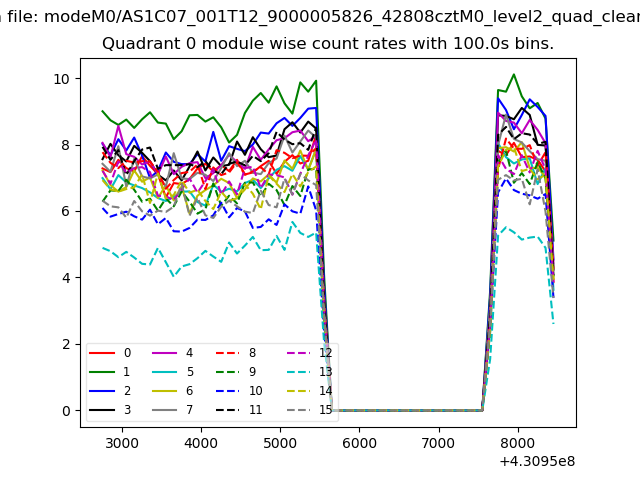 |
 |
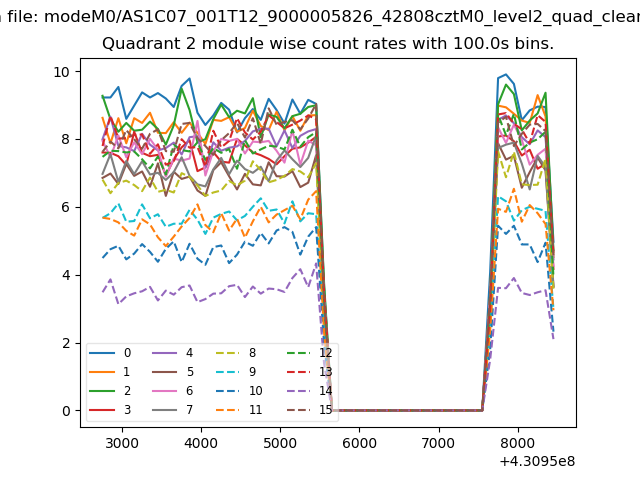
| Module-wise count rates for Quadrant B Data is divided into 100 sec bins |
 |
 |
| Module-wise count rates for Quadrant C Data is divided into 100 sec bins |
 |
 |
| Module-wise count rates for Quadrant D Data is divided into 100 sec bins |
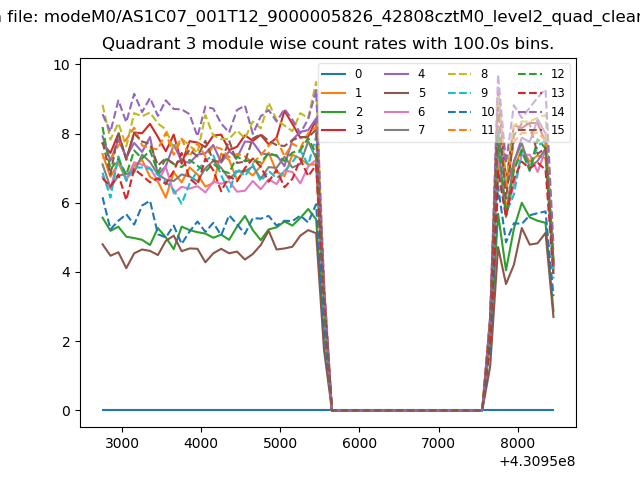 |
 |
| Parameter | Plot |
|---|---|
| CZT HV Monitor | 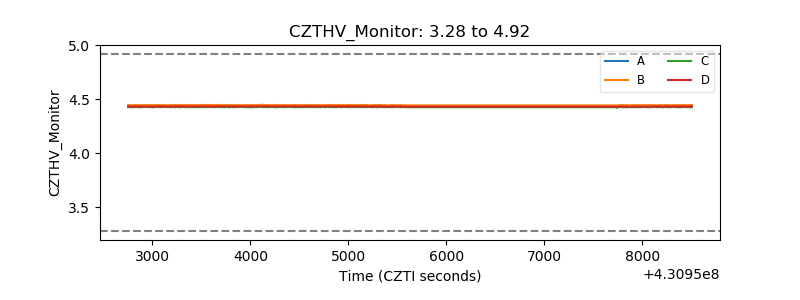 |
| D_VDD | 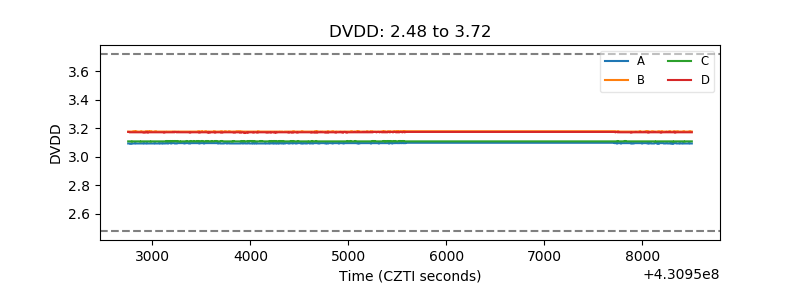 |
| Temperature 1 | 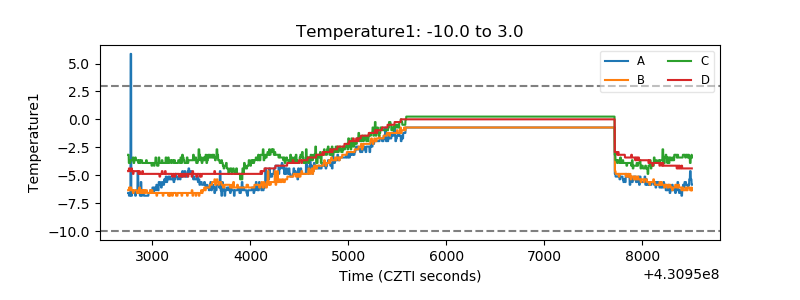 |
| Veto HV Monitor |  |
| Veto LLD | 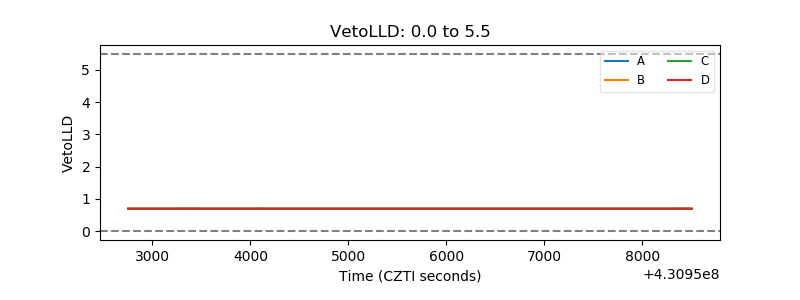 |
| Alpha Counter | 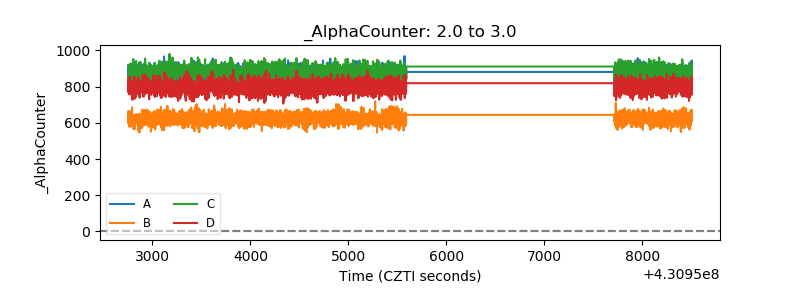 |
| _CPM_Rate | 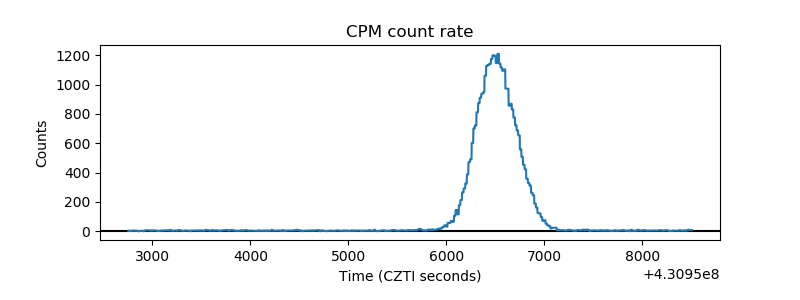 |
| CZT Counter | 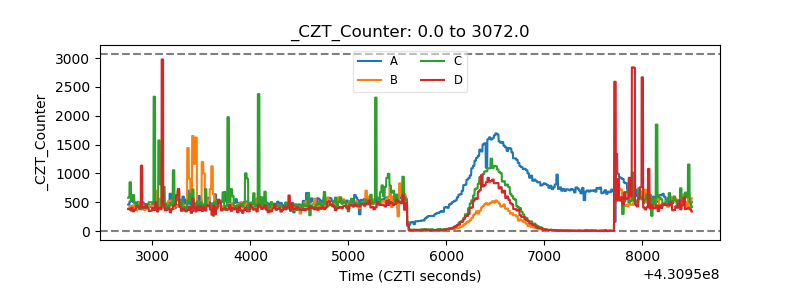 |
| +2.5 Volts monitor | 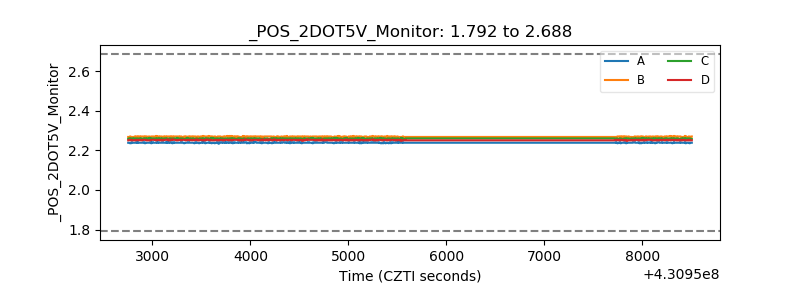 |
| +5 Volts monitor | 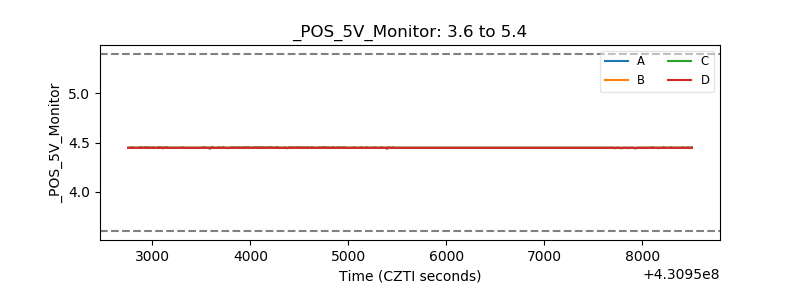 |
| _ROLL_ROT | 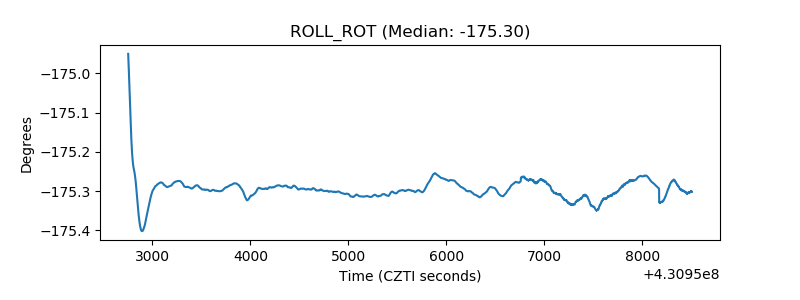 |
| _Roll_DEC | 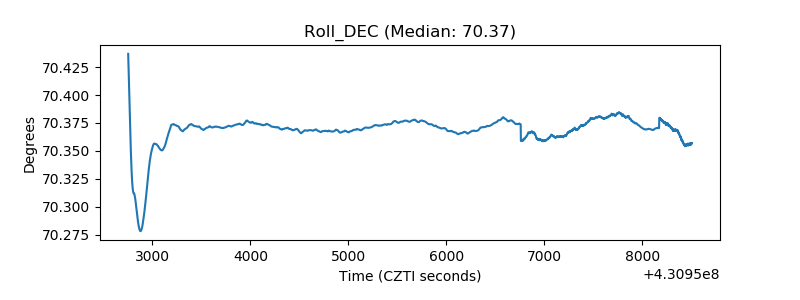 |
| _Roll_RA | 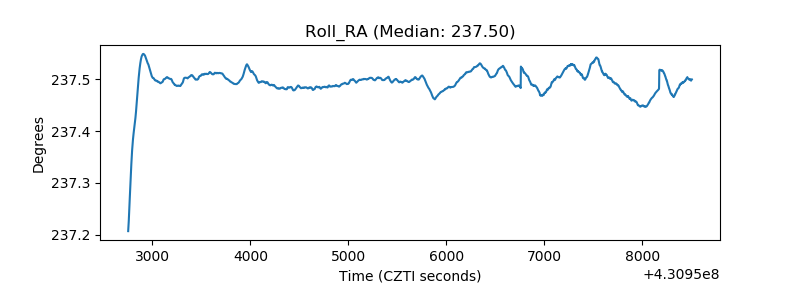 |
| Veto Counter | 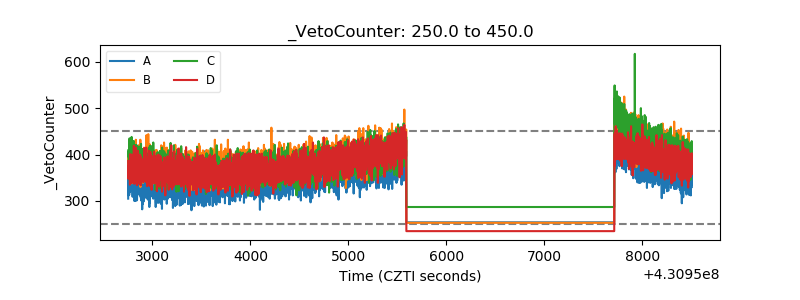 |