| Param | Original file | Final file |
|---|---|---|
| Filename | modeM0/AS1C07_001T12_9000005826_42809cztM0_level2.fits | modeM0/AS1C07_001T12_9000005826_42809cztM0_level2_quad_clean.evt |
| Size (bytes) | 281,943,360 | 84,090,240 |
| Size | 268.9 MB | 80.2 MB |
| Events in quadrant A | 2,617,536 | 562,380 |
| Events in quadrant B | 2,714,112 | 570,211 |
| Events in quadrant C | 2,402,024 | 555,461 |
| Events in quadrant D | 2,316,945 | 511,614 |
| Mode M0 | |||
|---|---|---|---|
| Quadrant | BADHDUFLAG | Total packets | Discarded packets |
| A | 0 | 10857 | 9 |
| B | 0 | 11565 | 15 |
| C | 0 | 10386 | 20 |
| D | 0 | 10734 | 16 |
| Mode SS | |||
|---|---|---|---|
| Quadrant | BADHDUFLAG | Total packets | Discarded packets |
| A | 0 | 100 | 0 |
| B | 0 | 100 | 0 |
| C | 0 | 100 | 0 |
| D | 0 | 100 | 0 |
| Mode M9 | |||
|---|---|---|---|
| Quadrant | BADHDUFLAG | Total packets | Discarded packets |
| A | 0 | 37 | 0 |
| B | 0 | 38 | 0 |
| C | 0 | 38 | 0 |
| D | 0 | 38 | 0 |
| Quadrant | Total seconds | Saturated seconds | Saturation percentage |
|---|---|---|---|
| A | 4947 | 14 | 0.283000% |
| B | 4946 | 89 | 1.799434% |
| C | 4944 | 20 | 0.404531% |
| D | 4948 | 60 | 1.212611% |
Noise dominated data is calculated using 1-second bins in cleaned event files. If a bin has >2000 counts, and if more than 50% of those come from <1% of pixels, then it is considered to be noise-dominated and hence unusable.
| Quadrant | # 1 sec bins | Bins with >0 counts | Bins with >2000 counts | High rate bins dominated by noise | Noise dominated (total time) | Noise dominated (detector-on time) | Marked lightcurve |
|---|---|---|---|---|---|---|---|
| A | 7075 | 4951 | 5 | 5 | 0.07% | 0.10% |  |
| B | 7075 | 4951 | 65 | 65 | 0.92% | 1.31% | 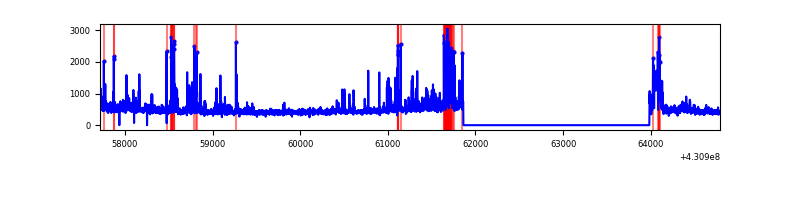 |
| C | 7075 | 4949 | 20 | 20 | 0.28% | 0.40% | 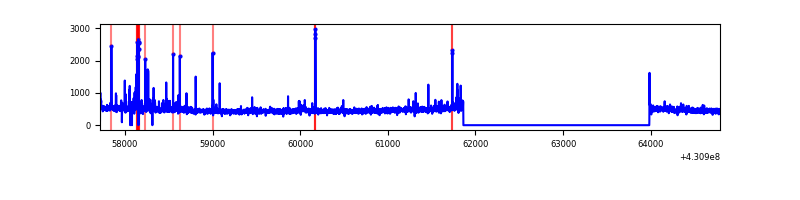 |
| D | 7075 | 4951 | 58 | 58 | 0.82% | 1.17% | 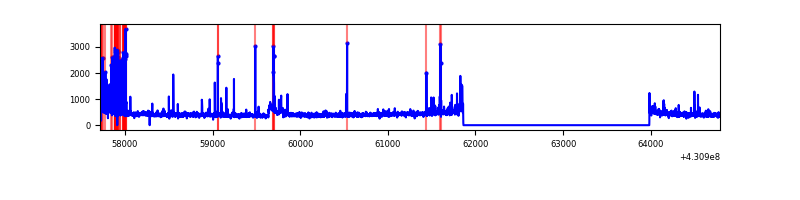 |
Top three noisy pixels from each quadrant. If the there are fewer than three noisy pixels in the level2.evt file, extra rows are filled as -1
| Pixel properties | Quadrant properties | ||||||
|---|---|---|---|---|---|---|---|
| Quadrant | DetID | PixID | Counts | Sigma | Mean | Median | Sigma |
| A | 10 | 83 | 536003 | 4902.08 | 527 | 517 | 109.2 |
| A | 12 | 189 | 28047 | 252.02 | 527 | 517 | 109.2 |
| A | 13 | 248 | 7536 | 64.26 | 527 | 517 | 109.2 |
| B | 0 | 229 | 371745 | 3703.14 | 525 | 510 | 100.2 |
| B | 5 | 172 | 98627 | 978.73 | 525 | 510 | 100.2 |
| B | 4 | 171 | 55334 | 546.88 | 525 | 510 | 100.2 |
| C | 15 | 214 | 197966 | 1637.69 | 516 | 519 | 120.6 |
| C | 4 | 254 | 129878 | 1072.95 | 516 | 519 | 120.6 |
| C | 14 | 254 | 26480 | 215.33 | 516 | 519 | 120.6 |
| D | 13 | 249 | 157100 | 1265.44 | 509 | 496 | 123.8 |
| D | 2 | 120 | 48055 | 384.3 | 509 | 496 | 123.8 |
| D | 1 | 52 | 34622 | 275.76 | 509 | 496 | 123.8 |
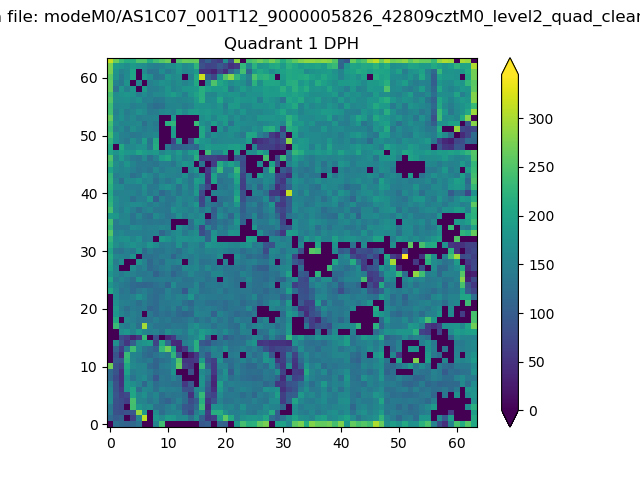
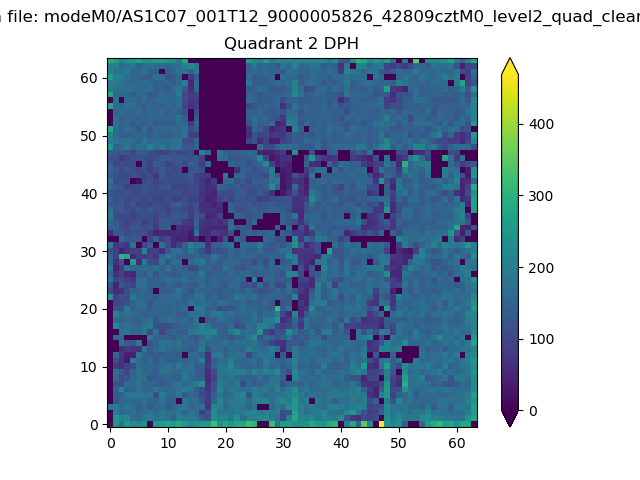
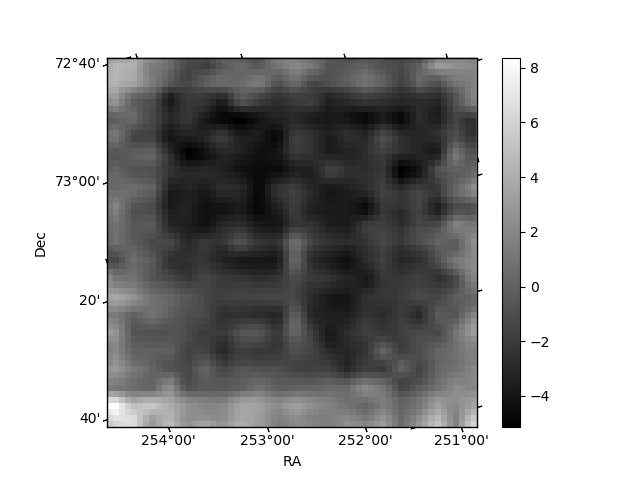
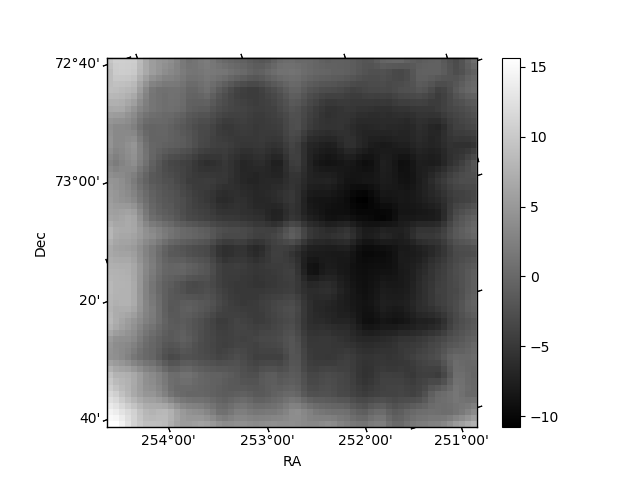
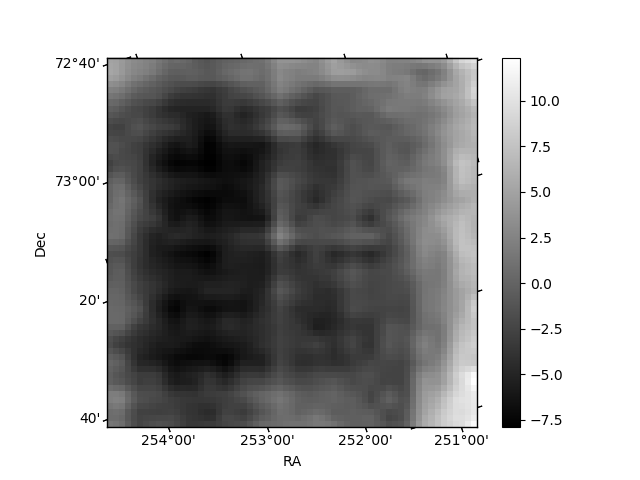
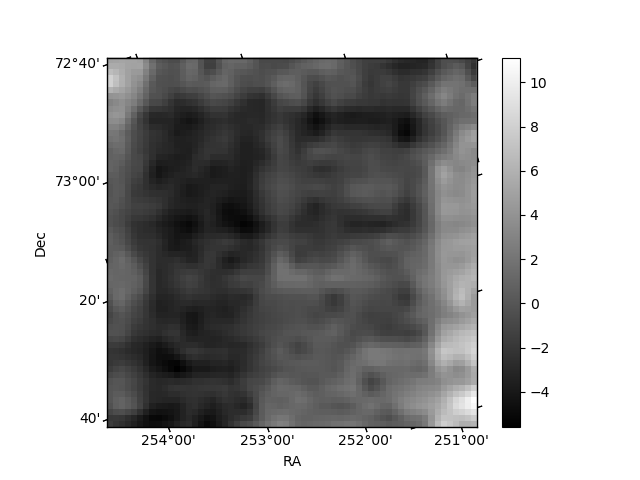
Histogram calculated using DETX and DETY for each event in the final _common_clean file
| Quadrant A | 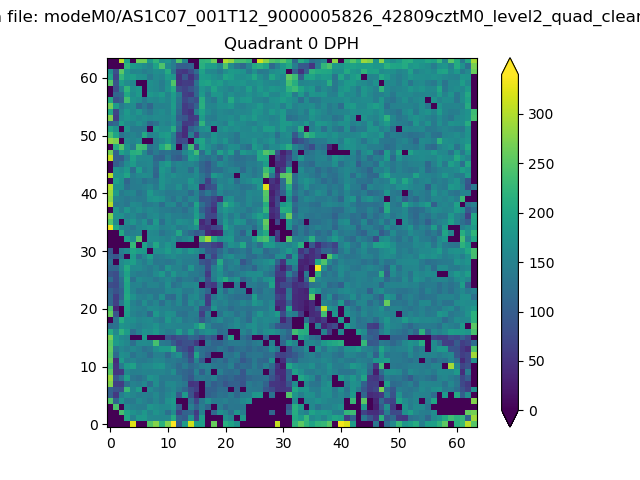 |
 |
Quadrant B |
|---|---|---|---|
| Quadrant D | 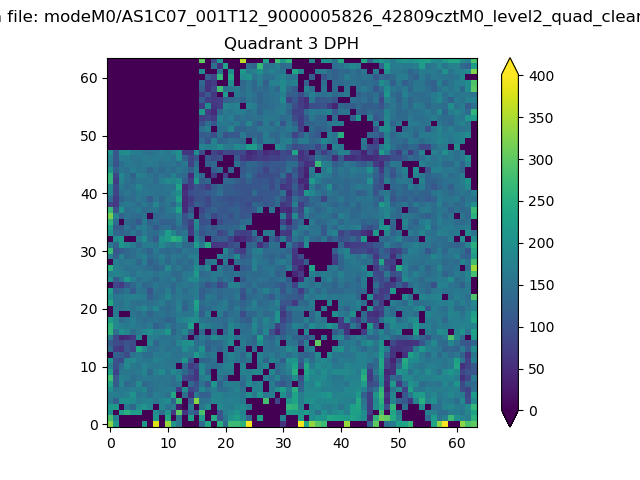 |
 |
Quadrant C |
| Plot type | Count rate plots | Images |
|---|---|---|
| Comparison with Poisson distribution Blue bars denote a histogram of data divided into 1 sec bins. Red curve is a Poisson curve with rate = median count rate of data. |
 |
 |
| Quadrant-wise count rates Data is divided into 100 sec bins |
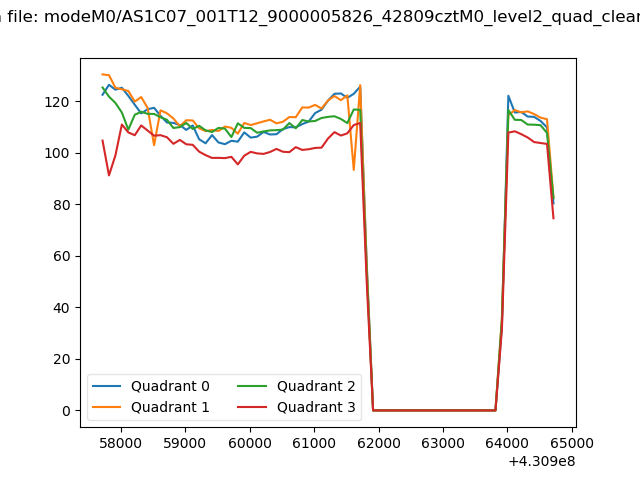 |
|
| Module-wise count rates for Quadrant A Data is divided into 100 sec bins |
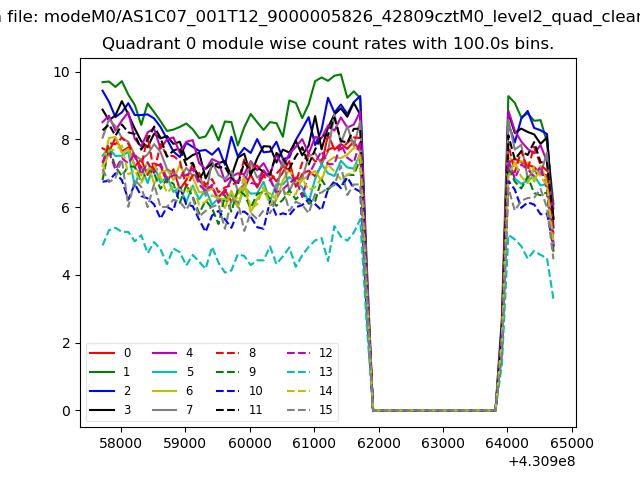 |
 |
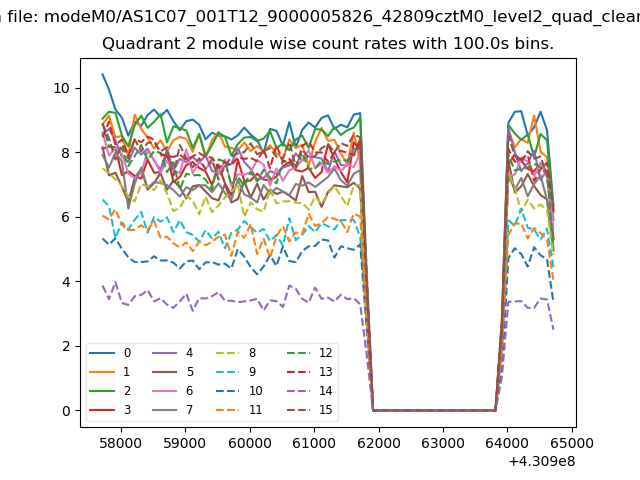
| Module-wise count rates for Quadrant B Data is divided into 100 sec bins |
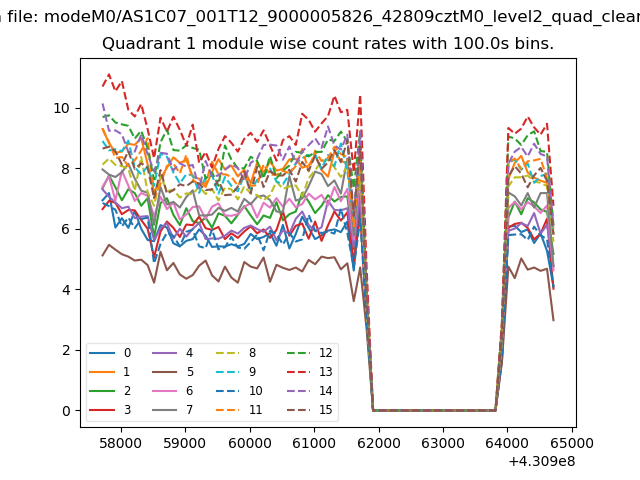 |
 |
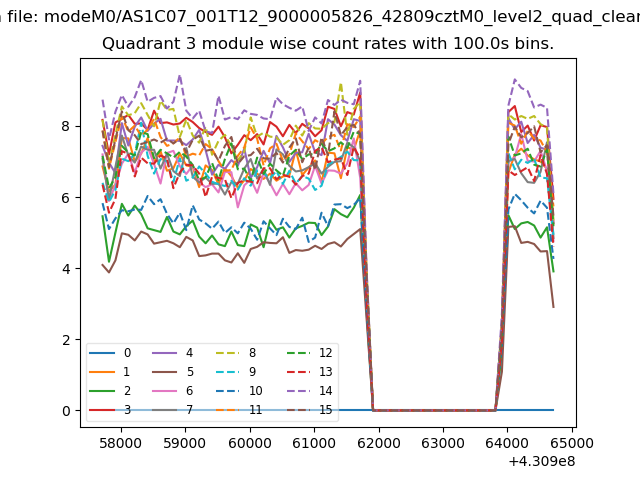
| Module-wise count rates for Quadrant C Data is divided into 100 sec bins |
 |
 |
| Module-wise count rates for Quadrant D Data is divided into 100 sec bins |
 |
 |
| Parameter | Plot |
|---|---|
| CZT HV Monitor | 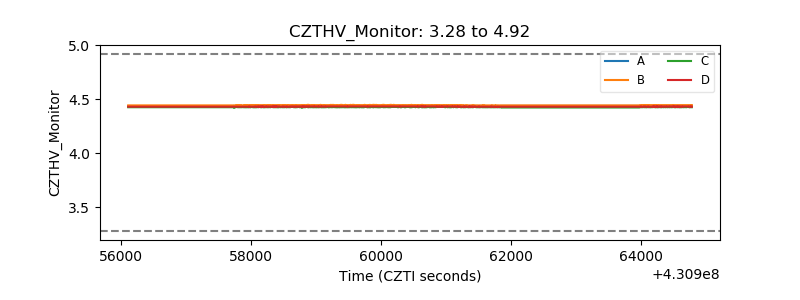 |
| D_VDD | 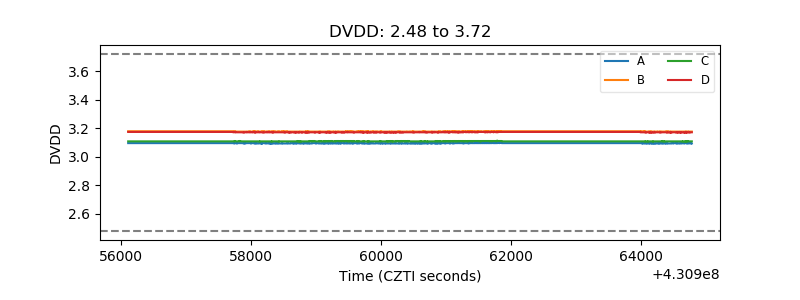 |
| Temperature 1 | 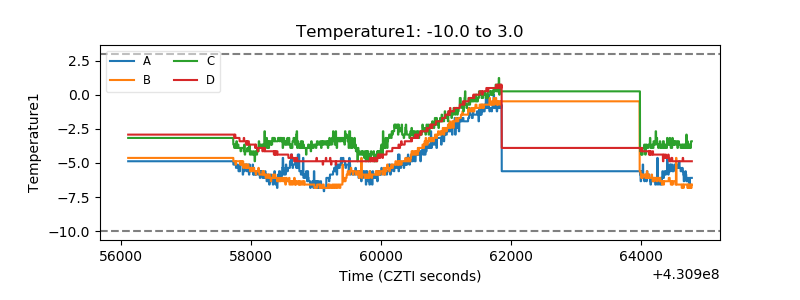 |
| Veto HV Monitor | 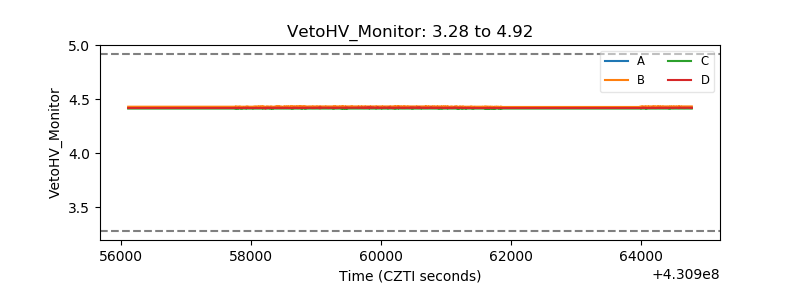 |
| Veto LLD | 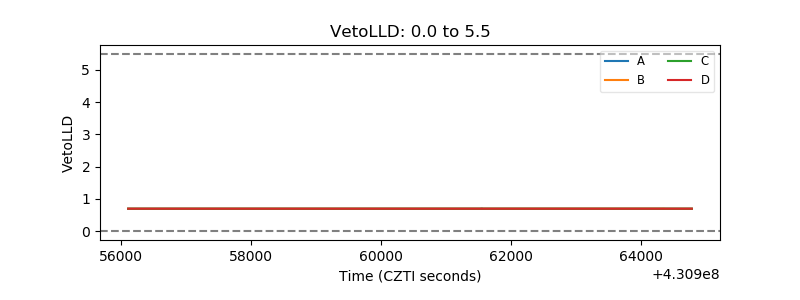 |
| Alpha Counter | 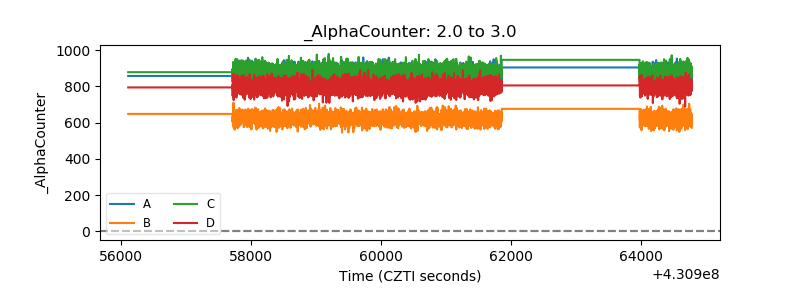 |
| _CPM_Rate | 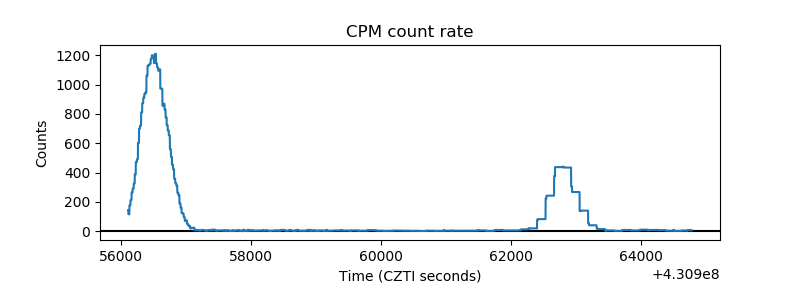 |
| CZT Counter | 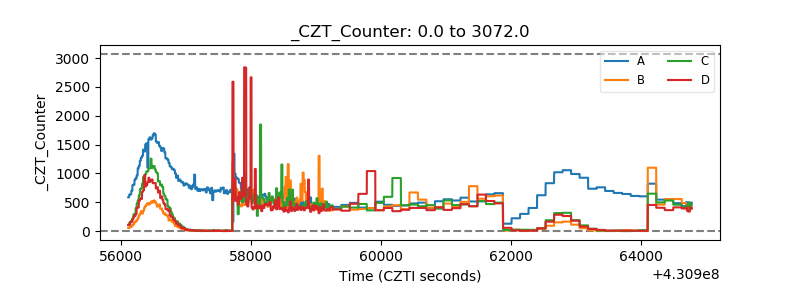 |
| +2.5 Volts monitor | 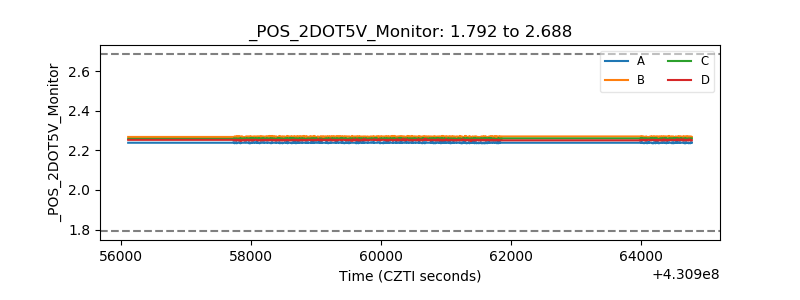 |
| +5 Volts monitor | 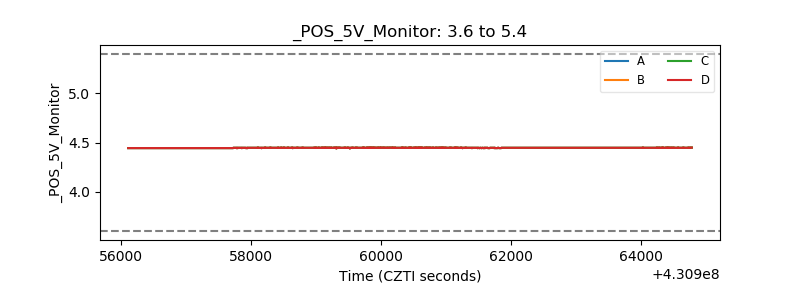 |
| _ROLL_ROT | 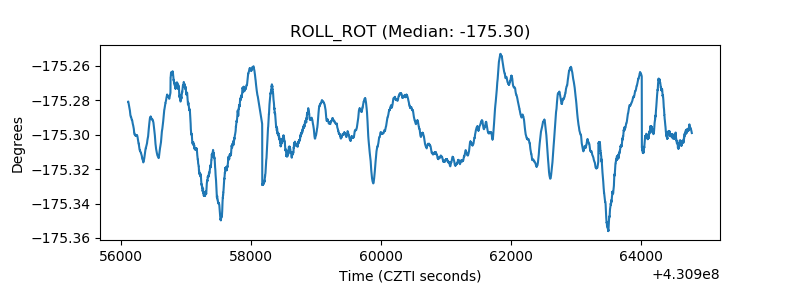 |
| _Roll_DEC | 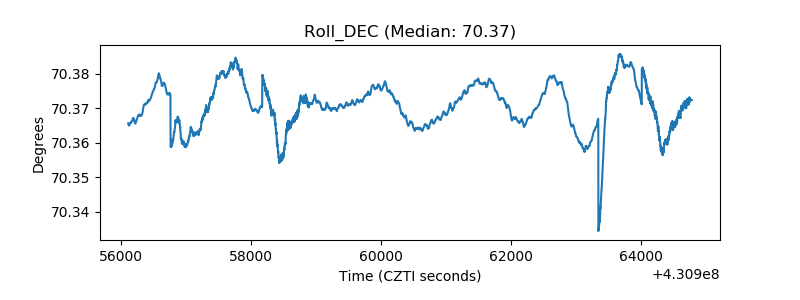 |
| _Roll_RA | 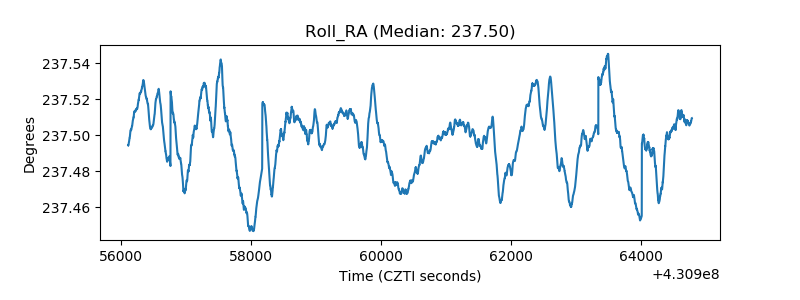 |
| Veto Counter | 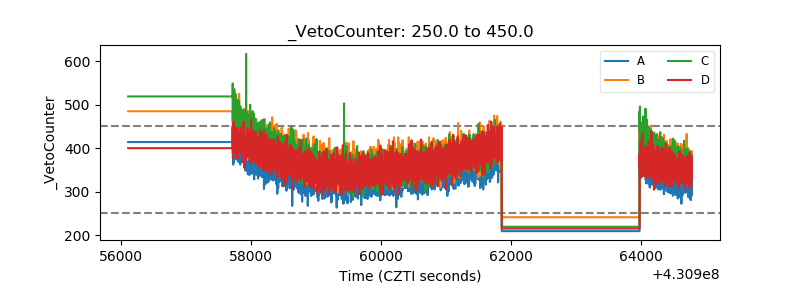 |