| Param | Original file | Final file |
|---|---|---|
| Filename | modeM0/AS1C07_001T12_9000005826_42810cztM0_level2.fits | modeM0/AS1C07_001T12_9000005826_42810cztM0_level2_quad_clean.evt |
| Size (bytes) | 303,416,640 | 86,463,360 |
| Size | 289.4 MB | 82.5 MB |
| Events in quadrant A | 3,075,720 | 568,803 |
| Events in quadrant B | 2,759,821 | 587,490 |
| Events in quadrant C | 2,511,323 | 568,411 |
| Events in quadrant D | 2,474,225 | 524,512 |
| Mode M0 | |||
|---|---|---|---|
| Quadrant | BADHDUFLAG | Total packets | Discarded packets |
| A | 0 | 12512 | 2 |
| B | 0 | 12059 | 2 |
| C | 0 | 10980 | 2 |
| D | 0 | 11480 | 2 |
| Mode SS | |||
|---|---|---|---|
| Quadrant | BADHDUFLAG | Total packets | Discarded packets |
| A | 0 | 108 | 0 |
| B | 0 | 108 | 0 |
| C | 0 | 108 | 0 |
| D | 0 | 108 | 0 |
| Mode M9 | |||
|---|---|---|---|
| Quadrant | BADHDUFLAG | Total packets | Discarded packets |
| A | 0 | 37 | 0 |
| B | 0 | 38 | 0 |
| C | 0 | 38 | 0 |
| D | 0 | 38 | 0 |
| Quadrant | Total seconds | Saturated seconds | Saturation percentage |
|---|---|---|---|
| A | 5264 | 117 | 2.222644% |
| B | 5264 | 45 | 0.854863% |
| C | 5264 | 7 | 0.132979% |
| D | 5264 | 63 | 1.196809% |
Noise dominated data is calculated using 1-second bins in cleaned event files. If a bin has >2000 counts, and if more than 50% of those come from <1% of pixels, then it is considered to be noise-dominated and hence unusable.
| Quadrant | # 1 sec bins | Bins with >0 counts | Bins with >2000 counts | High rate bins dominated by noise | Noise dominated (total time) | Noise dominated (detector-on time) | Marked lightcurve |
|---|---|---|---|---|---|---|---|
| A | 7237 | 5265 | 102 | 102 | 1.41% | 1.94% | 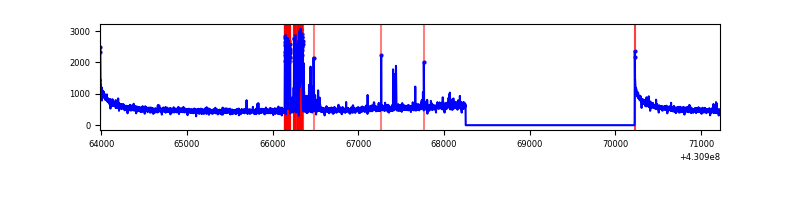 |
| B | 7237 | 5265 | 28 | 28 | 0.39% | 0.53% | 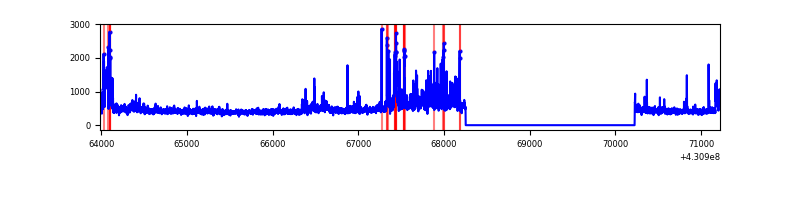 |
| C | 7237 | 5265 | 5 | 5 | 0.07% | 0.09% | 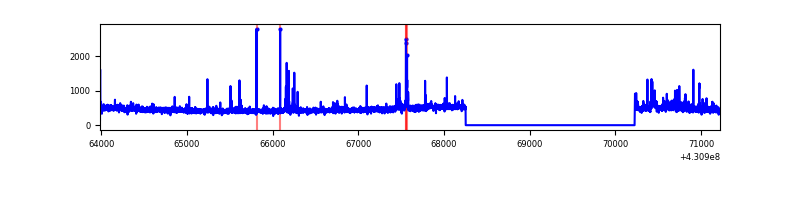 |
| D | 7237 | 5265 | 53 | 53 | 0.73% | 1.01% | 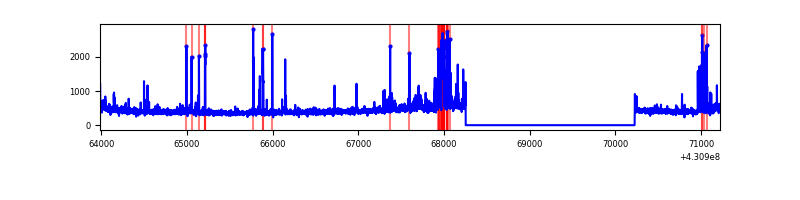 |
Top three noisy pixels from each quadrant. If the there are fewer than three noisy pixels in the level2.evt file, extra rows are filled as -1
| Pixel properties | Quadrant properties | ||||||
|---|---|---|---|---|---|---|---|
| Quadrant | DetID | PixID | Counts | Sigma | Mean | Median | Sigma |
| A | 10 | 83 | 567430 | 4995.32 | 550 | 539 | 113.5 |
| A | 15 | 237 | 303230 | 2667.25 | 550 | 539 | 113.5 |
| A | 12 | 189 | 33053 | 286.51 | 550 | 539 | 113.5 |
| B | 0 | 229 | 409068 | 3825.62 | 551 | 535 | 106.8 |
| B | 4 | 171 | 96031 | 894.25 | 551 | 535 | 106.8 |
| B | 5 | 255 | 40709 | 376.2 | 551 | 535 | 106.8 |
| C | 15 | 214 | 213332 | 1704.87 | 538 | 541 | 124.8 |
| C | 14 | 254 | 60027 | 476.6 | 538 | 541 | 124.8 |
| C | 15 | 111 | 46436 | 367.71 | 538 | 541 | 124.8 |
| D | 10 | 118 | 108574 | 822.13 | 535 | 519 | 131.4 |
| D | 12 | 6 | 84603 | 639.75 | 535 | 519 | 131.4 |
| D | 1 | 52 | 57679 | 434.9 | 535 | 519 | 131.4 |
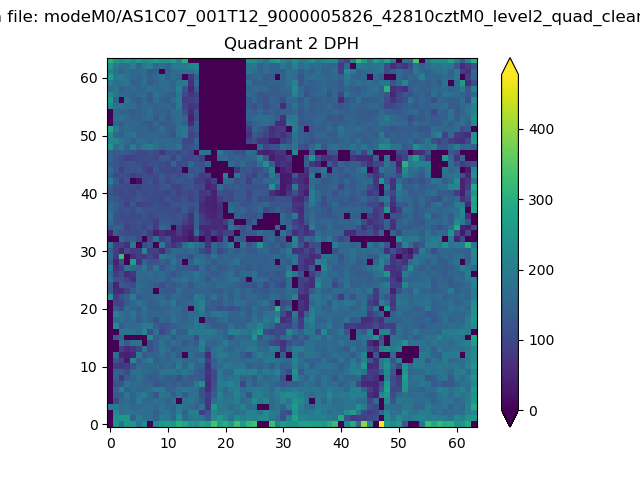
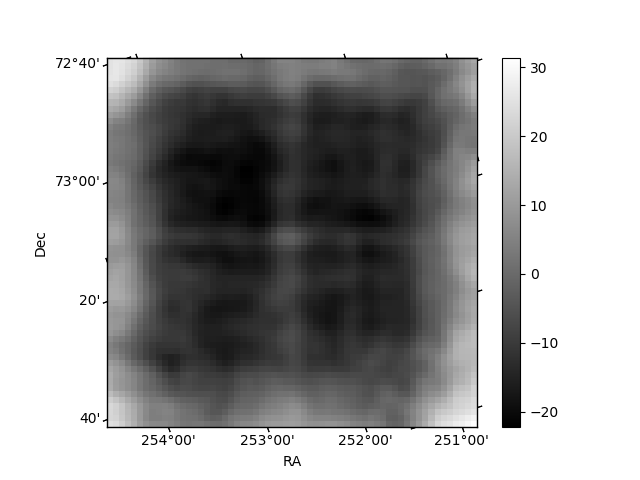
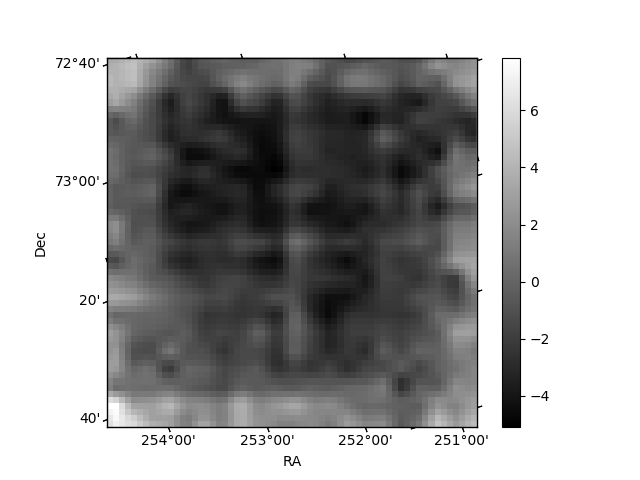
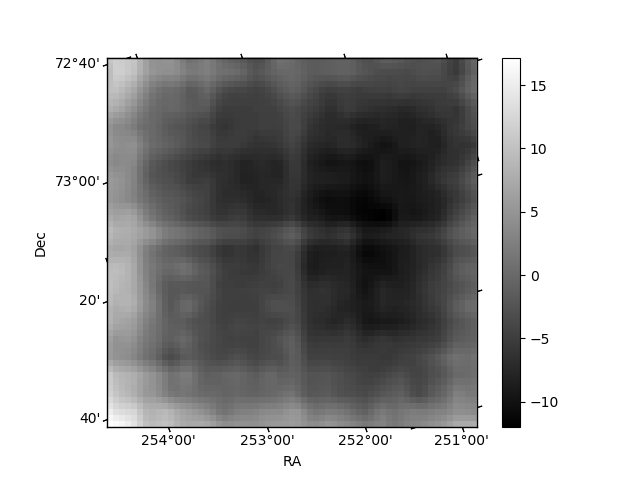
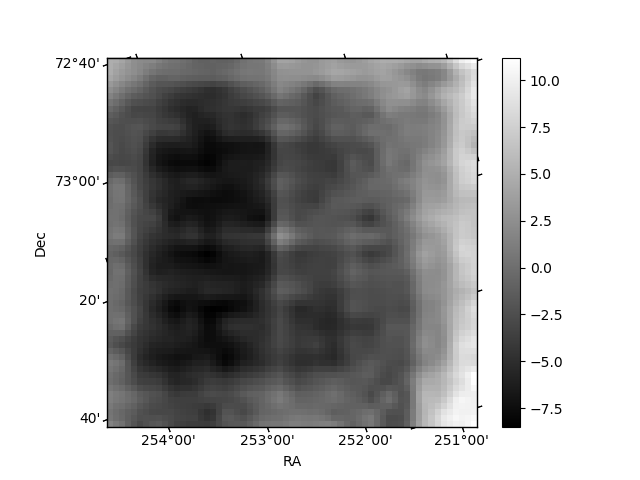
Histogram calculated using DETX and DETY for each event in the final _common_clean file
| Quadrant A | 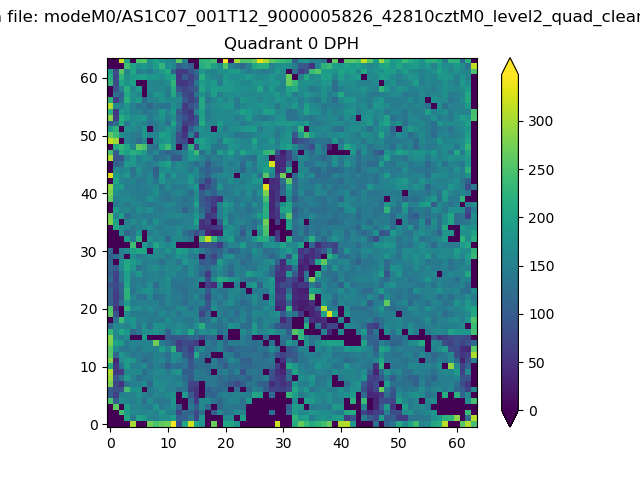 |
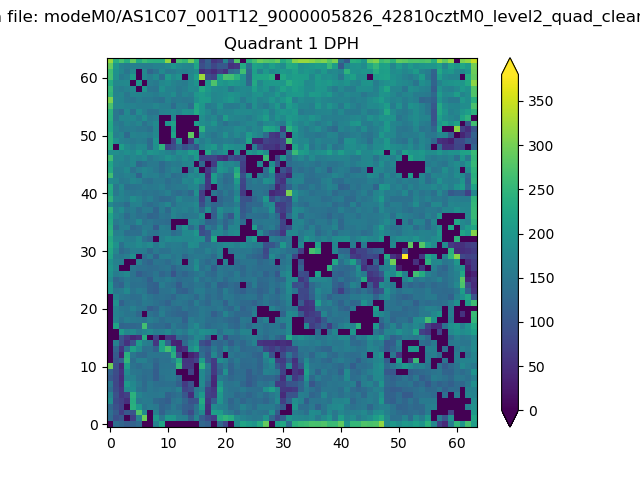 |
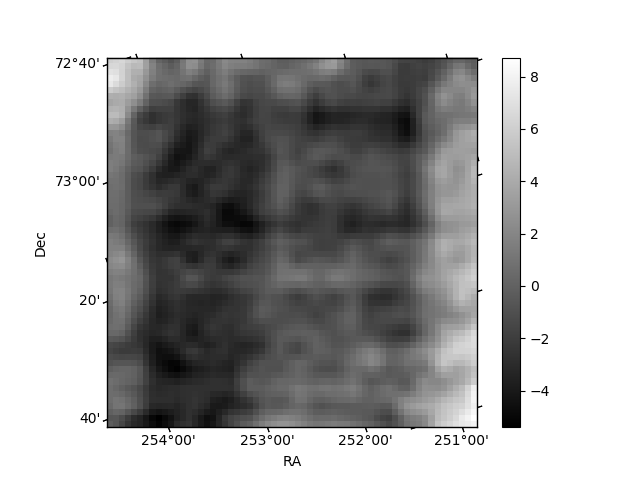
Quadrant B |
|---|---|---|---|
| Quadrant D | 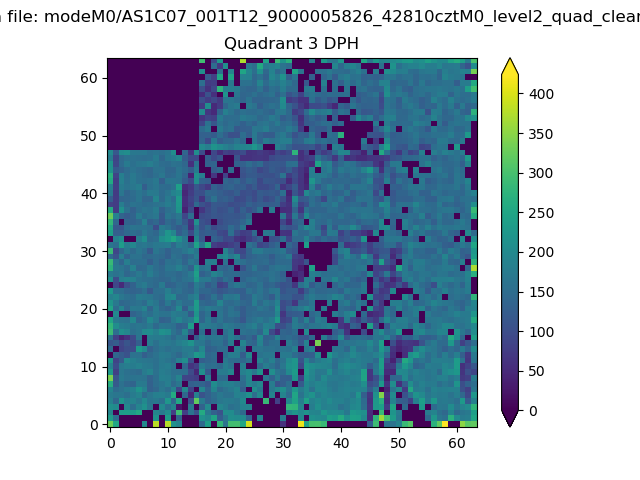 |
 |
Quadrant C |
| Plot type | Count rate plots | Images |
|---|---|---|
| Comparison with Poisson distribution Blue bars denote a histogram of data divided into 1 sec bins. Red curve is a Poisson curve with rate = median count rate of data. |
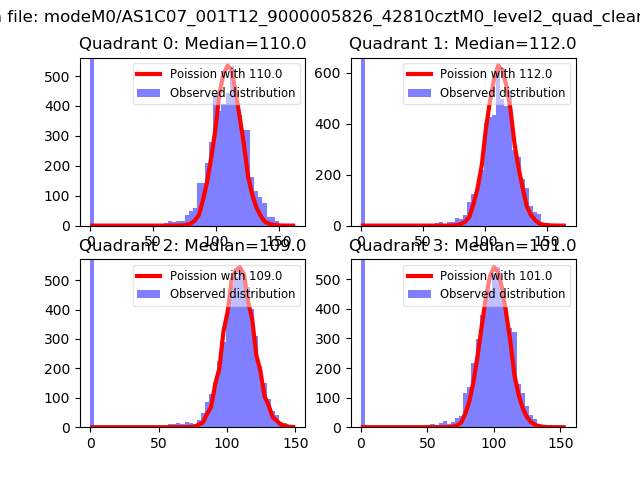 |
 |
| Quadrant-wise count rates Data is divided into 100 sec bins |
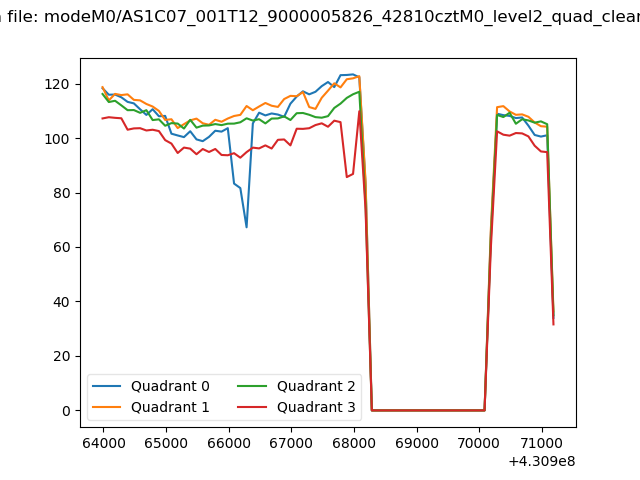 |
|
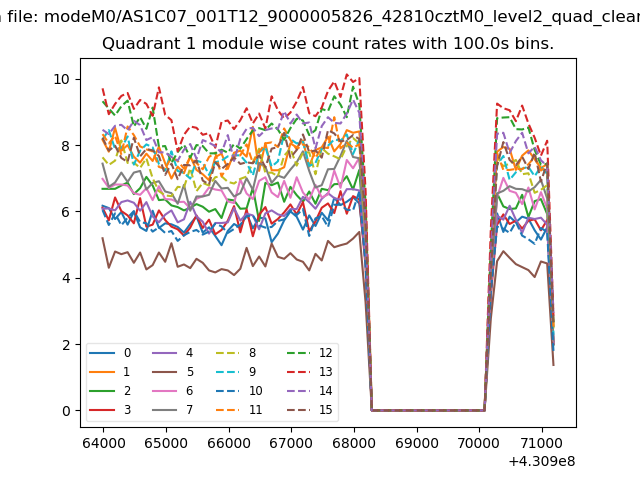
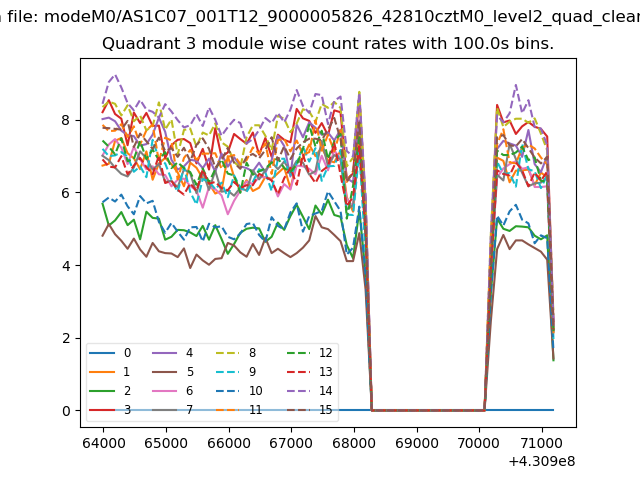
| Module-wise count rates for Quadrant A Data is divided into 100 sec bins |
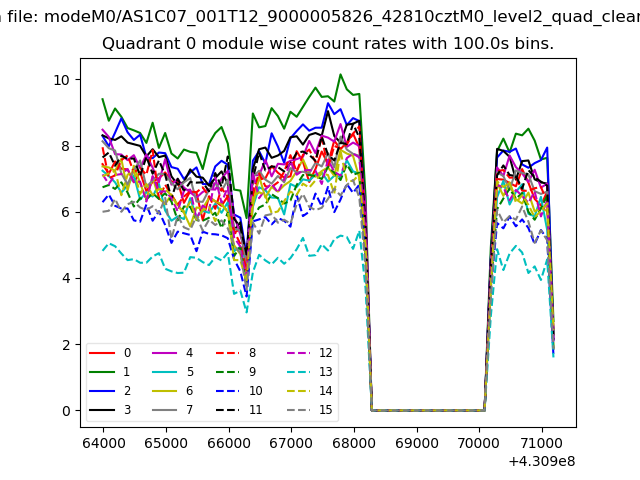 |
 |
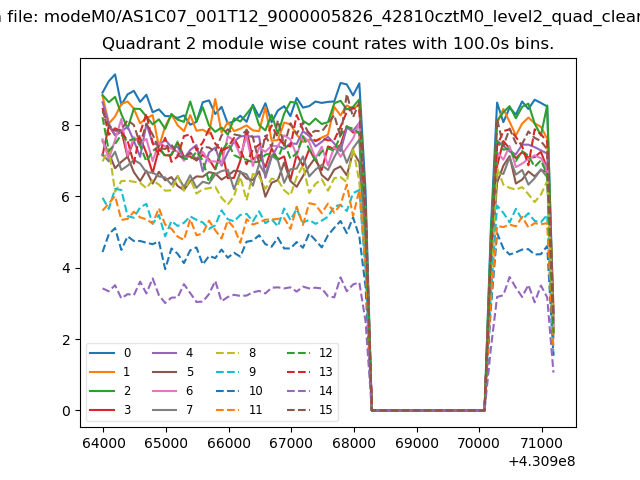
| Module-wise count rates for Quadrant B Data is divided into 100 sec bins |
 |
 |
| Module-wise count rates for Quadrant C Data is divided into 100 sec bins |
 |
 |
| Module-wise count rates for Quadrant D Data is divided into 100 sec bins |
 |
 |
| Parameter | Plot |
|---|---|
| CZT HV Monitor | 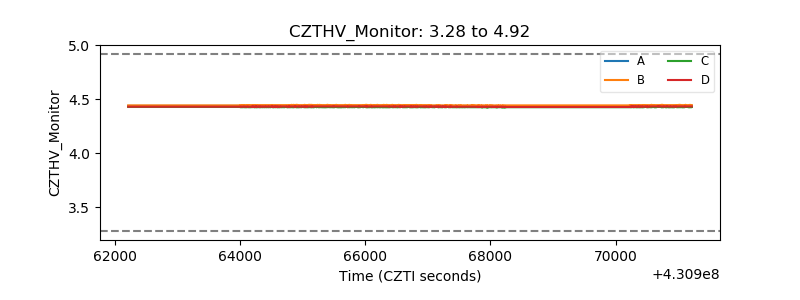 |
| D_VDD | 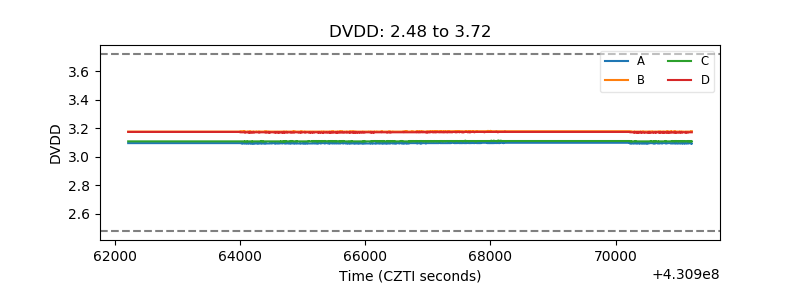 |
| Temperature 1 | 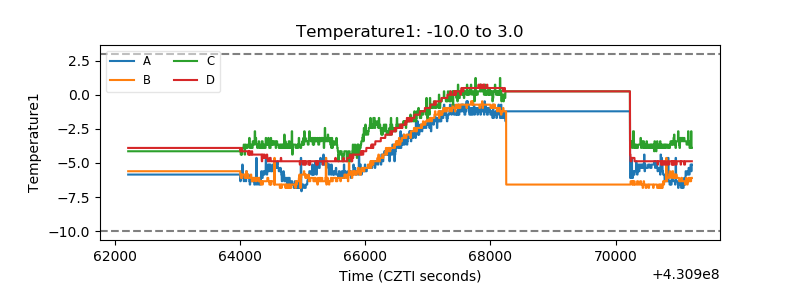 |
| Veto HV Monitor | 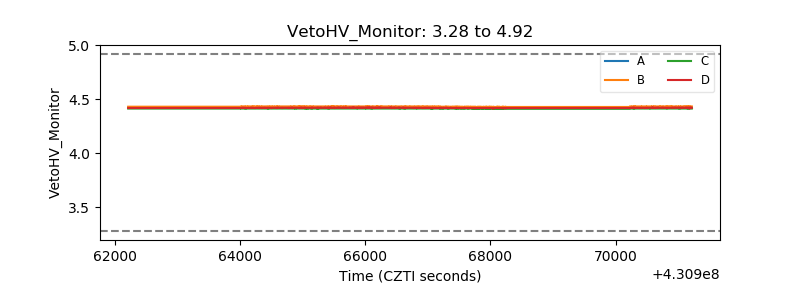 |
| Veto LLD | 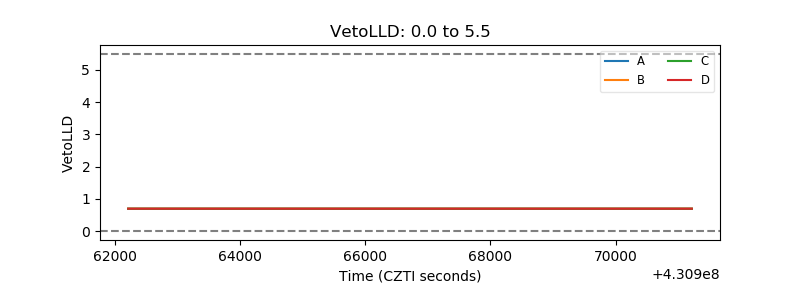 |
| Alpha Counter | 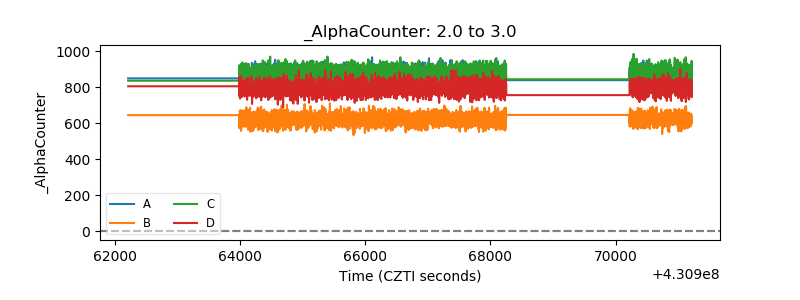 |
| _CPM_Rate | 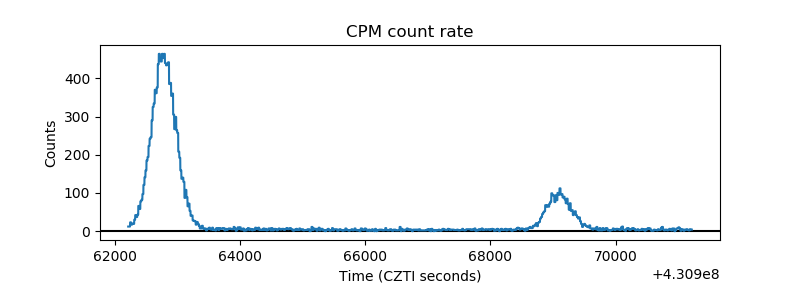 |
| CZT Counter | 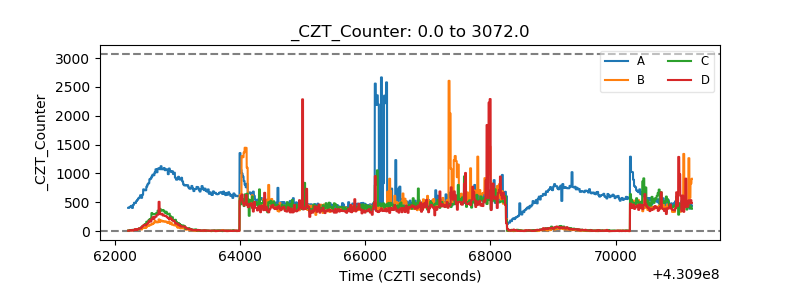 |
| +2.5 Volts monitor | 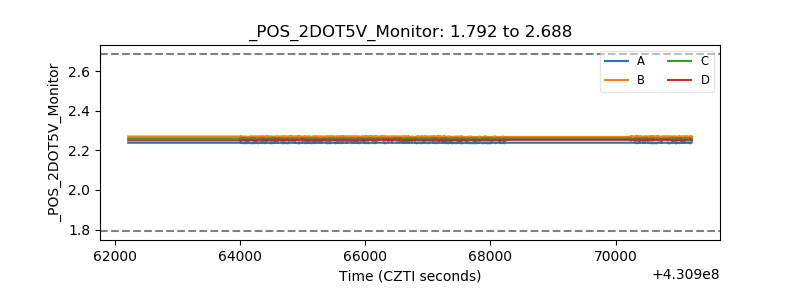 |
| +5 Volts monitor | 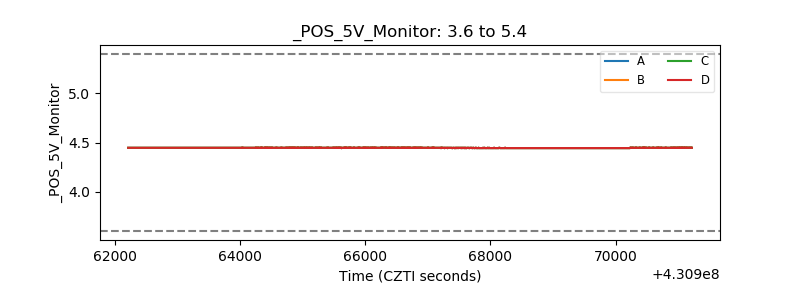 |
| _ROLL_ROT | 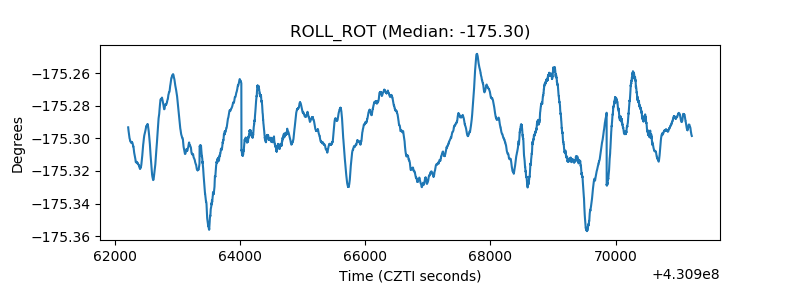 |
| _Roll_DEC | 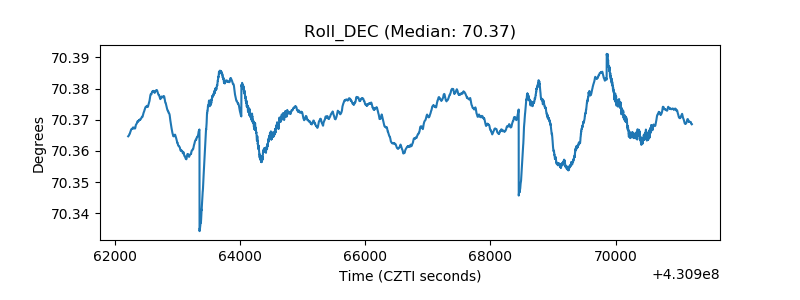 |
| _Roll_RA | 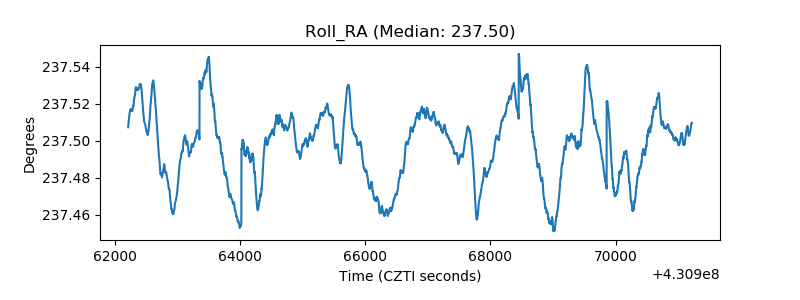 |
| Veto Counter | 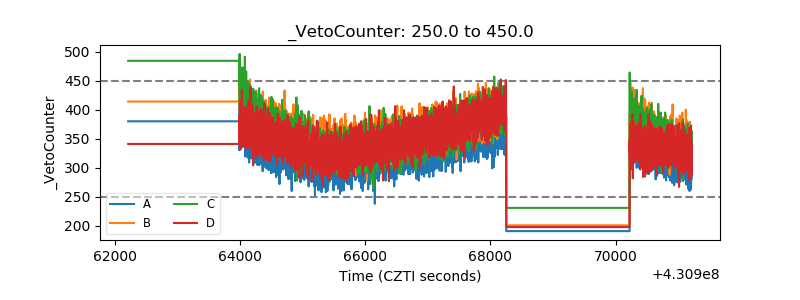 |