| Param | Original file | Final file |
|---|---|---|
| Filename | modeM0/AS1C07_001T12_9000005826_42811cztM0_level2.fits | modeM0/AS1C07_001T12_9000005826_42811cztM0_level2_quad_clean.evt |
| Size (bytes) | 348,264,000 | 88,704,000 |
| Size | 332.1 MB | 84.6 MB |
| Events in quadrant A | 3,118,513 | 591,897 |
| Events in quadrant B | 3,335,694 | 598,303 |
| Events in quadrant C | 2,726,902 | 580,956 |
| Events in quadrant D | 3,279,805 | 527,519 |
| Mode M0 | |||
|---|---|---|---|
| Quadrant | BADHDUFLAG | Total packets | Discarded packets |
| A | 0 | 12651 | 2 |
| B | 0 | 13957 | 2 |
| C | 0 | 11666 | 2 |
| D | 0 | 13904 | 2 |
| Mode SS | |||
|---|---|---|---|
| Quadrant | BADHDUFLAG | Total packets | Discarded packets |
| A | 0 | 116 | 0 |
| B | 0 | 116 | 0 |
| C | 0 | 116 | 0 |
| D | 0 | 116 | 0 |
| Mode M9 | |||
|---|---|---|---|
| Quadrant | BADHDUFLAG | Total packets | Discarded packets |
| A | 0 | 35 | 0 |
| B | 0 | 36 | 0 |
| C | 0 | 36 | 0 |
| D | 0 | 36 | 0 |
| Quadrant | Total seconds | Saturated seconds | Saturation percentage |
|---|---|---|---|
| A | 5528 | 34 | 0.615051% |
| B | 5528 | 145 | 2.623010% |
| C | 5528 | 23 | 0.416064% |
| D | 5527 | 229 | 4.143297% |
Noise dominated data is calculated using 1-second bins in cleaned event files. If a bin has >2000 counts, and if more than 50% of those come from <1% of pixels, then it is considered to be noise-dominated and hence unusable.
| Quadrant | # 1 sec bins | Bins with >0 counts | Bins with >2000 counts | High rate bins dominated by noise | Noise dominated (total time) | Noise dominated (detector-on time) | Marked lightcurve |
|---|---|---|---|---|---|---|---|
| A | 7202 | 5529 | 28 | 28 | 0.39% | 0.51% | 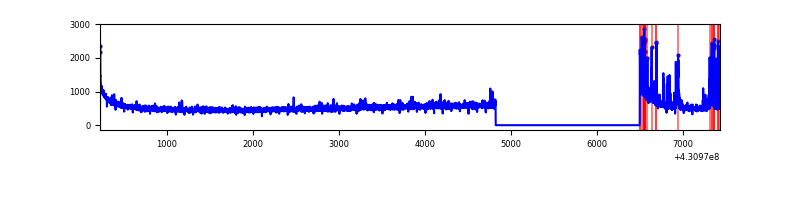 |
| B | 7202 | 5529 | 99 | 99 | 1.37% | 1.79% | 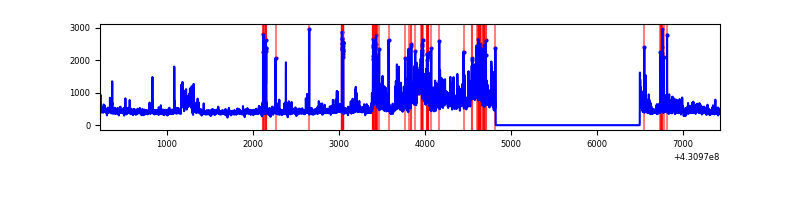 |
| C | 7202 | 5529 | 20 | 20 | 0.28% | 0.36% | 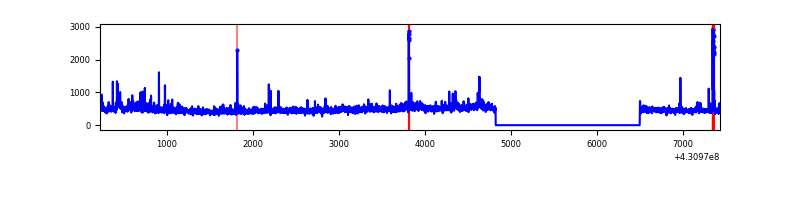 |
| D | 7201 | 5528 | 199 | 199 | 2.76% | 3.60% | 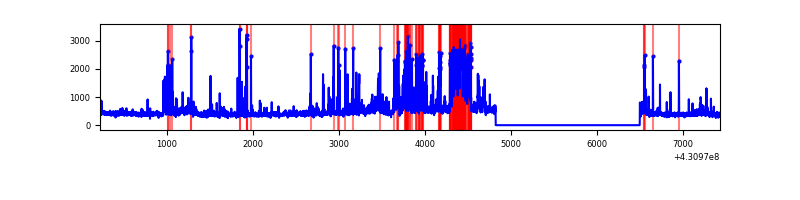 |
Top three noisy pixels from each quadrant. If the there are fewer than three noisy pixels in the level2.evt file, extra rows are filled as -1
| Pixel properties | Quadrant properties | ||||||
|---|---|---|---|---|---|---|---|
| Quadrant | DetID | PixID | Counts | Sigma | Mean | Median | Sigma |
| A | 10 | 83 | 618429 | 5231.99 | 582 | 570 | 118.1 |
| A | 10 | 255 | 197393 | 1666.68 | 582 | 570 | 118.1 |
| A | 12 | 189 | 34402 | 286.49 | 582 | 570 | 118.1 |
| B | 0 | 229 | 706696 | 6414.04 | 578 | 562 | 110.1 |
| B | 4 | 171 | 127942 | 1157.03 | 578 | 562 | 110.1 |
| B | 5 | 255 | 93010 | 839.73 | 578 | 562 | 110.1 |
| C | 15 | 214 | 228024 | 1719.34 | 567 | 570 | 132.3 |
| C | 3 | 233 | 84687 | 635.85 | 567 | 570 | 132.3 |
| C | 0 | 207 | 62098 | 465.1 | 567 | 570 | 132.3 |
| D | 1 | 52 | 653949 | 4811.05 | 560 | 544 | 135.8 |
| D | 12 | 6 | 136435 | 1000.57 | 560 | 544 | 135.8 |
| D | 10 | 118 | 129375 | 948.59 | 560 | 544 | 135.8 |
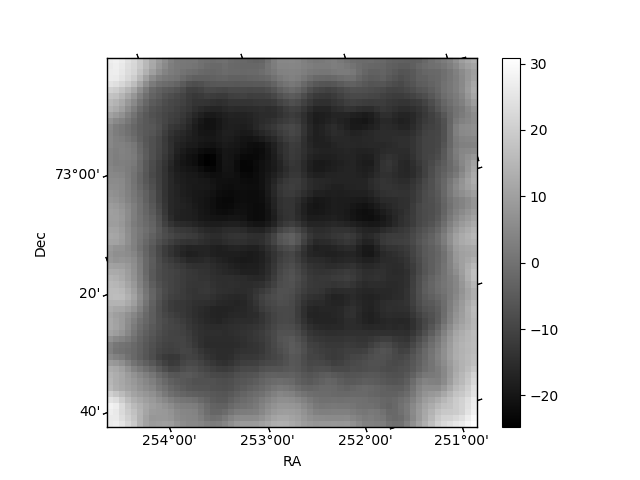
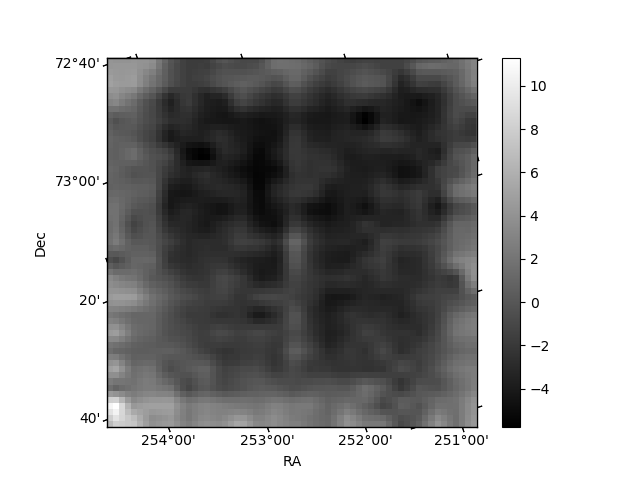
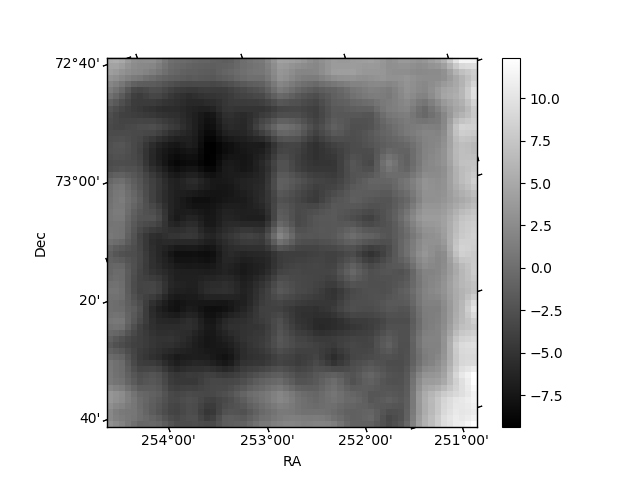
Histogram calculated using DETX and DETY for each event in the final _common_clean file
| Quadrant A | 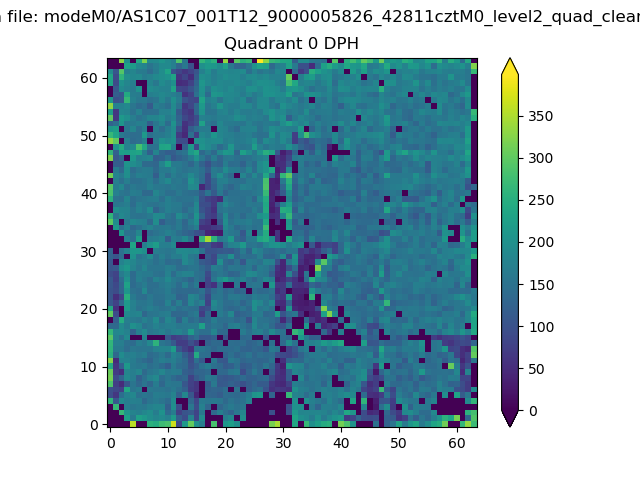 |
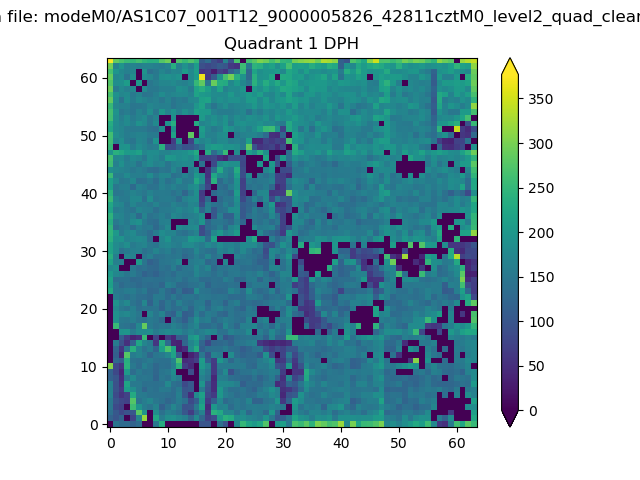 |
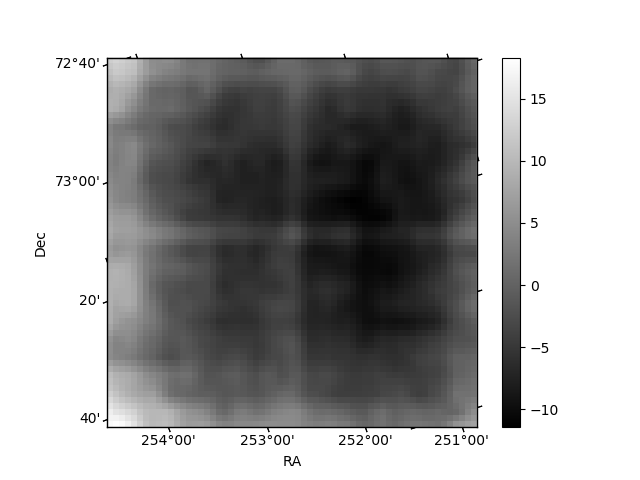
Quadrant B |
|---|---|---|---|
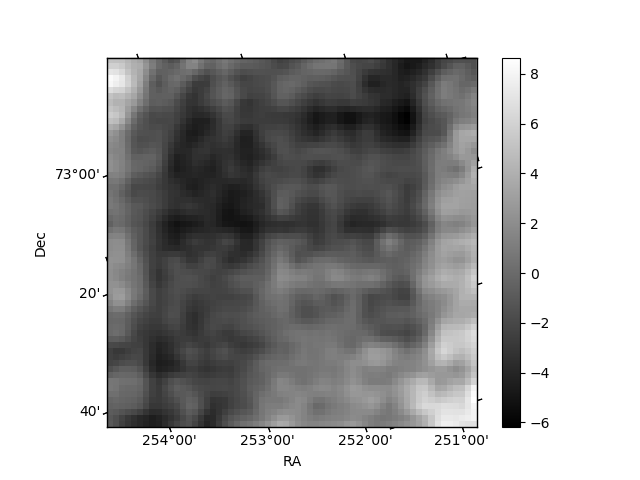
| Quadrant D | 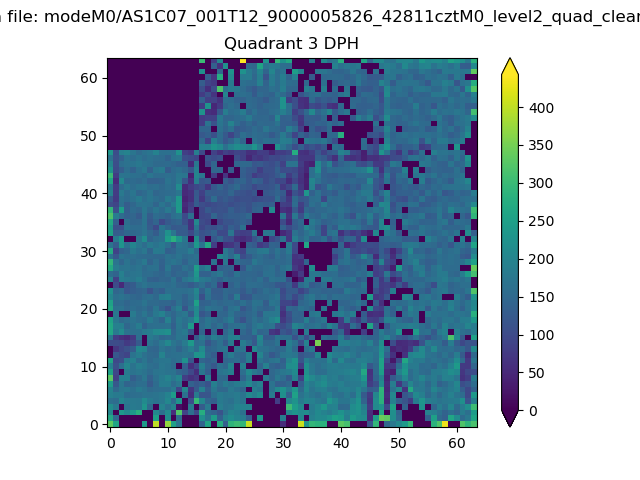 |
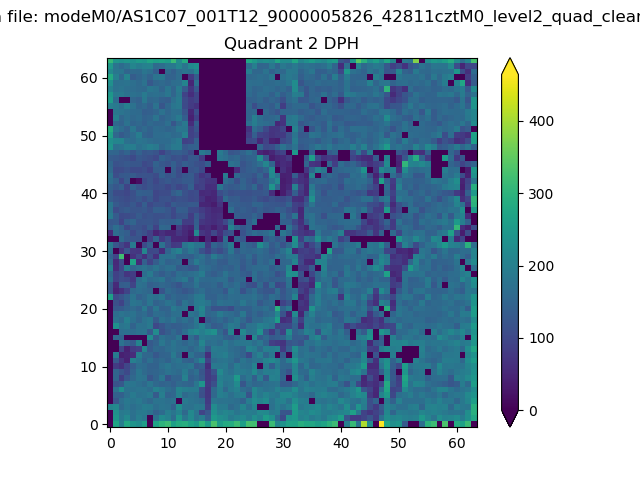 |
Quadrant C |
| Plot type | Count rate plots | Images |
|---|---|---|
| Comparison with Poisson distribution Blue bars denote a histogram of data divided into 1 sec bins. Red curve is a Poisson curve with rate = median count rate of data. |
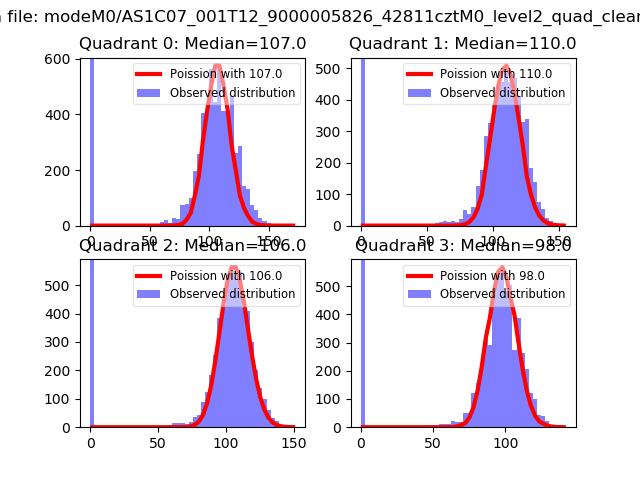 |
 |
| Quadrant-wise count rates Data is divided into 100 sec bins |
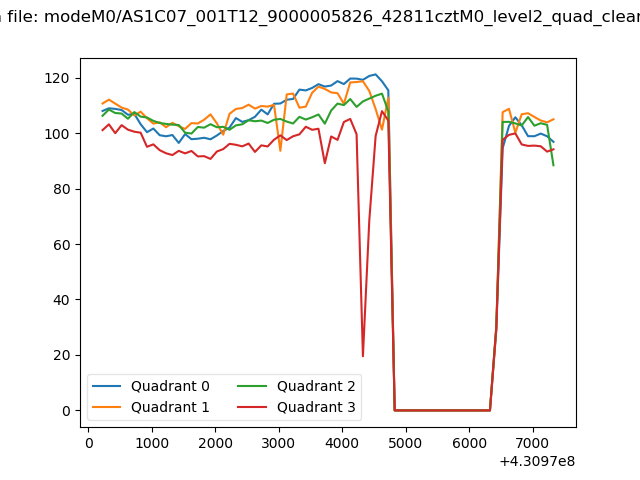 |
|
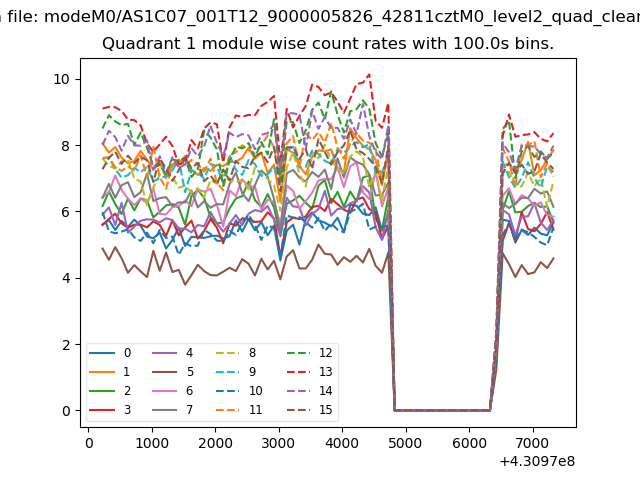
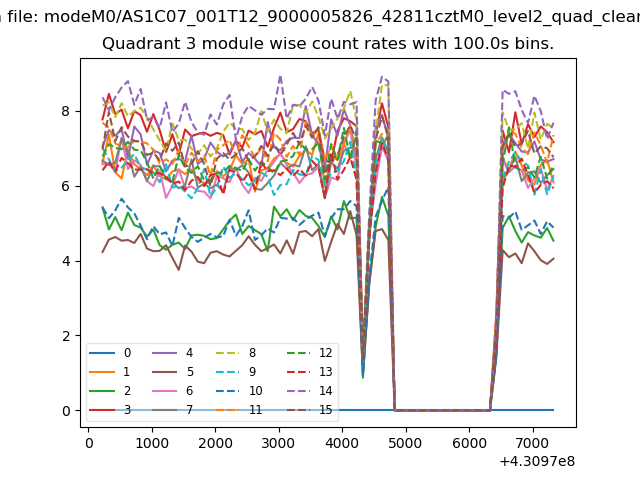
| Module-wise count rates for Quadrant A Data is divided into 100 sec bins |
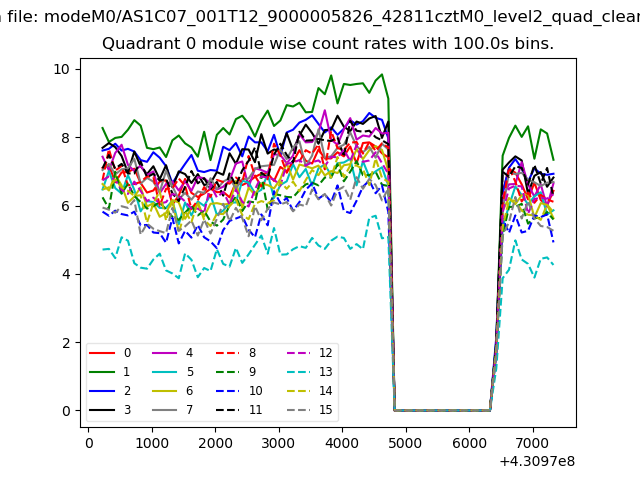 |
 |
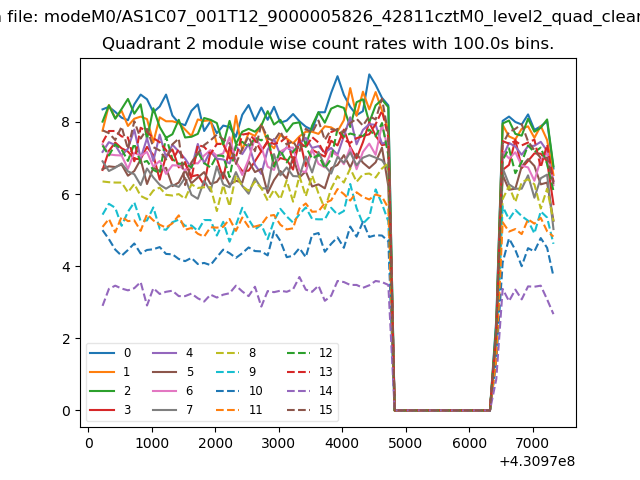
| Module-wise count rates for Quadrant B Data is divided into 100 sec bins |
 |
 |
| Module-wise count rates for Quadrant C Data is divided into 100 sec bins |
 |
 |
| Module-wise count rates for Quadrant D Data is divided into 100 sec bins |
 |
 |
| Parameter | Plot |
|---|---|
| CZT HV Monitor | 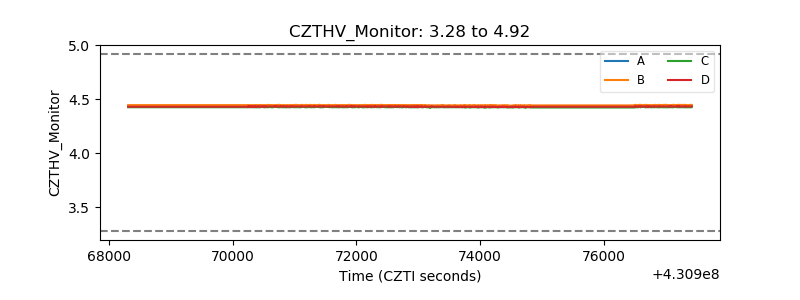 |
| D_VDD | 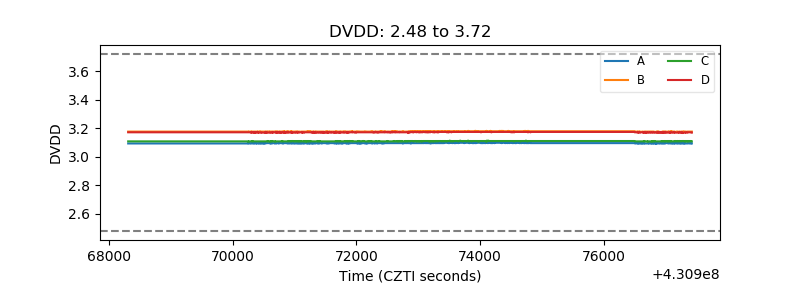 |
| Temperature 1 | 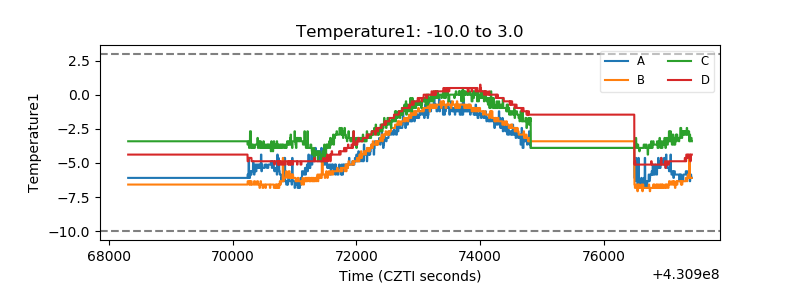 |
| Veto HV Monitor | 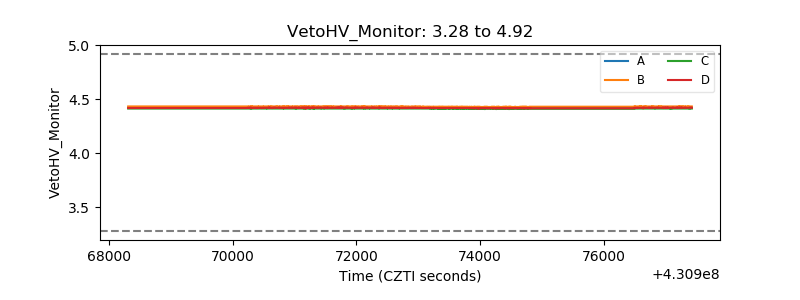 |
| Veto LLD | 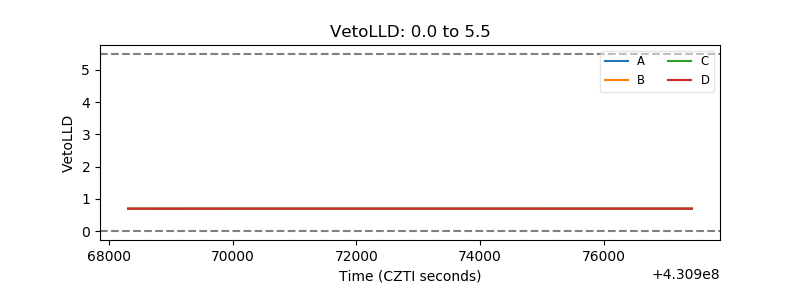 |
| Alpha Counter | 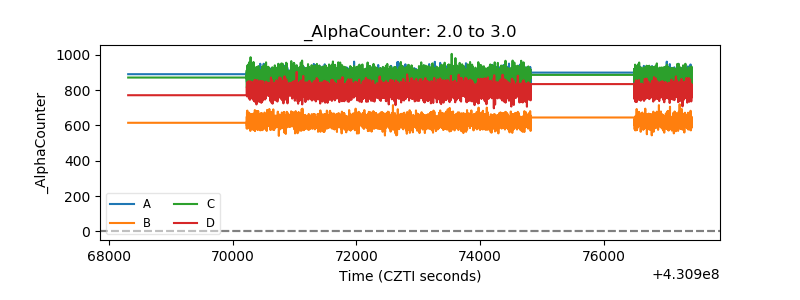 |
| _CPM_Rate | 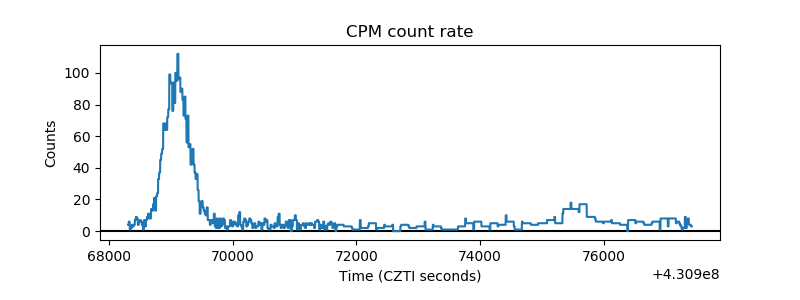 |
| CZT Counter | 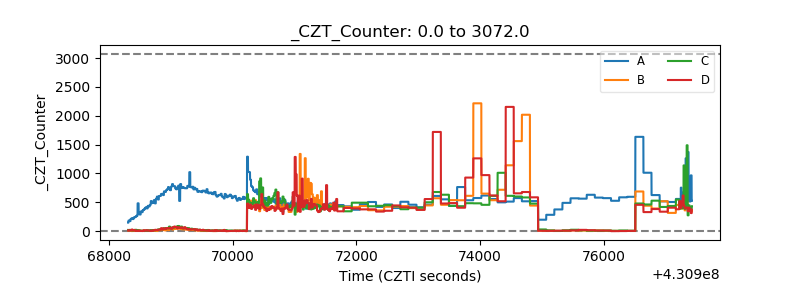 |
| +2.5 Volts monitor | 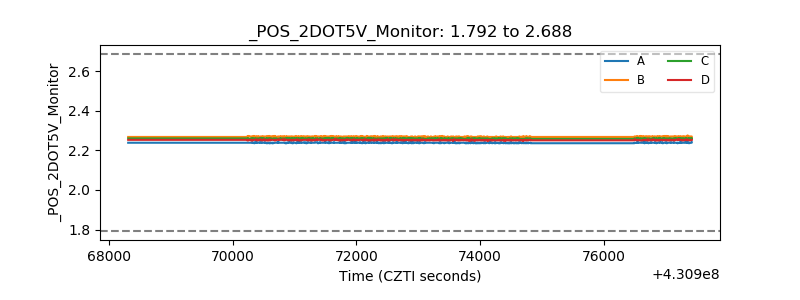 |
| +5 Volts monitor | 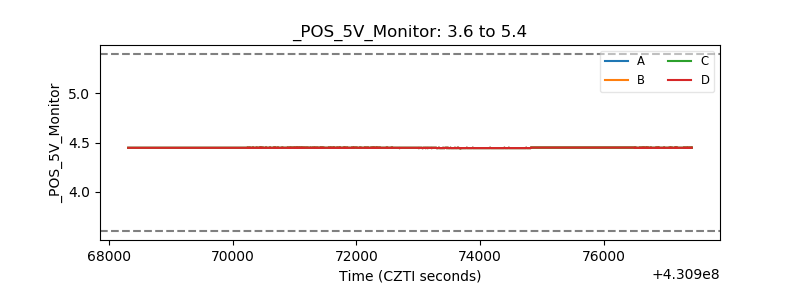 |
| _ROLL_ROT | 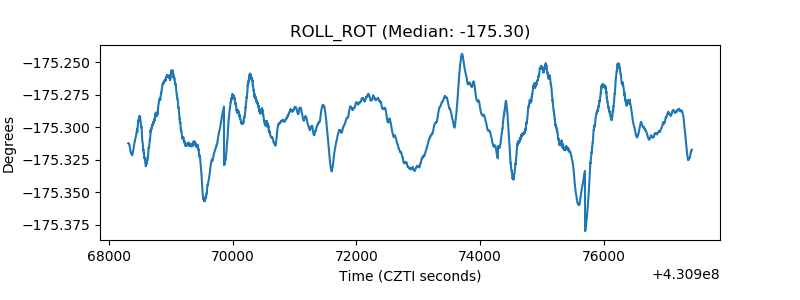 |
| _Roll_DEC | 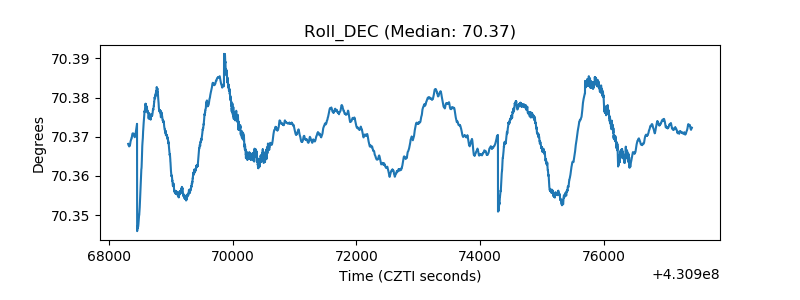 |
| _Roll_RA | 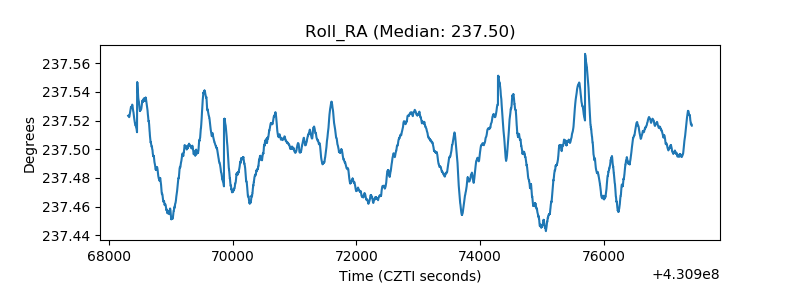 |
| Veto Counter | 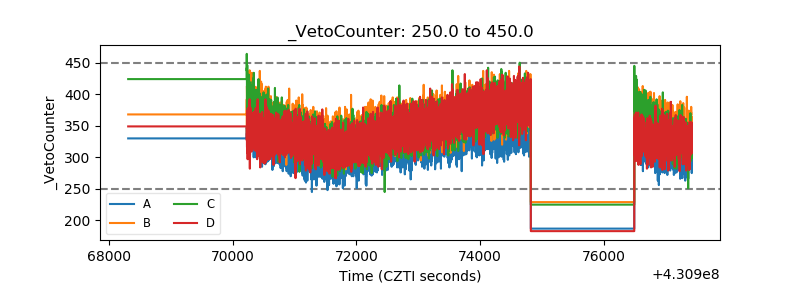 |