| Param | Original file | Final file |
|---|---|---|
| Filename | modeM0/AS1C07_001T12_9000005826_42813cztM0_level2.fits | modeM0/AS1C07_001T12_9000005826_42813cztM0_level2_quad_clean.evt |
| Size (bytes) | 391,855,680 | 93,971,520 |
| Size | 373.7 MB | 89.6 MB |
| Events in quadrant A | 3,179,461 | 638,648 |
| Events in quadrant B | 4,761,243 | 596,566 |
| Events in quadrant C | 2,903,419 | 620,649 |
| Events in quadrant D | 3,199,724 | 575,043 |
| Mode M0 | |||
|---|---|---|---|
| Quadrant | BADHDUFLAG | Total packets | Discarded packets |
| A | 0 | 12801 | 2 |
| B | 0 | 18390 | 2 |
| C | 0 | 12466 | 2 |
| D | 0 | 13959 | 2 |
| Mode SS | |||
|---|---|---|---|
| Quadrant | BADHDUFLAG | Total packets | Discarded packets |
| A | 0 | 122 | 0 |
| B | 0 | 122 | 0 |
| C | 0 | 120 | 0 |
| D | 0 | 120 | 0 |
| Mode M9 | |||
|---|---|---|---|
| Quadrant | BADHDUFLAG | Total packets | Discarded packets |
| A | 0 | 16 | 0 |
| B | 0 | 16 | 0 |
| C | 0 | 17 | 0 |
| D | 0 | 17 | 0 |
| Quadrant | Total seconds | Saturated seconds | Saturation percentage |
|---|---|---|---|
| A | 5929 | 12 | 0.202395% |
| B | 5929 | 621 | 10.473942% |
| C | 5929 | 18 | 0.303593% |
| D | 5928 | 56 | 0.944669% |
Noise dominated data is calculated using 1-second bins in cleaned event files. If a bin has >2000 counts, and if more than 50% of those come from <1% of pixels, then it is considered to be noise-dominated and hence unusable.
| Quadrant | # 1 sec bins | Bins with >0 counts | Bins with >2000 counts | High rate bins dominated by noise | Noise dominated (total time) | Noise dominated (detector-on time) | Marked lightcurve |
|---|---|---|---|---|---|---|---|
| A | 7242 | 5930 | 5 | 5 | 0.07% | 0.08% | 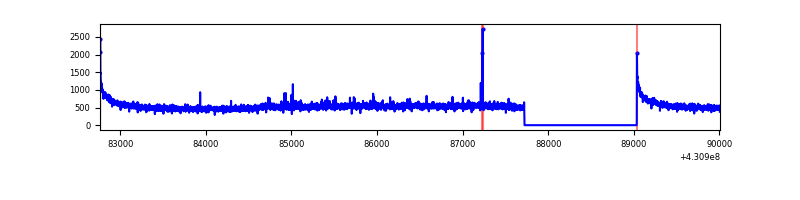 |
| B | 7242 | 5930 | 499 | 499 | 6.89% | 8.41% | 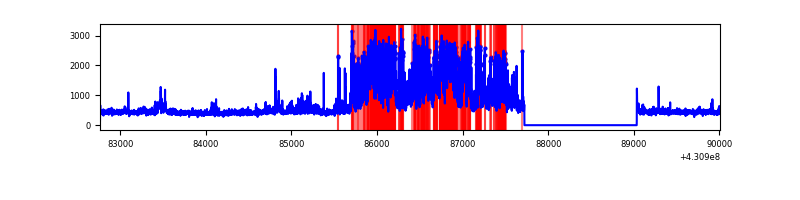 |
| C | 7242 | 5930 | 12 | 12 | 0.17% | 0.20% | 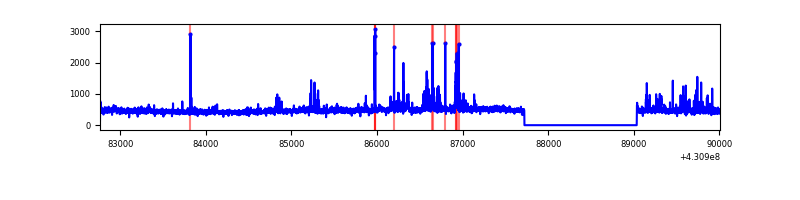 |
| D | 7241 | 5929 | 50 | 50 | 0.69% | 0.84% | 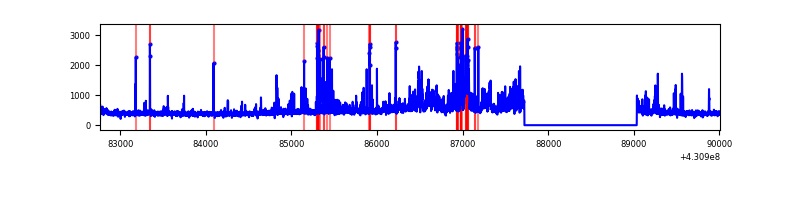 |
Top three noisy pixels from each quadrant. If the there are fewer than three noisy pixels in the level2.evt file, extra rows are filled as -1
| Pixel properties | Quadrant properties | ||||||
|---|---|---|---|---|---|---|---|
| Quadrant | DetID | PixID | Counts | Sigma | Mean | Median | Sigma |
| A | 10 | 83 | 661106 | 5063.18 | 636 | 623 | 130.4 |
| A | 12 | 189 | 27284 | 204.38 | 636 | 623 | 130.4 |
| A | 13 | 248 | 15036 | 110.49 | 636 | 623 | 130.4 |
| B | 4 | 81 | 1489881 | 12584.27 | 612 | 595 | 118.3 |
| B | 0 | 229 | 556320 | 4695.8 | 612 | 595 | 118.3 |
| B | 4 | 171 | 209434 | 1764.66 | 612 | 595 | 118.3 |
| C | 15 | 214 | 247042 | 1712.14 | 617 | 619 | 143.9 |
| C | 4 | 254 | 127372 | 880.68 | 617 | 619 | 143.9 |
| C | 14 | 254 | 42718 | 292.5 | 617 | 619 | 143.9 |
| D | 1 | 52 | 487040 | 3219.54 | 618 | 600 | 151.1 |
| D | 10 | 118 | 144187 | 950.34 | 618 | 600 | 151.1 |
| D | 12 | 233 | 32400 | 210.47 | 618 | 600 | 151.1 |
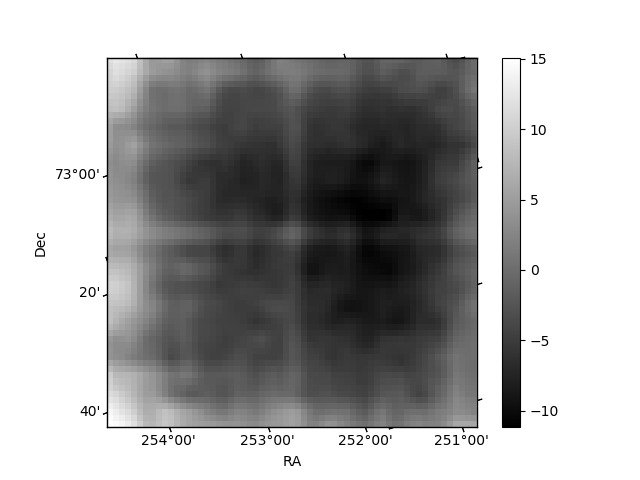
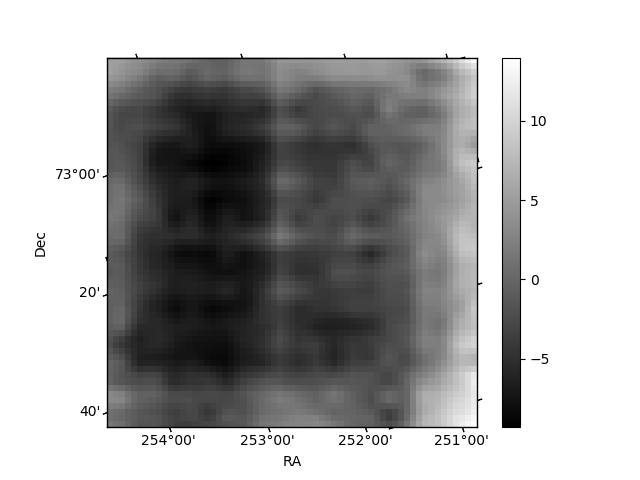
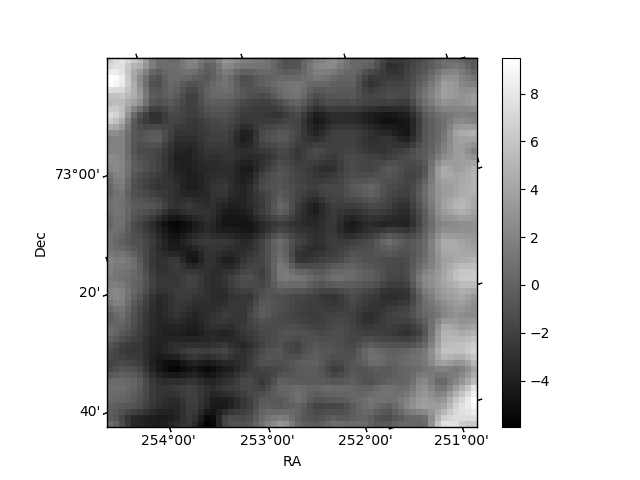
Histogram calculated using DETX and DETY for each event in the final _common_clean file
| Quadrant A | 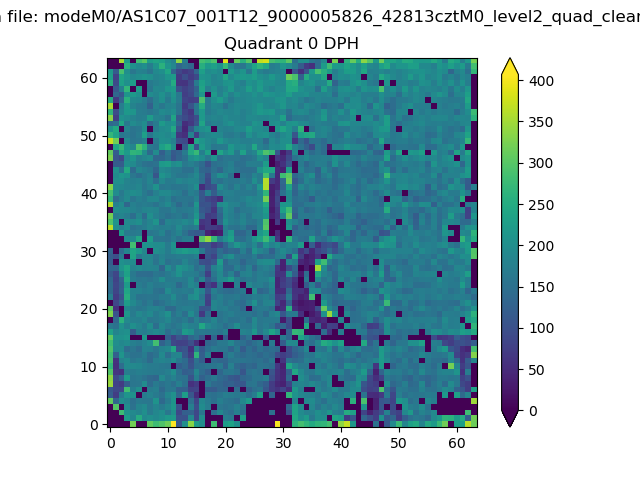 |
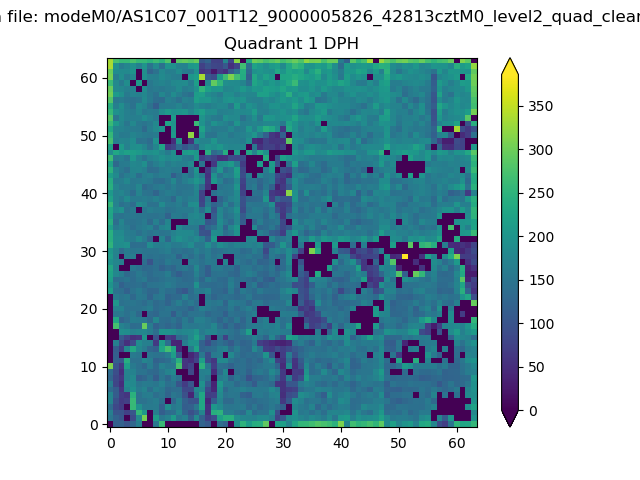 |
Quadrant B |
|---|---|---|---|
| Quadrant D | 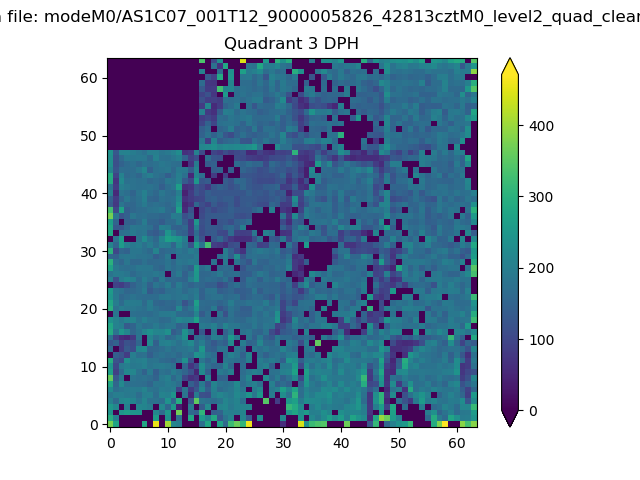 |
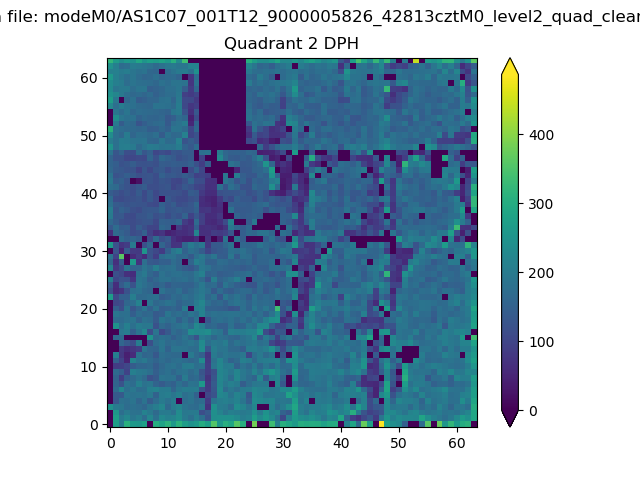 |
Quadrant C |
| Plot type | Count rate plots | Images |
|---|---|---|
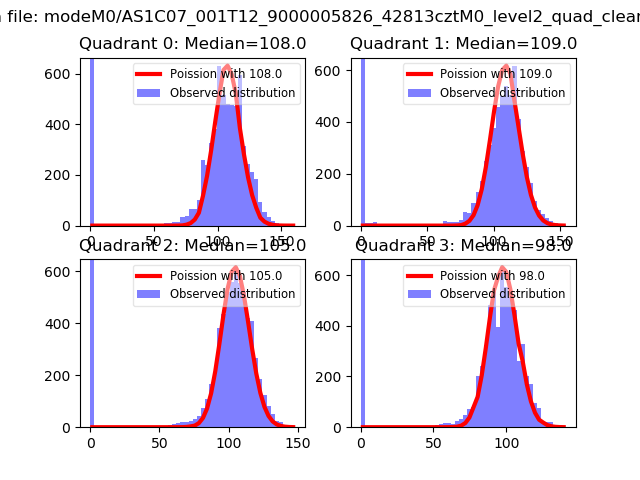
| Comparison with Poisson distribution Blue bars denote a histogram of data divided into 1 sec bins. Red curve is a Poisson curve with rate = median count rate of data. |
 |
 |
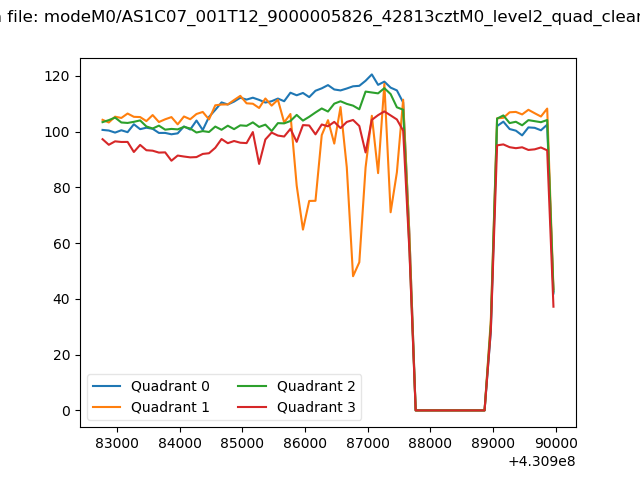
| Quadrant-wise count rates Data is divided into 100 sec bins |
 |
|
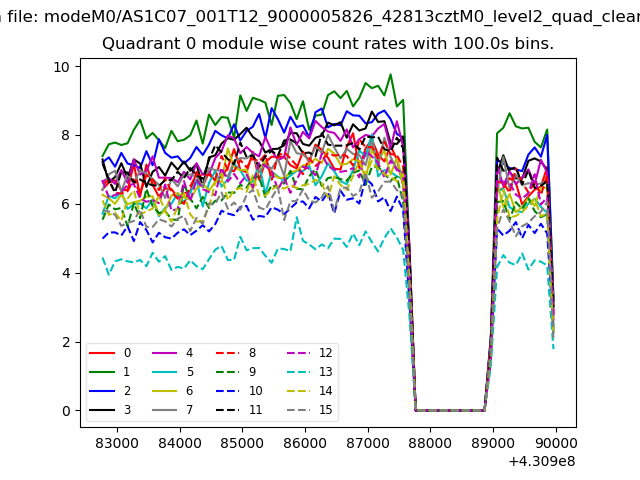
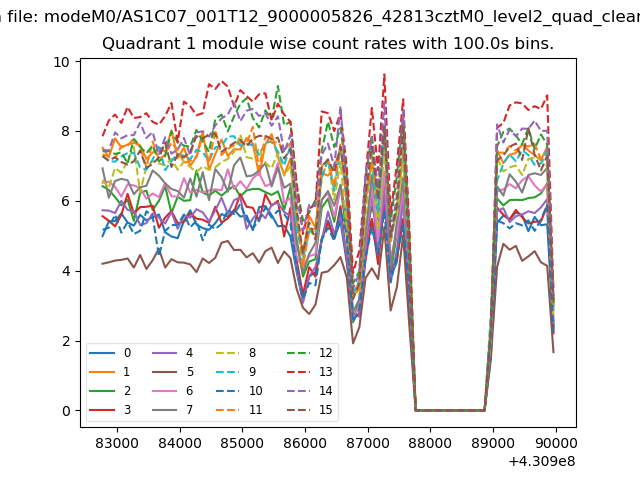
| Module-wise count rates for Quadrant A Data is divided into 100 sec bins |
 |
 |
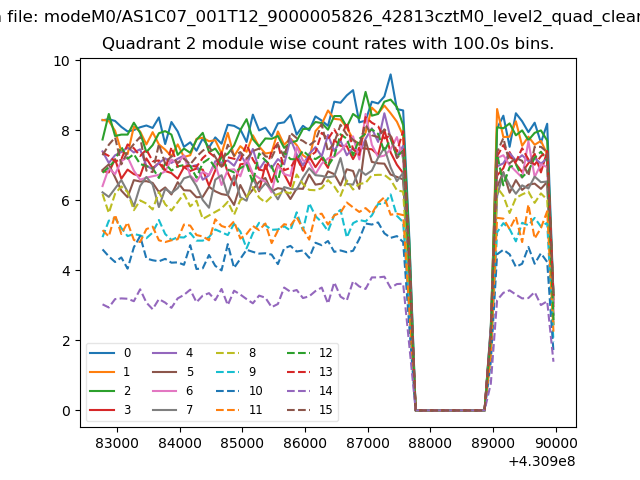
| Module-wise count rates for Quadrant B Data is divided into 100 sec bins |
 |
 |
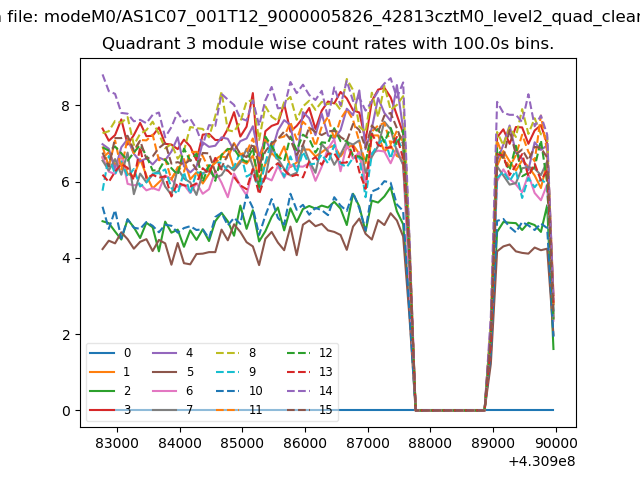
| Module-wise count rates for Quadrant C Data is divided into 100 sec bins |
 |
 |
| Module-wise count rates for Quadrant D Data is divided into 100 sec bins |
 |
 |
| Parameter | Plot |
|---|---|
| CZT HV Monitor | 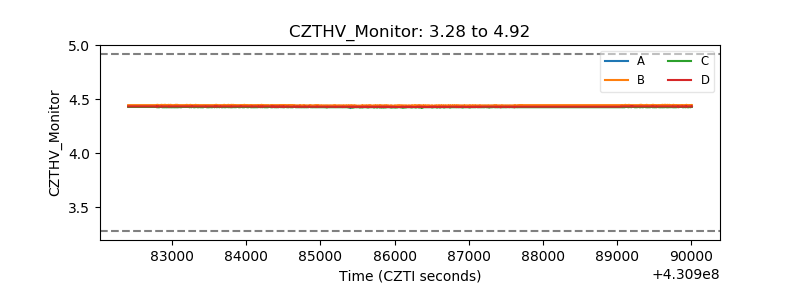 |
| D_VDD | 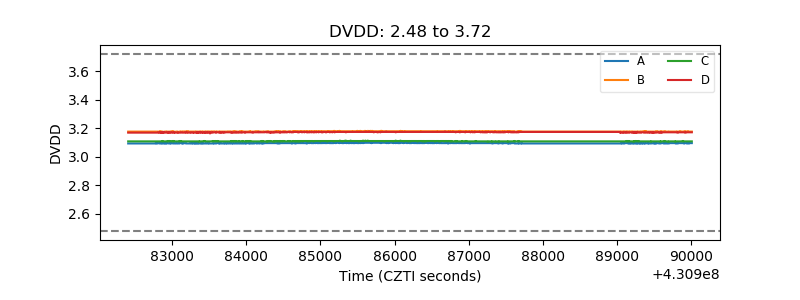 |
| Temperature 1 | 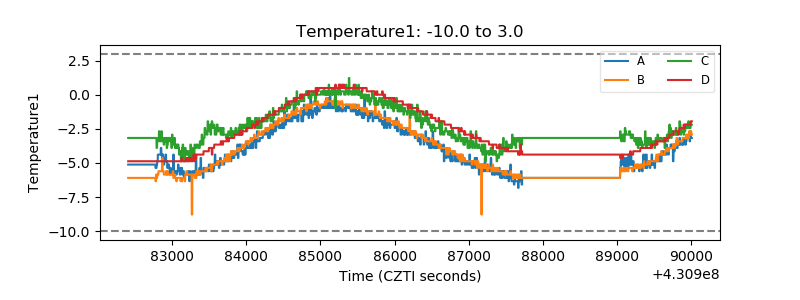 |
| Veto HV Monitor | 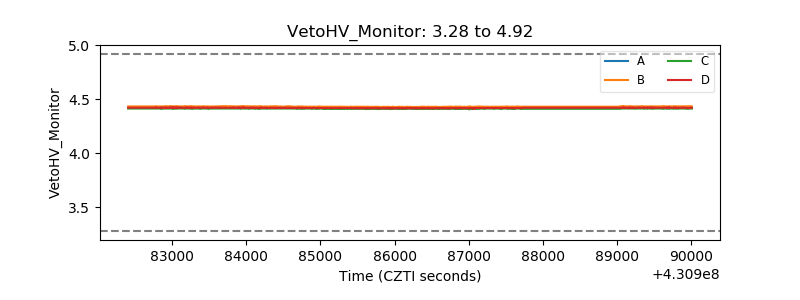 |
| Veto LLD | 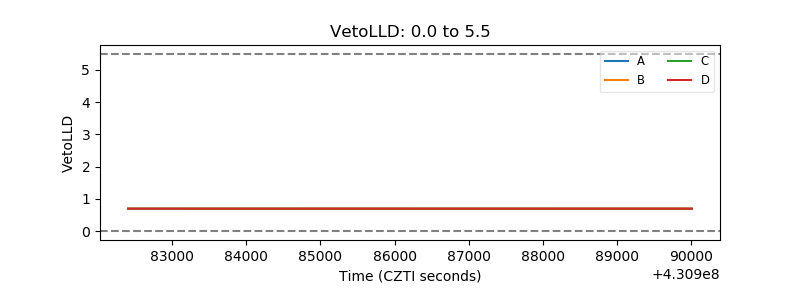 |
| Alpha Counter | 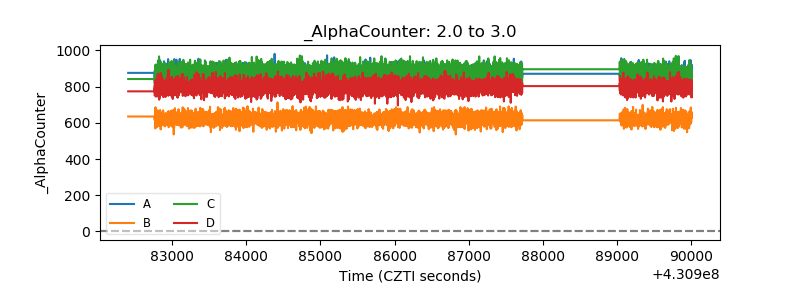 |
| _CPM_Rate | 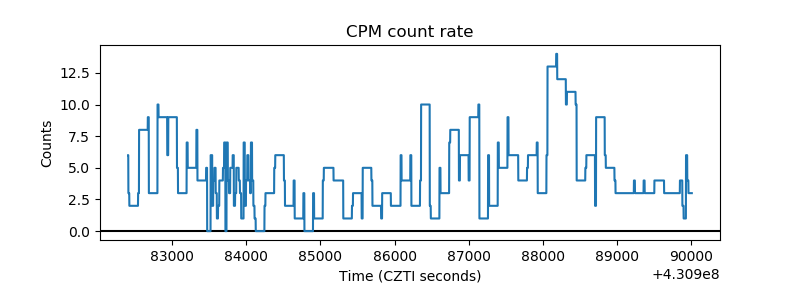 |
| CZT Counter | 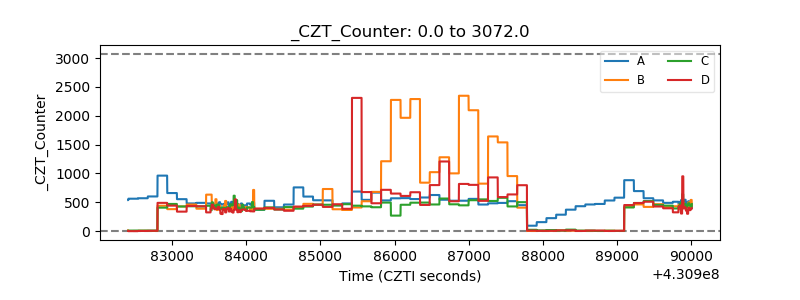 |
| +2.5 Volts monitor | 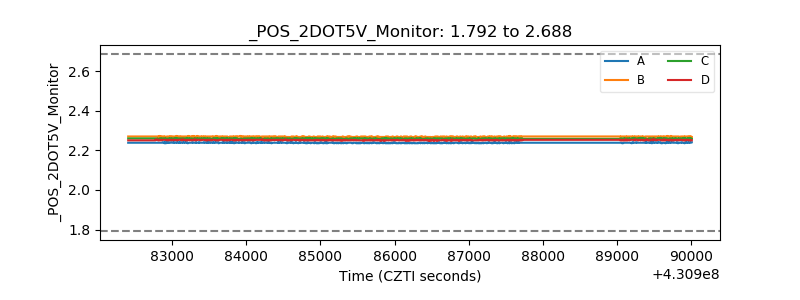 |
| +5 Volts monitor | 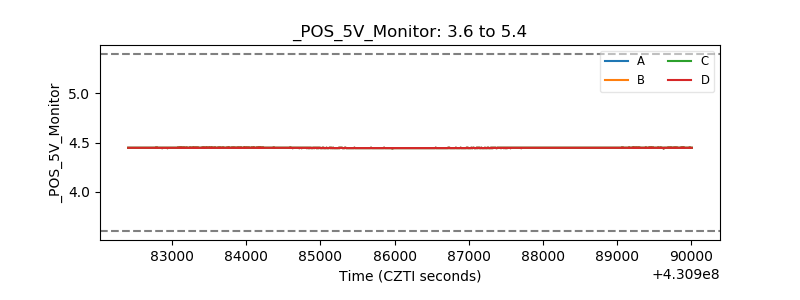 |
| _ROLL_ROT | 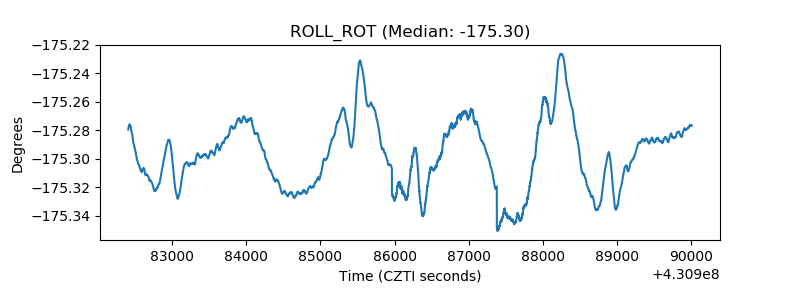 |
| _Roll_DEC | 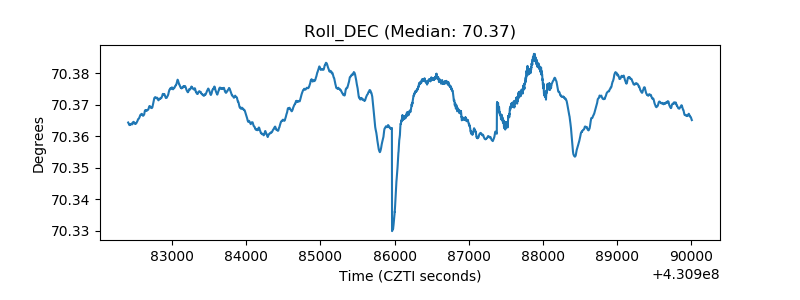 |
| _Roll_RA | 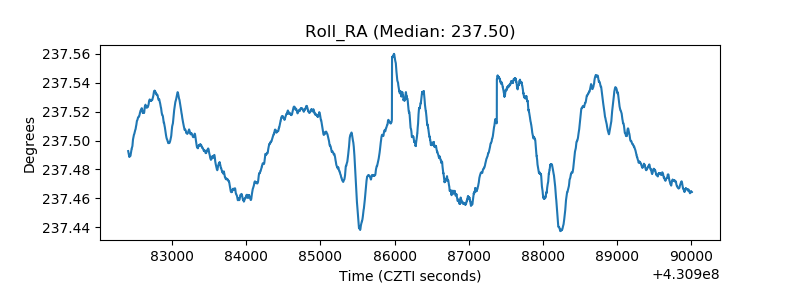 |
| Veto Counter | 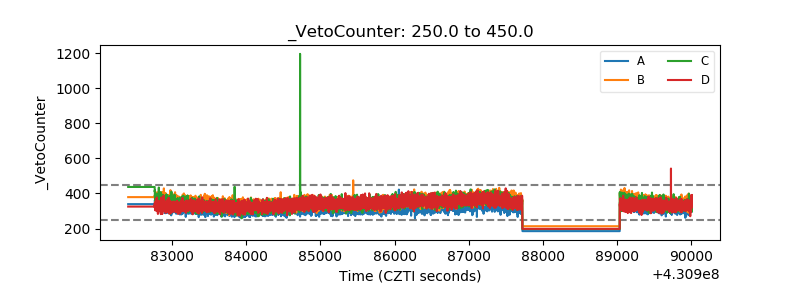 |