| Param | Original file | Final file |
|---|---|---|
| Filename | modeM0/AS1C07_001T12_9000005826_42816cztM0_level2.fits | modeM0/AS1C07_001T12_9000005826_42816cztM0_level2_quad_clean.evt |
| Size (bytes) | 995,578,560 | 247,792,320 |
| Size | 949.5 MB | 236.3 MB |
| Events in quadrant A | 8,594,421 | 1,684,105 |
| Events in quadrant B | 9,982,219 | 1,658,798 |
| Events in quadrant C | 7,902,091 | 1,596,342 |
| Events in quadrant D | 9,166,865 | 1,486,602 |
| Mode M0 | |||
|---|---|---|---|
| Quadrant | BADHDUFLAG | Total packets | Discarded packets |
| A | 0 | 34257 | 3 |
| B | 0 | 40187 | 3 |
| C | 0 | 33350 | 3 |
| D | 0 | 38270 | 3 |
| Mode SS | |||
|---|---|---|---|
| Quadrant | BADHDUFLAG | Total packets | Discarded packets |
| A | 0 | 318 | 0 |
| B | 0 | 318 | 0 |
| C | 0 | 318 | 0 |
| D | 0 | 318 | 0 |
| Mode M9 | |||
|---|---|---|---|
| Quadrant | BADHDUFLAG | Total packets | Discarded packets |
| A | 0 | 42 | 0 |
| B | 0 | 42 | 0 |
| C | 0 | 42 | 0 |
| D | 0 | 42 | 0 |
| Quadrant | Total seconds | Saturated seconds | Saturation percentage |
|---|---|---|---|
| A | 15594 | 41 | 0.262922% |
| B | 15594 | 624 | 4.001539% |
| C | 15594 | 88 | 0.564320% |
| D | 15594 | 338 | 2.167500% |
Noise dominated data is calculated using 1-second bins in cleaned event files. If a bin has >2000 counts, and if more than 50% of those come from <1% of pixels, then it is considered to be noise-dominated and hence unusable.
| Quadrant | # 1 sec bins | Bins with >0 counts | Bins with >2000 counts | High rate bins dominated by noise | Noise dominated (total time) | Noise dominated (detector-on time) | Marked lightcurve |
|---|---|---|---|---|---|---|---|
| A | 19804 | 15597 | 25 | 25 | 0.13% | 0.16% | 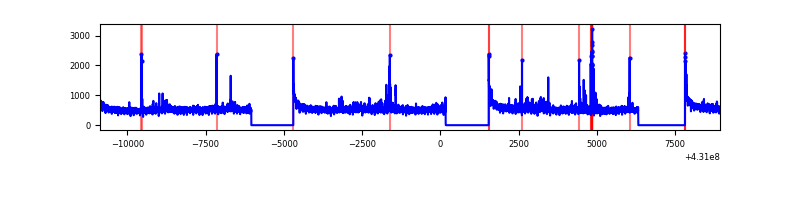 |
| B | 19804 | 15597 | 510 | 510 | 2.58% | 3.27% | 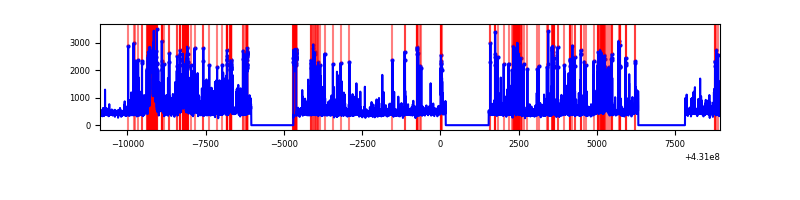 |
| C | 19804 | 15597 | 71 | 71 | 0.36% | 0.46% | 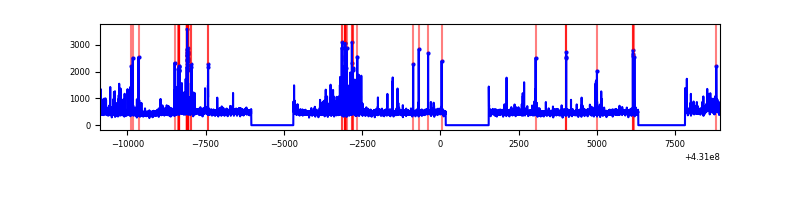 |
| D | 19804 | 15597 | 308 | 308 | 1.56% | 1.97% | 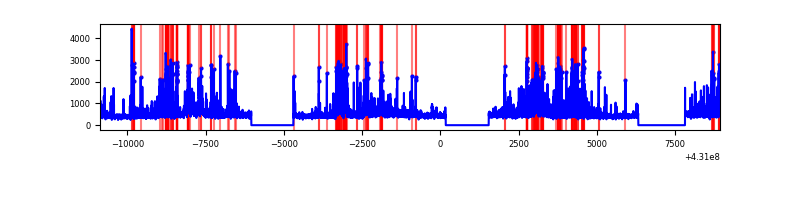 |
Top three noisy pixels from each quadrant. If the there are fewer than three noisy pixels in the level2.evt file, extra rows are filled as -1
| Pixel properties | Quadrant properties | ||||||
|---|---|---|---|---|---|---|---|
| Quadrant | DetID | PixID | Counts | Sigma | Mean | Median | Sigma |
| A | 10 | 83 | 1678283 | 4881.4 | 1692 | 1657 | 343.5 |
| A | 7 | 3 | 141936 | 408.41 | 1692 | 1657 | 343.5 |
| A | 12 | 189 | 95237 | 272.45 | 1692 | 1657 | 343.5 |
| B | 0 | 229 | 1791887 | 5684.78 | 1648 | 1602 | 314.9 |
| B | 5 | 255 | 788578 | 2498.92 | 1648 | 1602 | 314.9 |
| B | 4 | 171 | 387912 | 1226.67 | 1648 | 1602 | 314.9 |
| C | 15 | 214 | 640229 | 1685.87 | 1633 | 1642 | 378.8 |
| C | 4 | 254 | 330723 | 868.77 | 1633 | 1642 | 378.8 |
| C | 14 | 254 | 258312 | 677.61 | 1633 | 1642 | 378.8 |
| D | 12 | 233 | 806407 | 2023.91 | 1640 | 1594 | 397.7 |
| D | 1 | 52 | 746338 | 1872.85 | 1640 | 1594 | 397.7 |
| D | 10 | 118 | 424310 | 1063.03 | 1640 | 1594 | 397.7 |
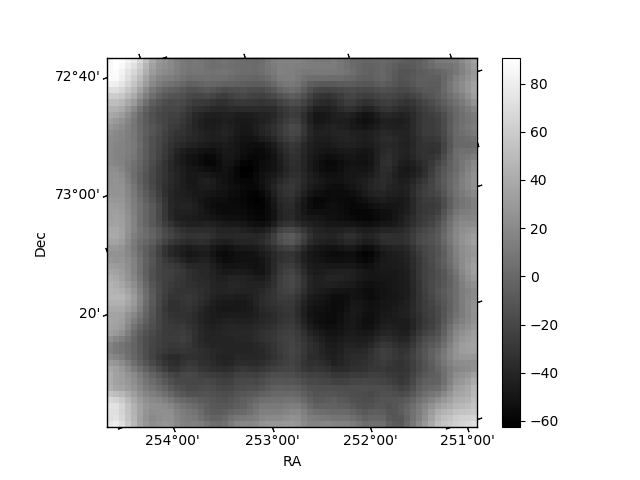
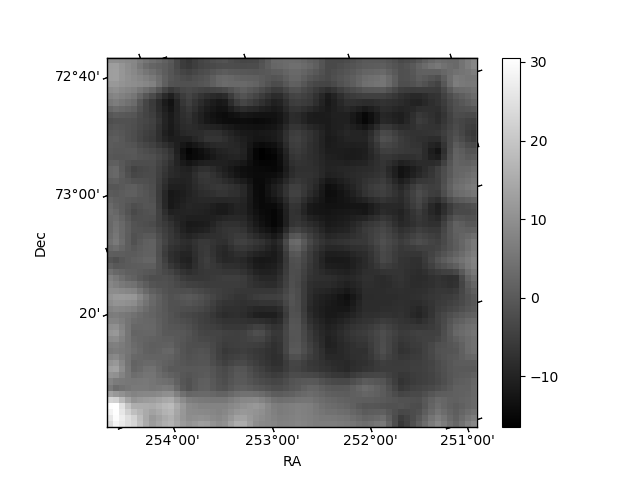
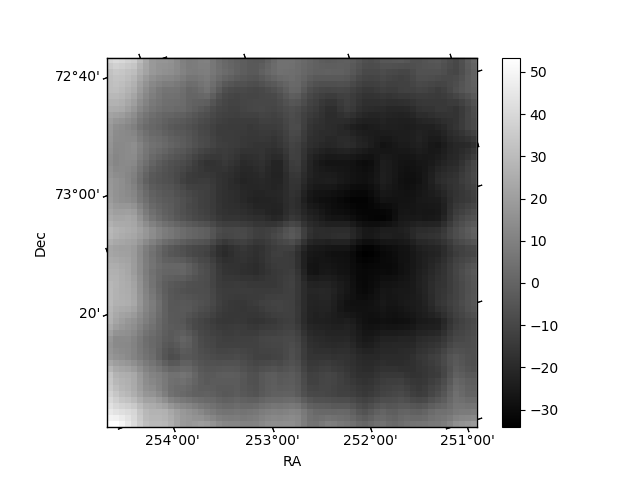
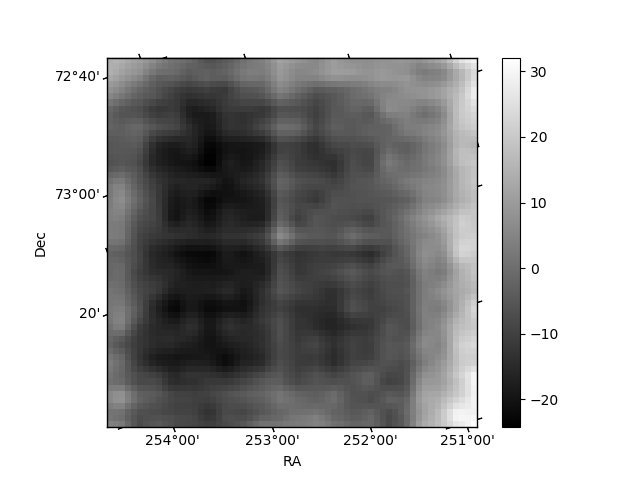
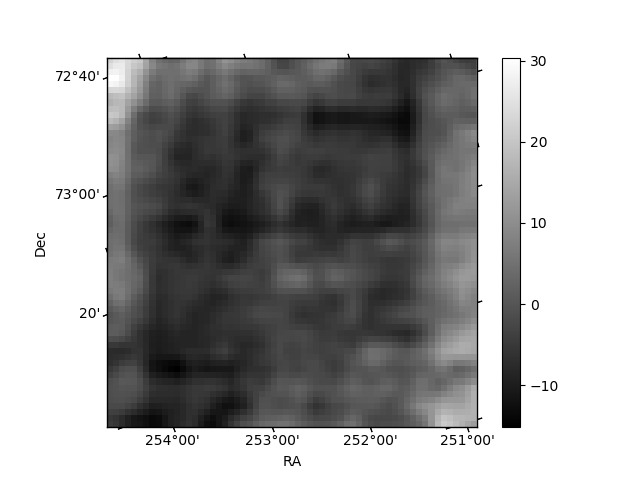
Histogram calculated using DETX and DETY for each event in the final _common_clean file
| Quadrant A | 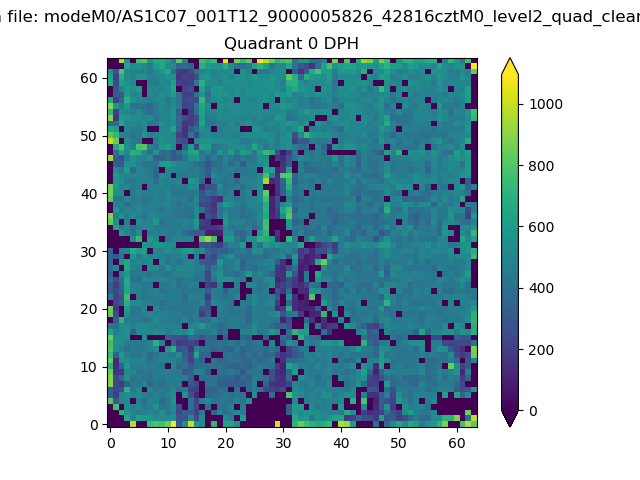 |
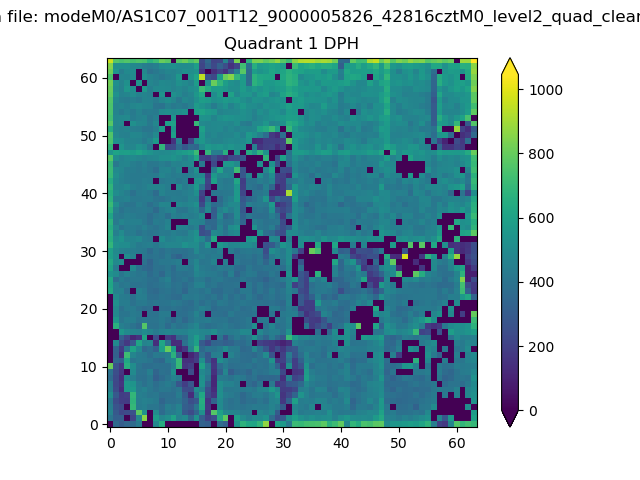 |
Quadrant B |
|---|---|---|---|
| Quadrant D | 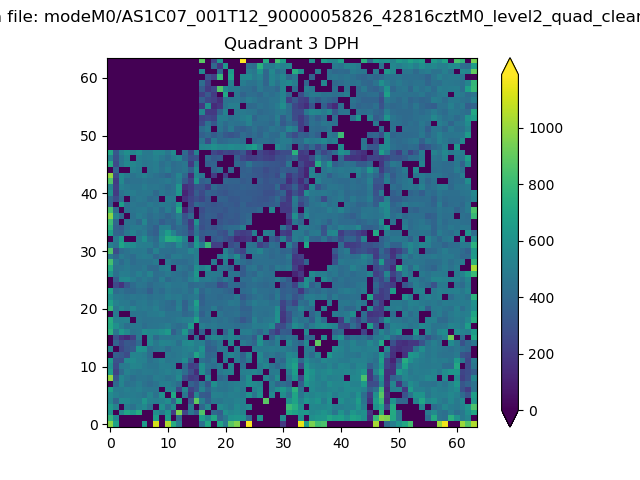 |
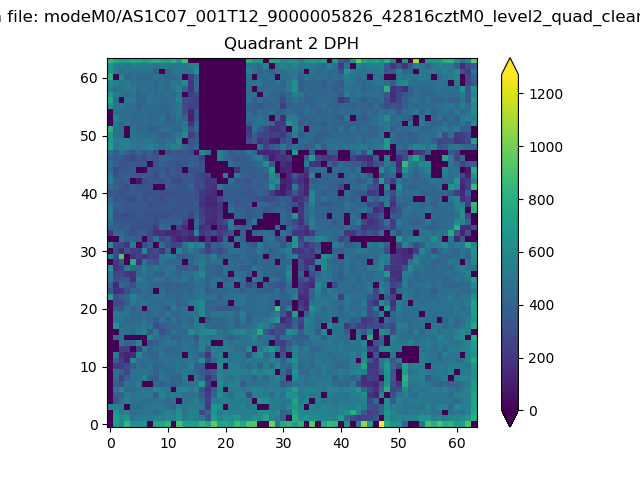 |
Quadrant C |
| Plot type | Count rate plots | Images |
|---|---|---|
| Comparison with Poisson distribution Blue bars denote a histogram of data divided into 1 sec bins. Red curve is a Poisson curve with rate = median count rate of data. |
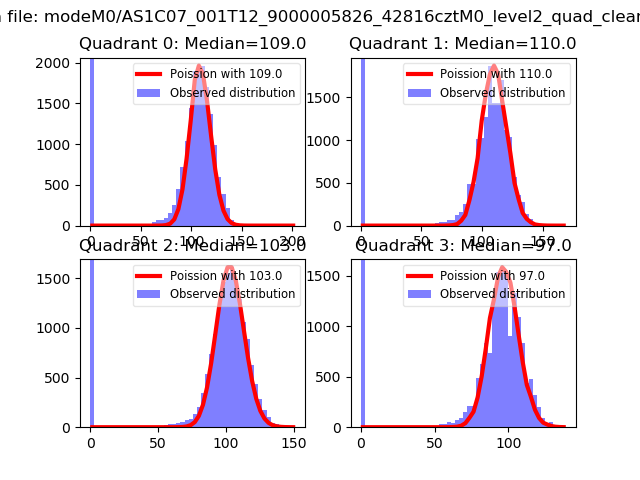 |
 |
| Quadrant-wise count rates Data is divided into 100 sec bins |
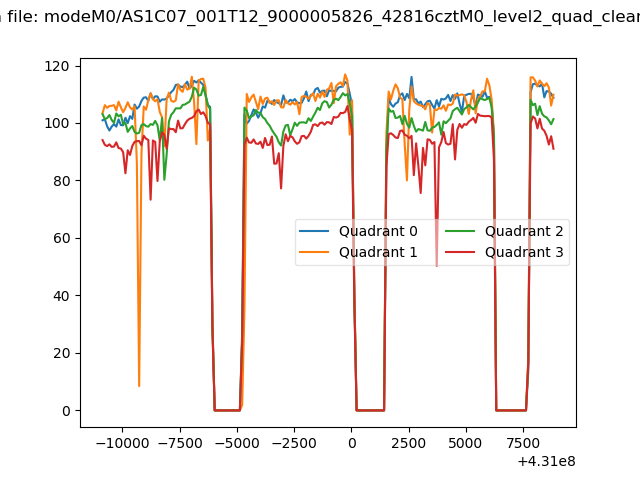 |
|
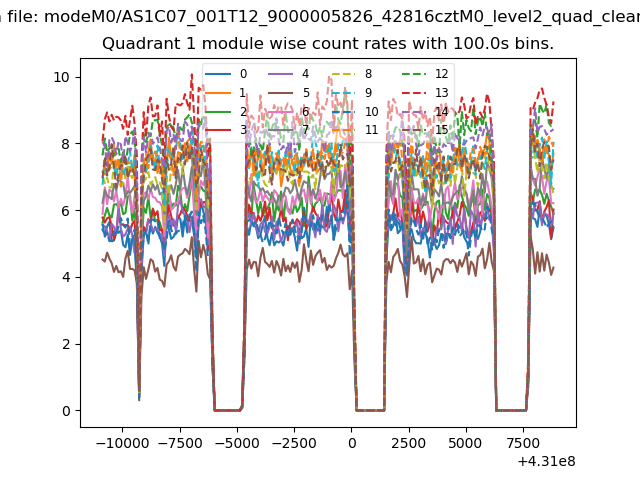
| Module-wise count rates for Quadrant A Data is divided into 100 sec bins |
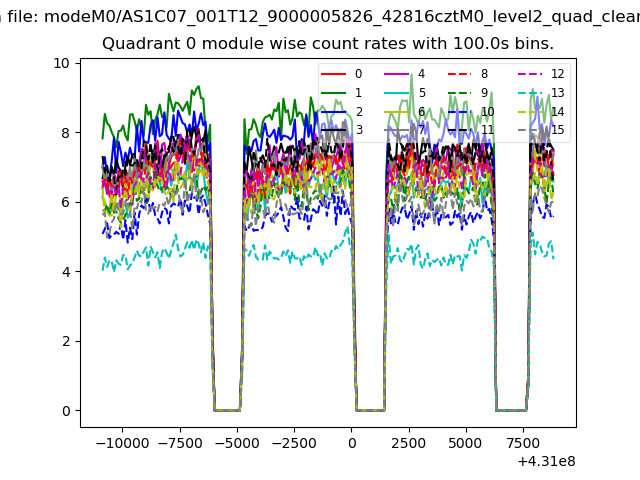 |
 |
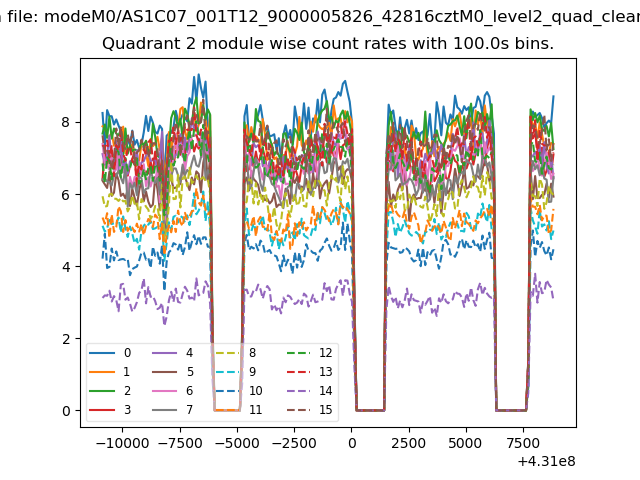
| Module-wise count rates for Quadrant B Data is divided into 100 sec bins |
 |
 |
| Module-wise count rates for Quadrant C Data is divided into 100 sec bins |
 |
 |
| Module-wise count rates for Quadrant D Data is divided into 100 sec bins |
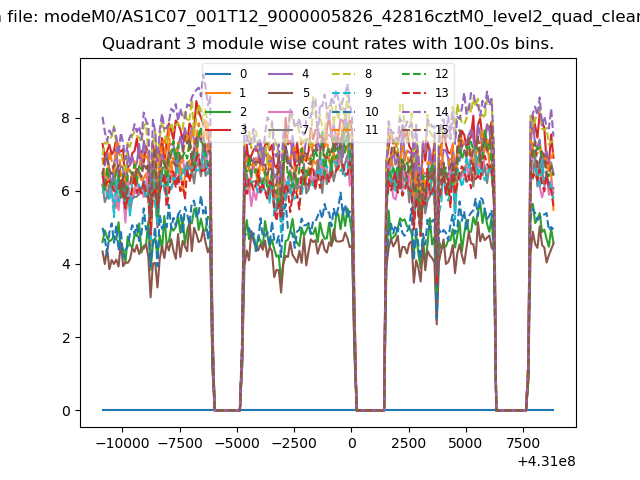 |
 |
| Parameter | Plot |
|---|---|
| CZT HV Monitor | 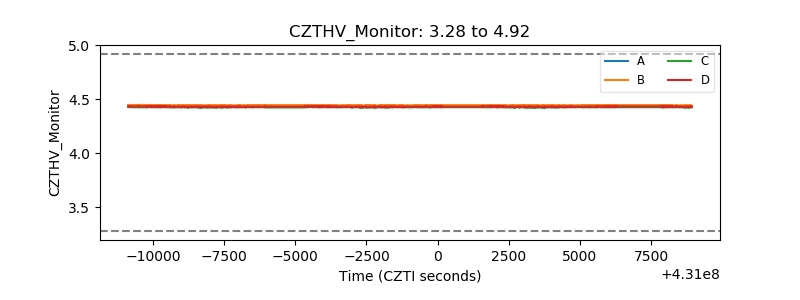 |
| D_VDD | 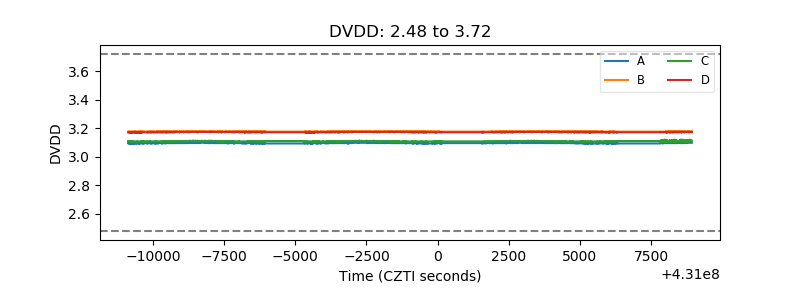 |
| Temperature 1 | 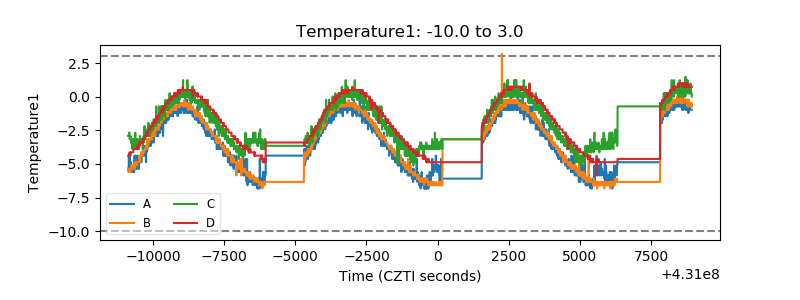 |
| Veto HV Monitor |  |
| Veto LLD | 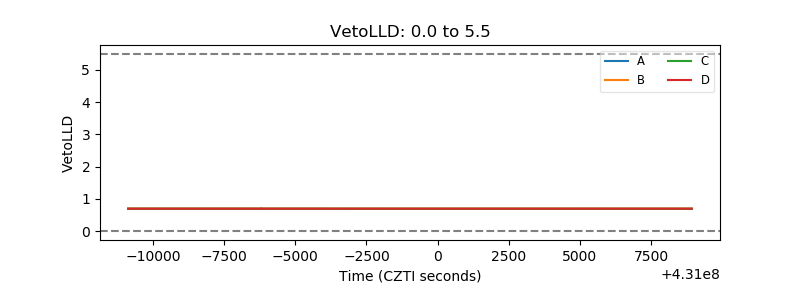 |
| Alpha Counter | 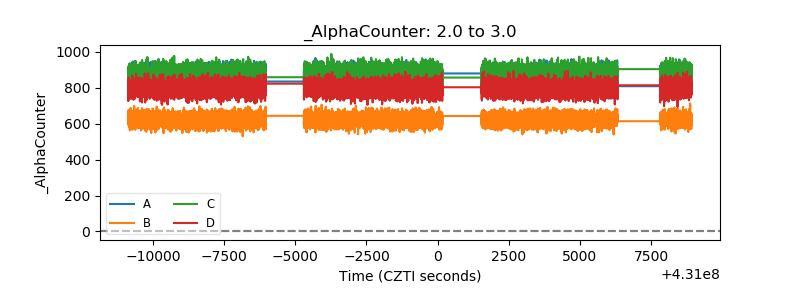 |
| _CPM_Rate | 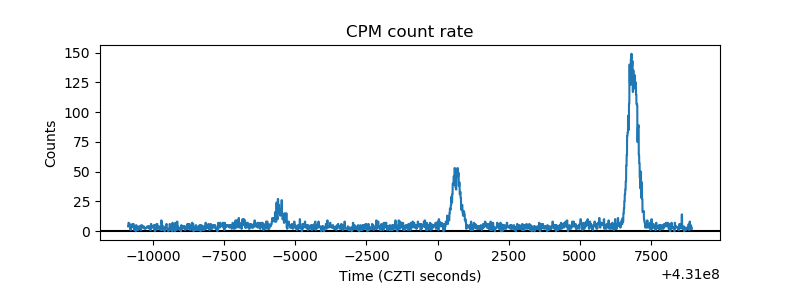 |
| CZT Counter | 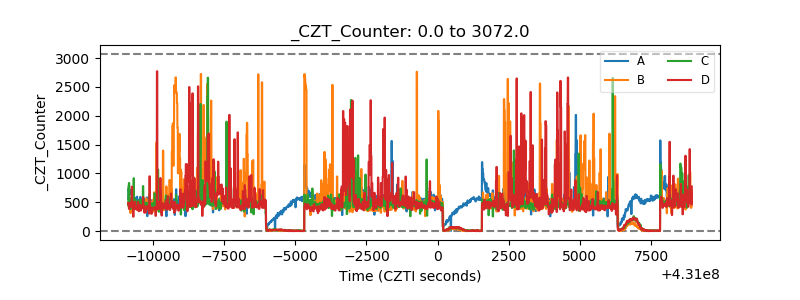 |
| +2.5 Volts monitor | 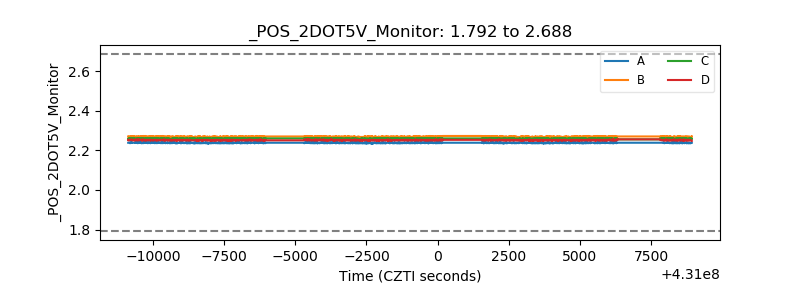 |
| +5 Volts monitor | 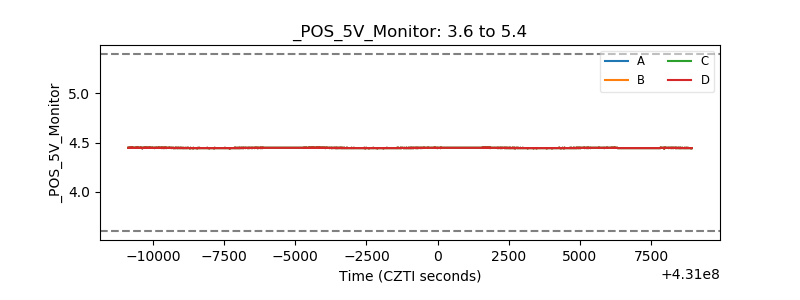 |
| _ROLL_ROT | 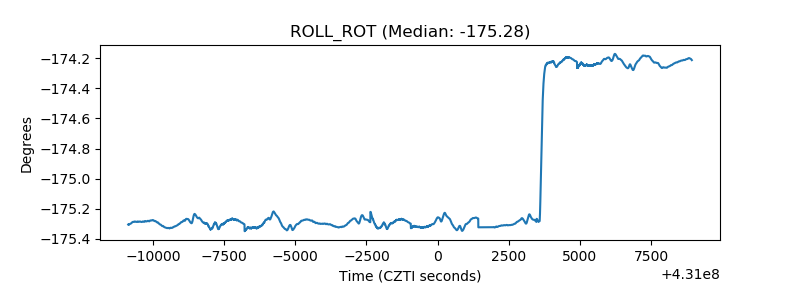 |
| _Roll_DEC | 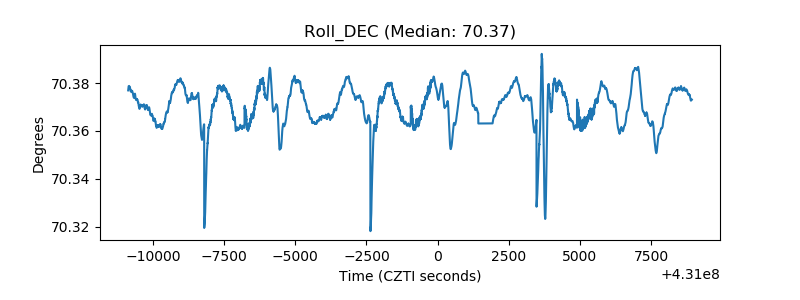 |
| _Roll_RA | 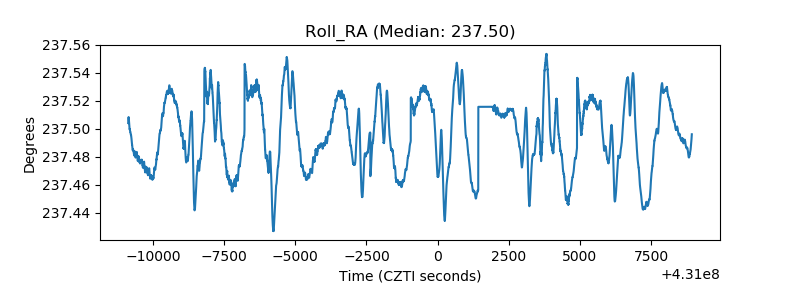 |
| Veto Counter | 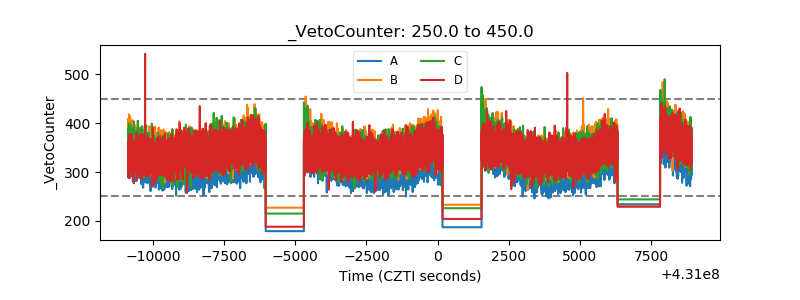 |