| Param | Original file | Final file |
|---|---|---|
| Filename | modeM0/AS1C07_001T12_9000005826_42817cztM0_level2.fits | modeM0/AS1C07_001T12_9000005826_42817cztM0_level2_quad_clean.evt |
| Size (bytes) | 392,071,680 | 90,912,960 |
| Size | 373.9 MB | 86.7 MB |
| Events in quadrant A | 3,189,863 | 625,092 |
| Events in quadrant B | 4,038,279 | 593,197 |
| Events in quadrant C | 3,567,450 | 587,597 |
| Events in quadrant D | 3,280,877 | 553,808 |
| Mode M0 | |||
|---|---|---|---|
| Quadrant | BADHDUFLAG | Total packets | Discarded packets |
| A | 0 | 12931 | 2 |
| B | 0 | 15822 | 2 |
| C | 0 | 14155 | 2 |
| D | 0 | 13661 | 2 |
| Mode SS | |||
|---|---|---|---|
| Quadrant | BADHDUFLAG | Total packets | Discarded packets |
| A | 0 | 114 | 0 |
| B | 0 | 114 | 0 |
| C | 0 | 114 | 0 |
| D | 0 | 114 | 0 |
| Mode M9 | |||
|---|---|---|---|
| Quadrant | BADHDUFLAG | Total packets | Discarded packets |
| A | 0 | 16 | 0 |
| B | 0 | 17 | 0 |
| C | 0 | 17 | 0 |
| D | 0 | 17 | 0 |
| Quadrant | Total seconds | Saturated seconds | Saturation percentage |
|---|---|---|---|
| A | 5616 | 22 | 0.391738% |
| B | 5616 | 418 | 7.443020% |
| C | 5616 | 23 | 0.409544% |
| D | 5616 | 131 | 2.332621% |
Noise dominated data is calculated using 1-second bins in cleaned event files. If a bin has >2000 counts, and if more than 50% of those come from <1% of pixels, then it is considered to be noise-dominated and hence unusable.
| Quadrant | # 1 sec bins | Bins with >0 counts | Bins with >2000 counts | High rate bins dominated by noise | Noise dominated (total time) | Noise dominated (detector-on time) | Marked lightcurve |
|---|---|---|---|---|---|---|---|
| A | 7258 | 5617 | 7 | 7 | 0.10% | 0.12% | 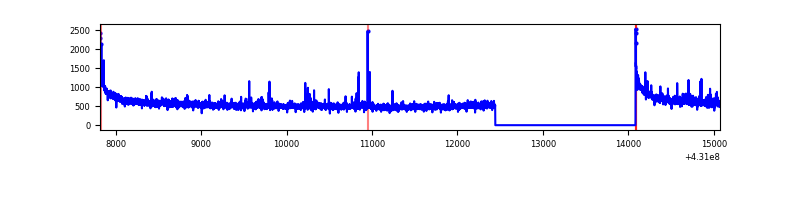 |
| B | 7258 | 5616 | 331 | 331 | 4.56% | 5.89% | 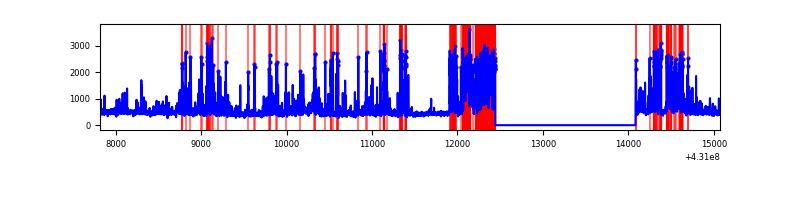 |
| C | 7258 | 5617 | 15 | 15 | 0.21% | 0.27% | 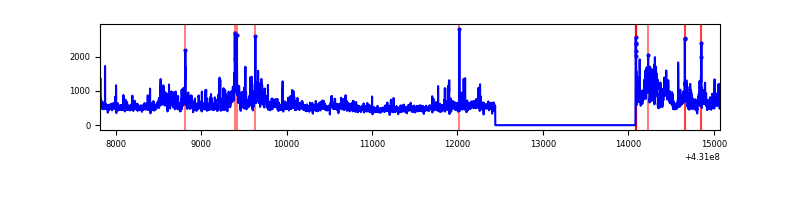 |
| D | 7258 | 5617 | 129 | 129 | 1.78% | 2.30% | 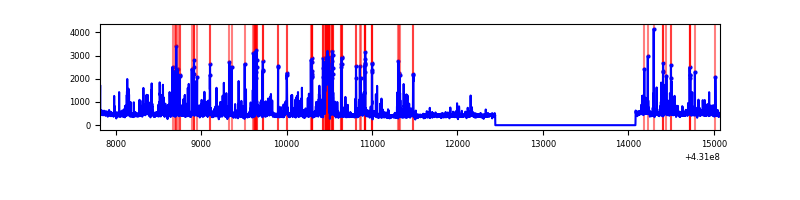 |
Top three noisy pixels from each quadrant. If the there are fewer than three noisy pixels in the level2.evt file, extra rows are filled as -1
| Pixel properties | Quadrant properties | ||||||
|---|---|---|---|---|---|---|---|
| Quadrant | DetID | PixID | Counts | Sigma | Mean | Median | Sigma |
| A | 10 | 83 | 699053 | 5546.73 | 611 | 598 | 125.9 |
| A | 12 | 189 | 77021 | 606.91 | 611 | 598 | 125.9 |
| A | 13 | 6 | 18871 | 145.11 | 611 | 598 | 125.9 |
| B | 5 | 255 | 1126158 | 10020.58 | 587 | 571 | 112.3 |
| B | 0 | 229 | 255811 | 2272.28 | 587 | 571 | 112.3 |
| B | 5 | 172 | 145744 | 1292.41 | 587 | 571 | 112.3 |
| C | 3 | 233 | 859649 | 6227.63 | 591 | 594 | 137.9 |
| C | 15 | 214 | 237361 | 1716.42 | 591 | 594 | 137.9 |
| C | 14 | 254 | 72694 | 522.68 | 591 | 594 | 137.9 |
| D | 1 | 47 | 345053 | 2370.12 | 595 | 578 | 145.3 |
| D | 12 | 233 | 209495 | 1437.43 | 595 | 578 | 145.3 |
| D | 10 | 118 | 111476 | 763.02 | 595 | 578 | 145.3 |
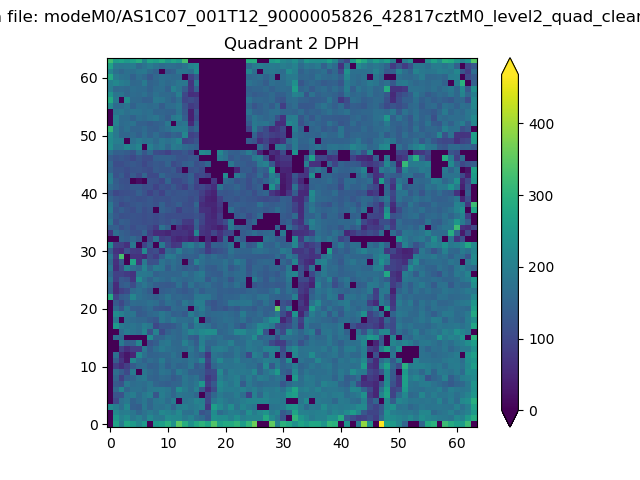
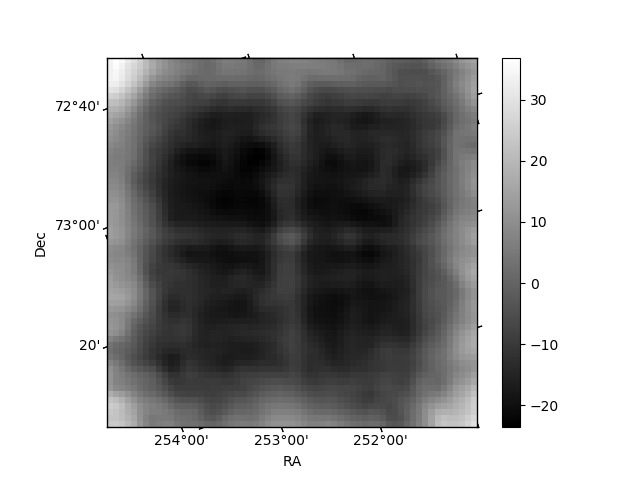
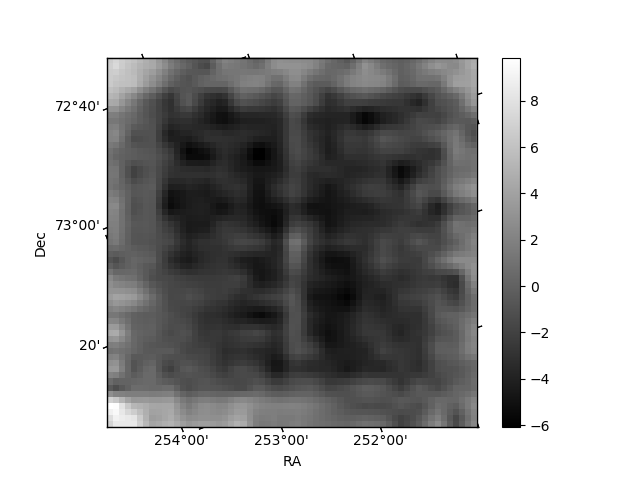
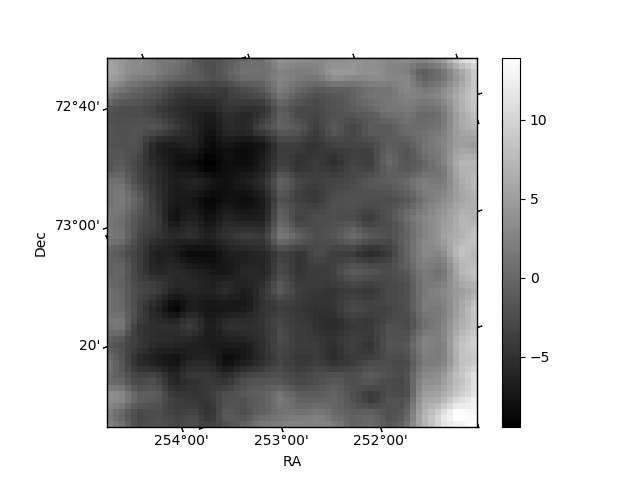
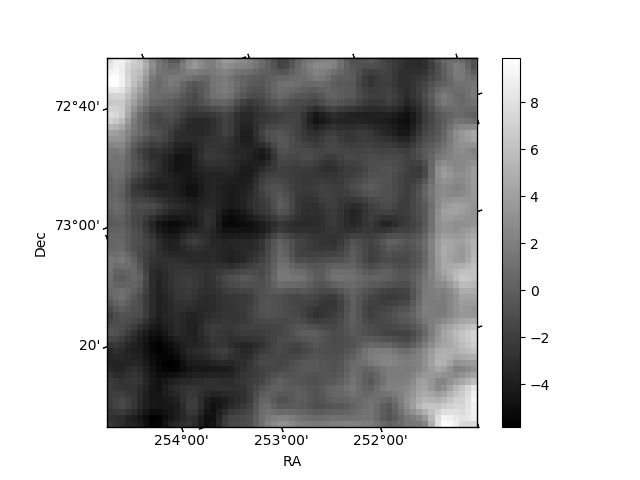
Histogram calculated using DETX and DETY for each event in the final _common_clean file
| Quadrant A | 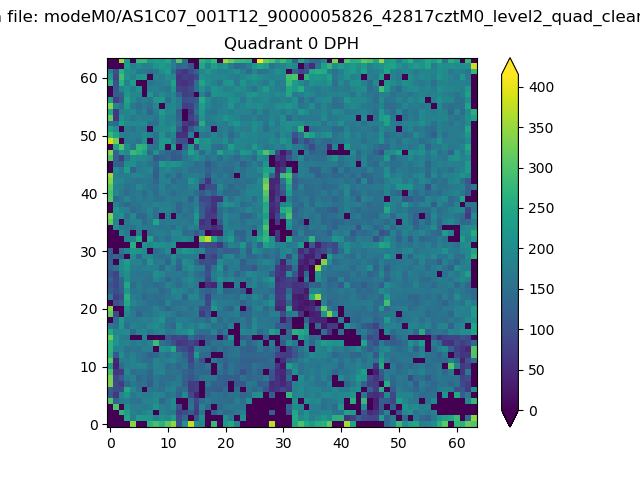 |
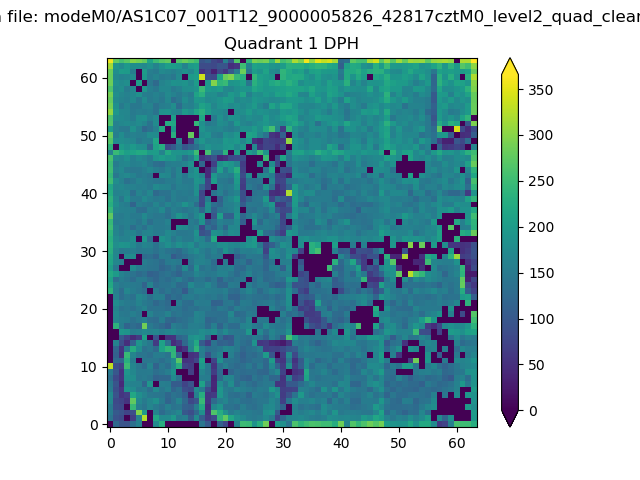 |
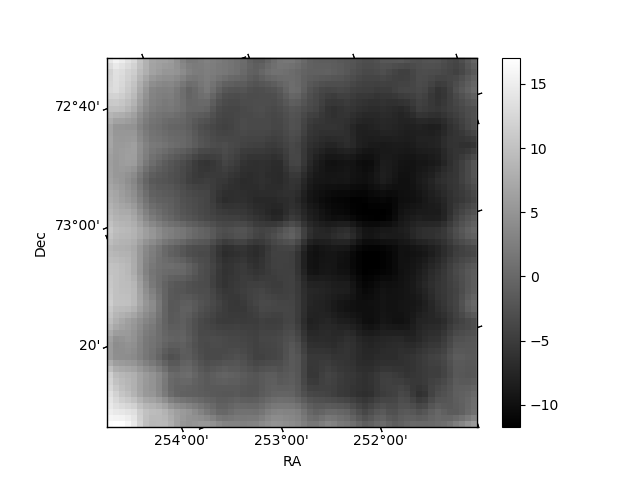
Quadrant B |
|---|---|---|---|
| Quadrant D | 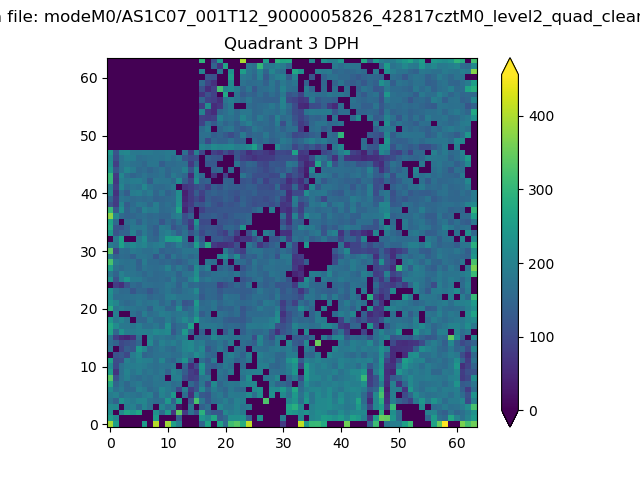 |
 |
Quadrant C |
| Plot type | Count rate plots | Images |
|---|---|---|
| Comparison with Poisson distribution Blue bars denote a histogram of data divided into 1 sec bins. Red curve is a Poisson curve with rate = median count rate of data. |
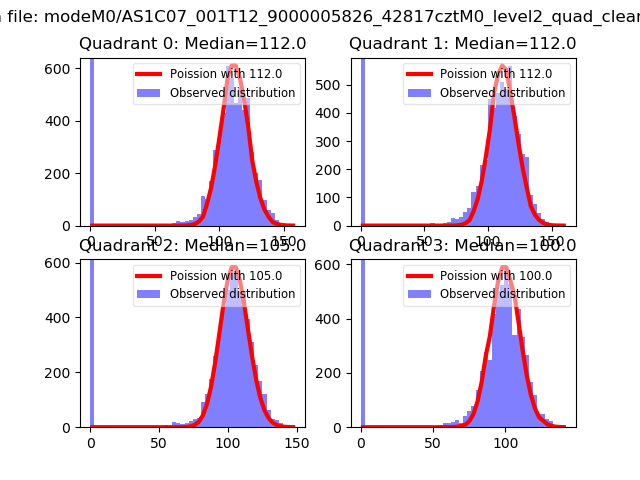 |
 |
| Quadrant-wise count rates Data is divided into 100 sec bins |
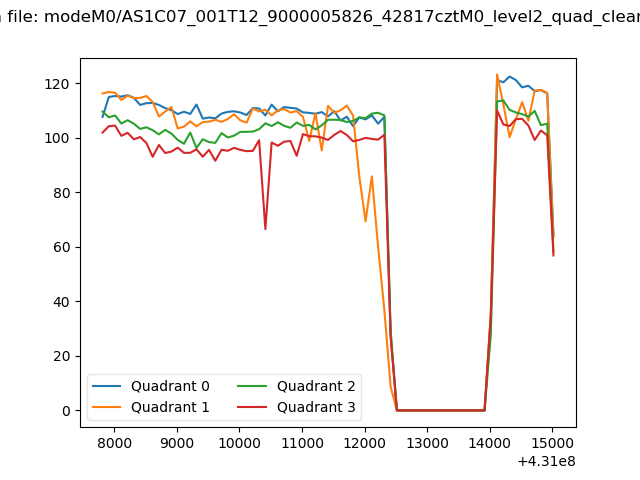 |
|
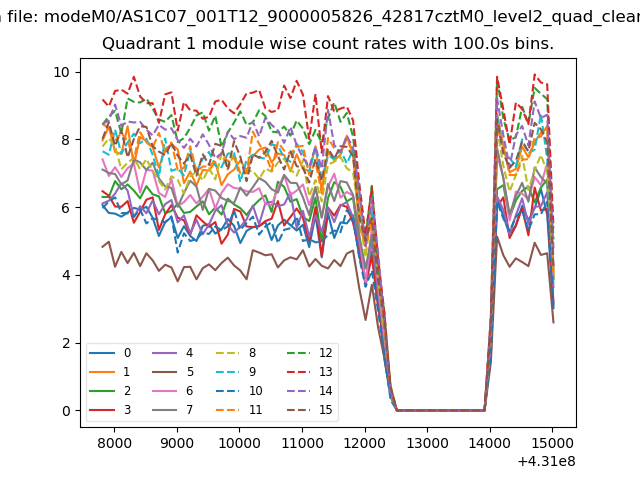
| Module-wise count rates for Quadrant A Data is divided into 100 sec bins |
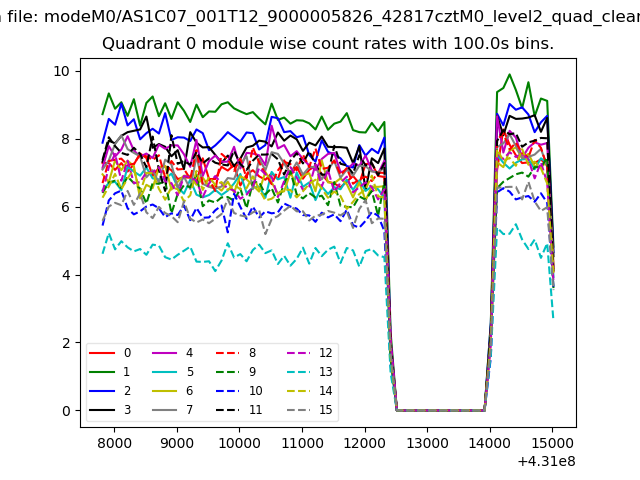 |
 |
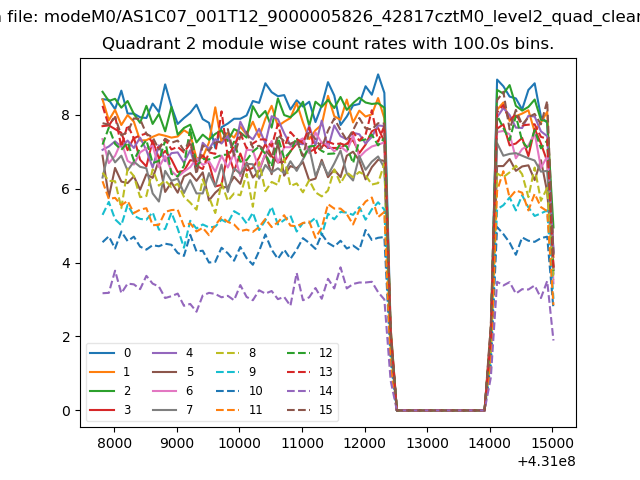
| Module-wise count rates for Quadrant B Data is divided into 100 sec bins |
 |
 |
| Module-wise count rates for Quadrant C Data is divided into 100 sec bins |
 |
 |
| Module-wise count rates for Quadrant D Data is divided into 100 sec bins |
 |
 |
| Parameter | Plot |
|---|---|
| CZT HV Monitor | 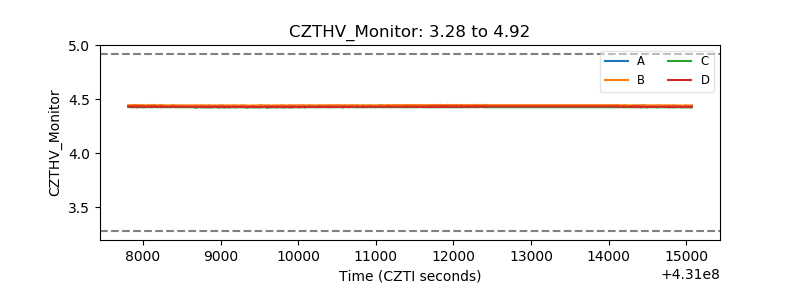 |
| D_VDD | 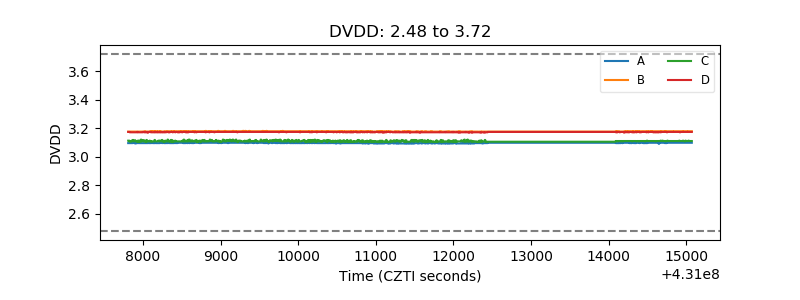 |
| Temperature 1 | 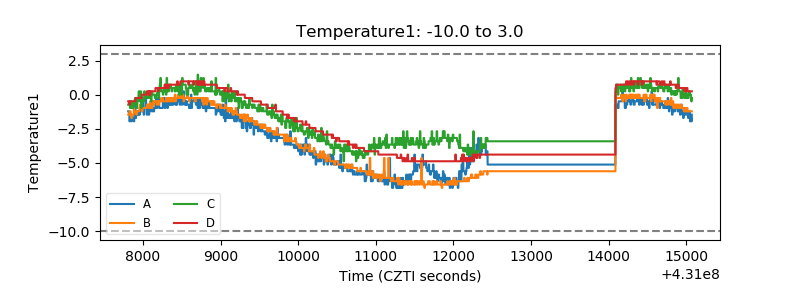 |
| Veto HV Monitor | 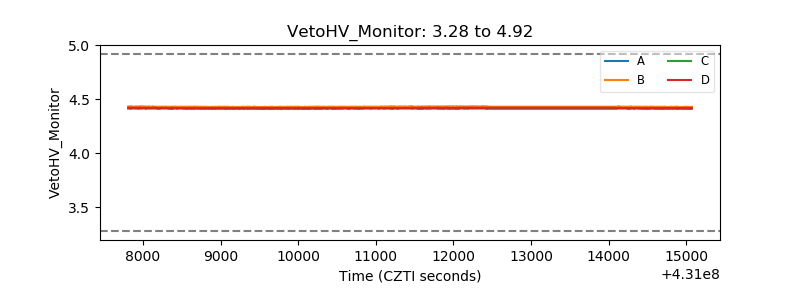 |
| Veto LLD | 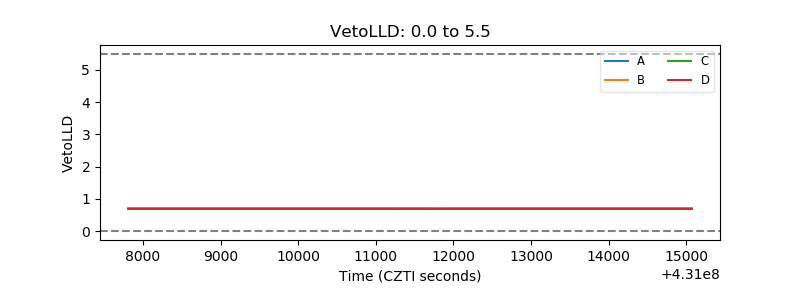 |
| Alpha Counter | 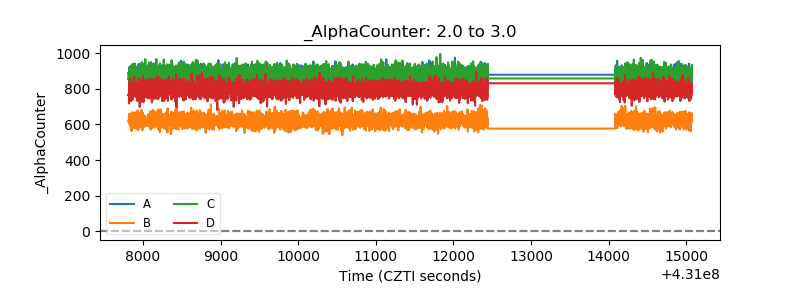 |
| _CPM_Rate | 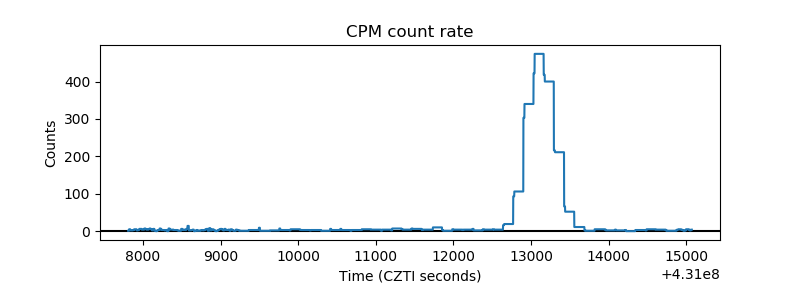 |
| CZT Counter | 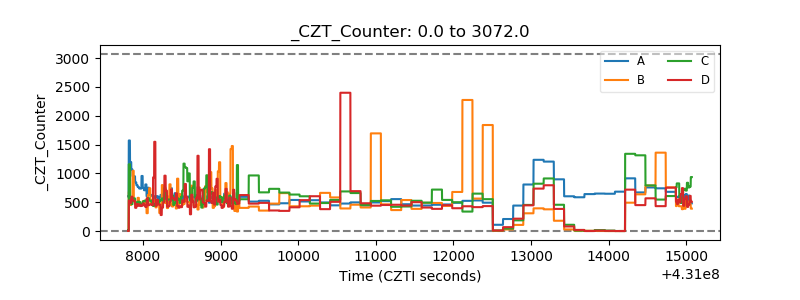 |
| +2.5 Volts monitor | 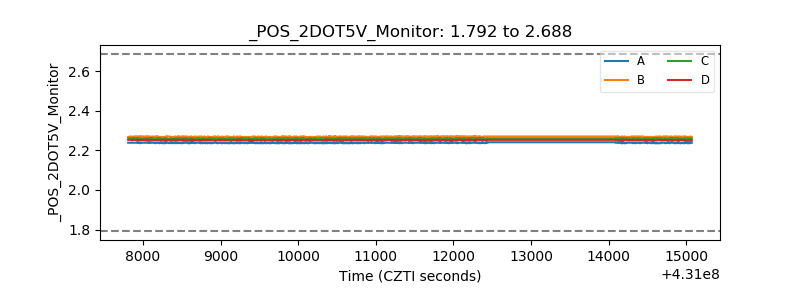 |
| +5 Volts monitor | 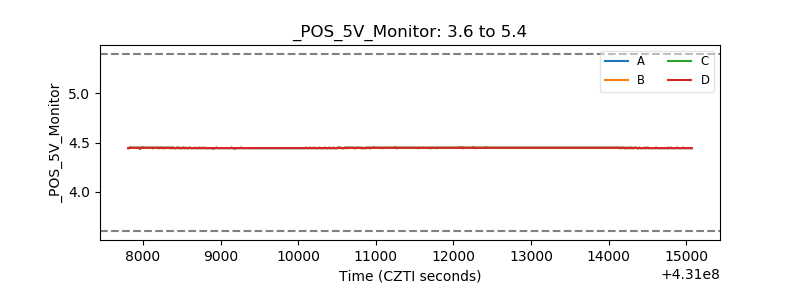 |
| _ROLL_ROT | 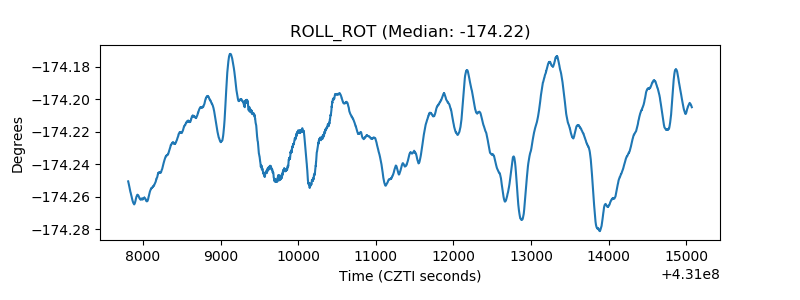 |
| _Roll_DEC | 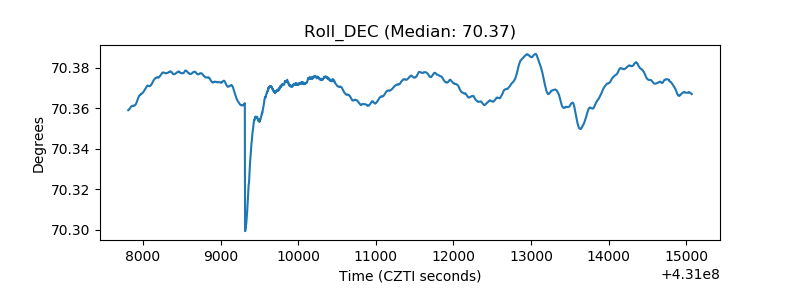 |
| _Roll_RA | 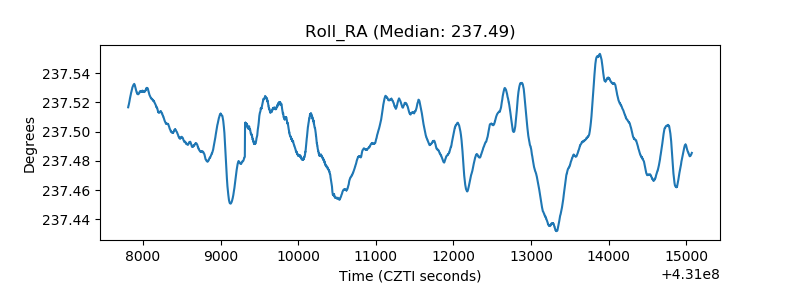 |
| Veto Counter |  |