| Param | Original file | Final file |
|---|---|---|
| Filename | modeM0/AS1C07_001T12_9000005826_42819cztM0_level2.fits | modeM0/AS1C07_001T12_9000005826_42819cztM0_level2_quad_clean.evt |
| Size (bytes) | 386,236,800 | 90,264,960 |
| Size | 368.3 MB | 86.1 MB |
| Events in quadrant A | 3,110,193 | 623,038 |
| Events in quadrant B | 3,628,361 | 597,583 |
| Events in quadrant C | 4,152,536 | 574,214 |
| Events in quadrant D | 2,982,288 | 556,480 |
| Mode M0 | |||
|---|---|---|---|
| Quadrant | BADHDUFLAG | Total packets | Discarded packets |
| A | 0 | 12658 | 2 |
| B | 0 | 14530 | 2 |
| C | 0 | 15859 | 3 |
| D | 0 | 12760 | 2 |
| Mode SS | |||
|---|---|---|---|
| Quadrant | BADHDUFLAG | Total packets | Discarded packets |
| A | 0 | 112 | 0 |
| B | 0 | 112 | 0 |
| C | 0 | 112 | 0 |
| D | 0 | 112 | 0 |
| Mode M9 | |||
|---|---|---|---|
| Quadrant | BADHDUFLAG | Total packets | Discarded packets |
| A | 0 | 21 | 0 |
| B | 0 | 22 | 0 |
| C | 0 | 22 | 0 |
| D | 0 | 22 | 0 |
| Quadrant | Total seconds | Saturated seconds | Saturation percentage |
|---|---|---|---|
| A | 5450 | 21 | 0.385321% |
| B | 5450 | 307 | 5.633028% |
| C | 5449 | 209 | 3.835566% |
| D | 5449 | 85 | 1.559919% |
Noise dominated data is calculated using 1-second bins in cleaned event files. If a bin has >2000 counts, and if more than 50% of those come from <1% of pixels, then it is considered to be noise-dominated and hence unusable.
| Quadrant | # 1 sec bins | Bins with >0 counts | Bins with >2000 counts | High rate bins dominated by noise | Noise dominated (total time) | Noise dominated (detector-on time) | Marked lightcurve |
|---|---|---|---|---|---|---|---|
| A | 7243 | 5451 | 6 | 6 | 0.08% | 0.11% | 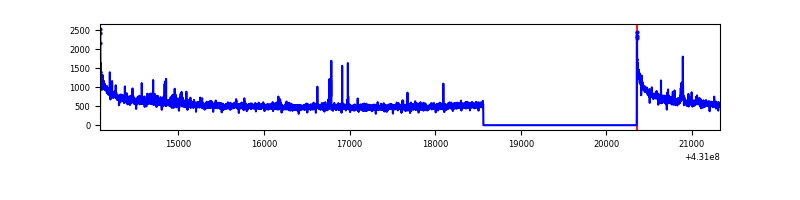 |
| B | 7243 | 5451 | 277 | 277 | 3.82% | 5.08% | 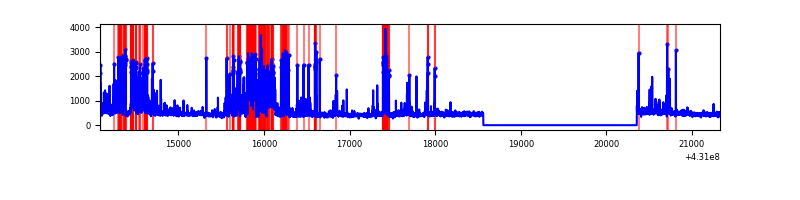 |
| C | 7242 | 5450 | 230 | 230 | 3.18% | 4.22% | 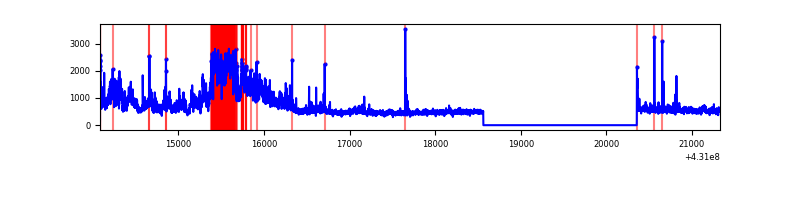 |
| D | 7242 | 5450 | 79 | 79 | 1.09% | 1.45% | 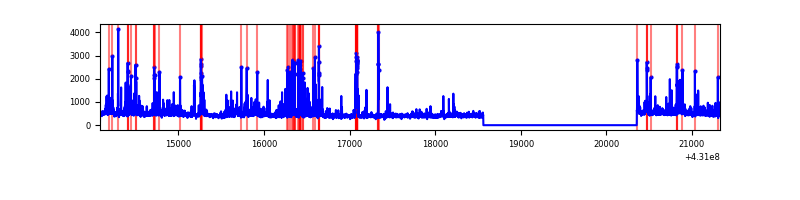 |
Top three noisy pixels from each quadrant. If the there are fewer than three noisy pixels in the level2.evt file, extra rows are filled as -1
| Pixel properties | Quadrant properties | ||||||
|---|---|---|---|---|---|---|---|
| Quadrant | DetID | PixID | Counts | Sigma | Mean | Median | Sigma |
| A | 10 | 83 | 693863 | 5718.18 | 593 | 583 | 121.2 |
| A | 12 | 189 | 66093 | 540.33 | 593 | 583 | 121.2 |
| A | 13 | 6 | 19918 | 159.48 | 593 | 583 | 121.2 |
| B | 5 | 255 | 968693 | 8775.08 | 577 | 561 | 110.3 |
| B | 5 | 172 | 179124 | 1618.48 | 577 | 561 | 110.3 |
| B | 0 | 245 | 79164 | 712.45 | 577 | 561 | 110.3 |
| C | 3 | 233 | 1534135 | 11529.47 | 572 | 575 | 133.0 |
| C | 15 | 214 | 224041 | 1680.04 | 572 | 575 | 133.0 |
| C | 14 | 254 | 62652 | 466.7 | 572 | 575 | 133.0 |
| D | 1 | 47 | 311532 | 2220.45 | 581 | 566 | 140.0 |
| D | 10 | 118 | 73063 | 517.66 | 581 | 566 | 140.0 |
| D | 2 | 120 | 72865 | 516.25 | 581 | 566 | 140.0 |
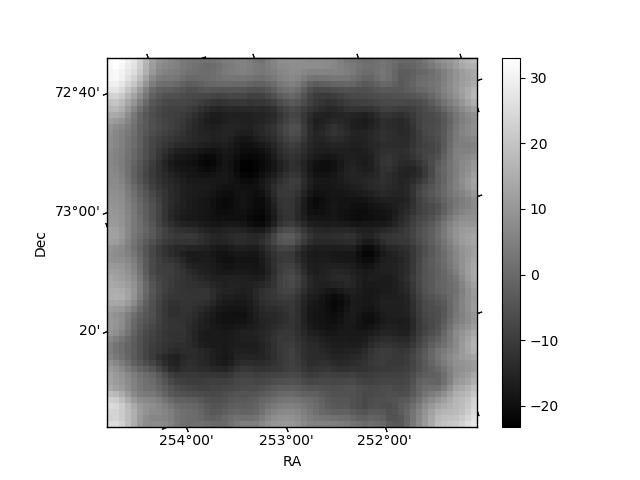
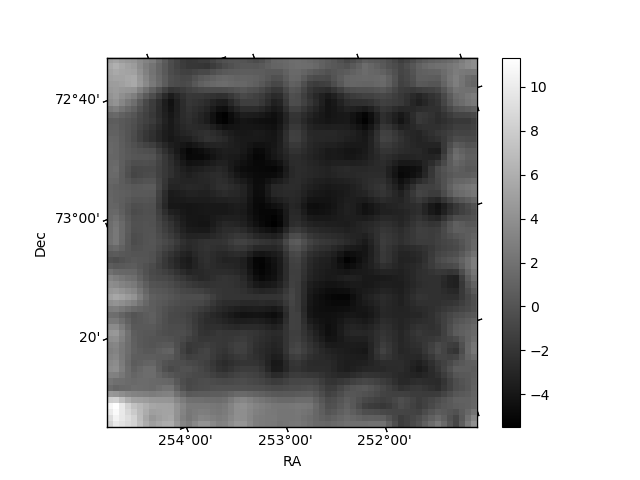
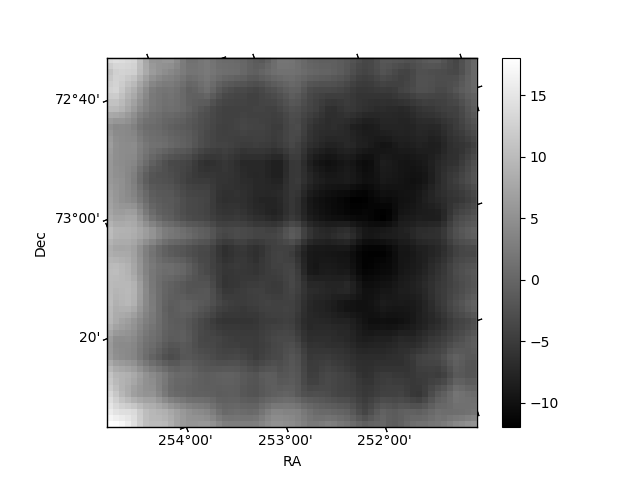
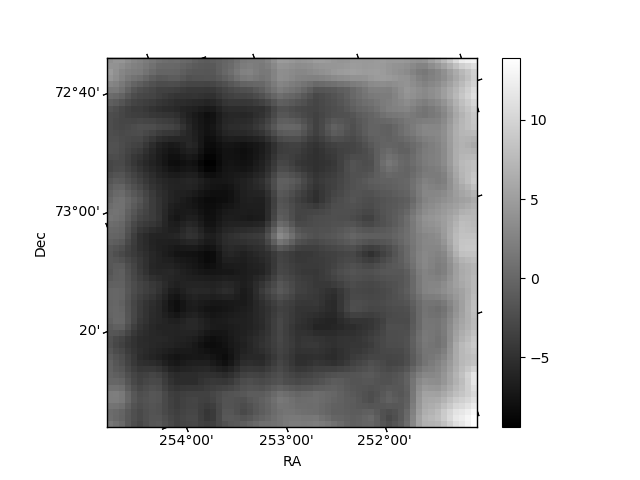
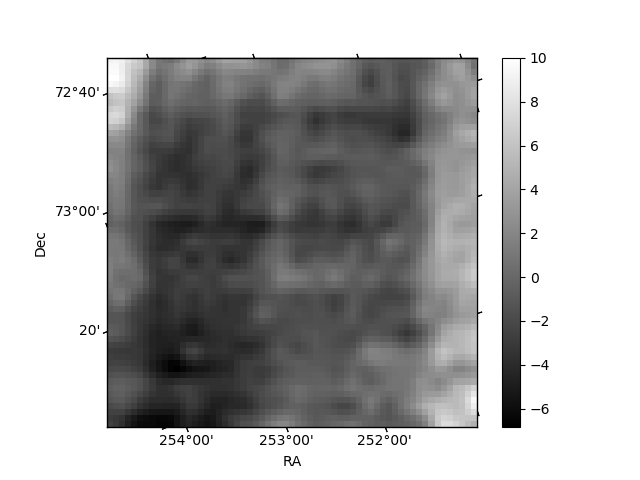
Histogram calculated using DETX and DETY for each event in the final _common_clean file
| Quadrant A | 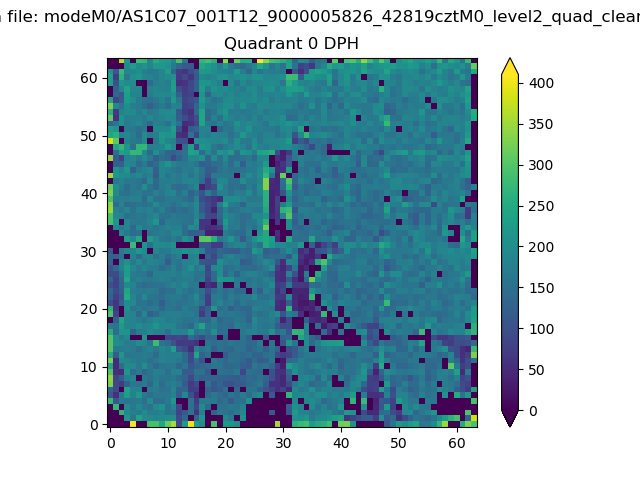 |
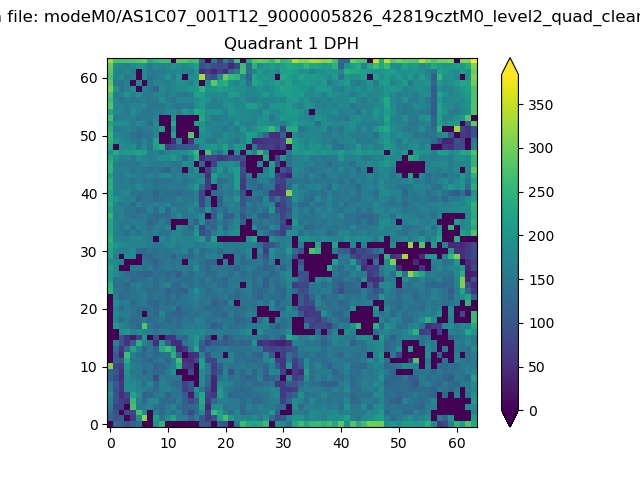 |
Quadrant B |
|---|---|---|---|
| Quadrant D | 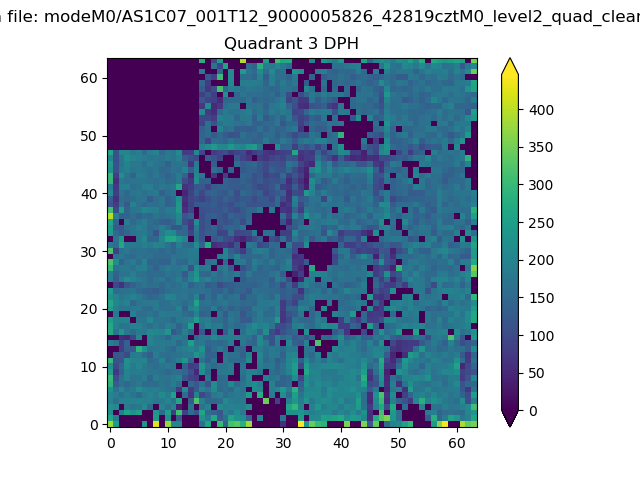 |
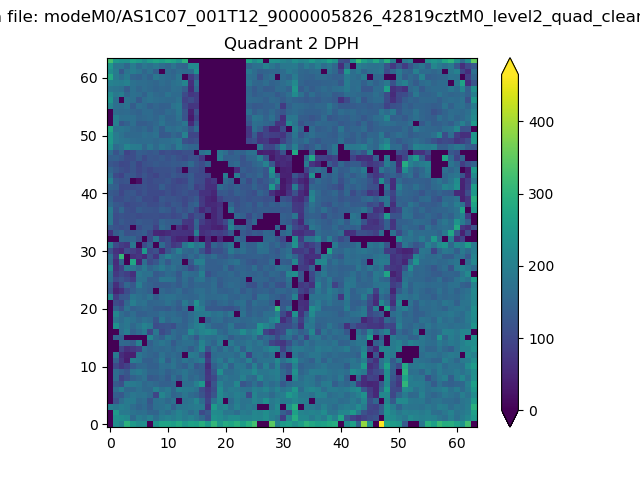 |
Quadrant C |
| Plot type | Count rate plots | Images |
|---|---|---|
| Comparison with Poisson distribution Blue bars denote a histogram of data divided into 1 sec bins. Red curve is a Poisson curve with rate = median count rate of data. |
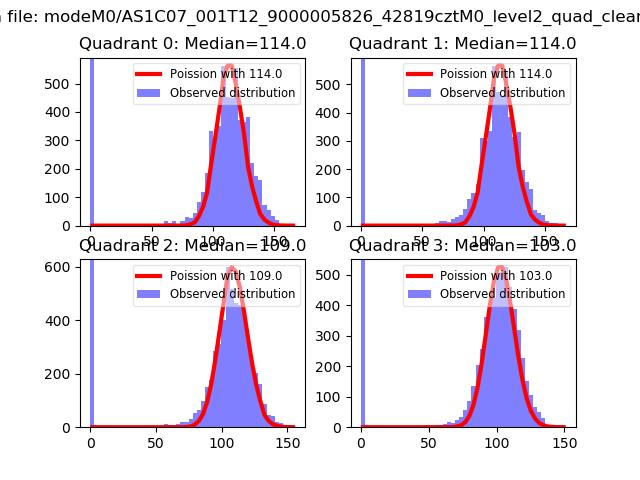 |
 |
| Quadrant-wise count rates Data is divided into 100 sec bins |
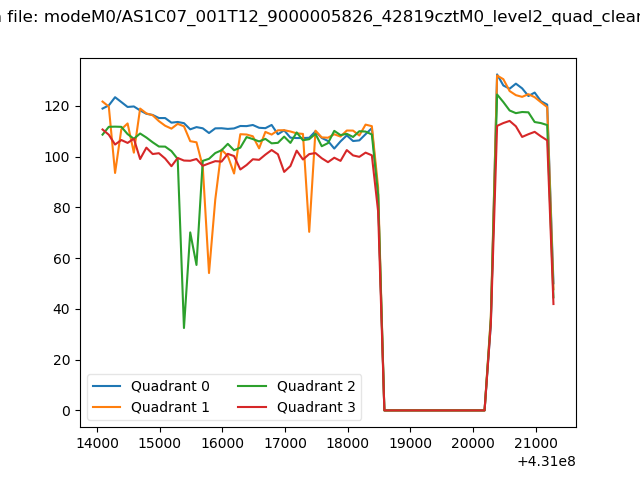 |
|
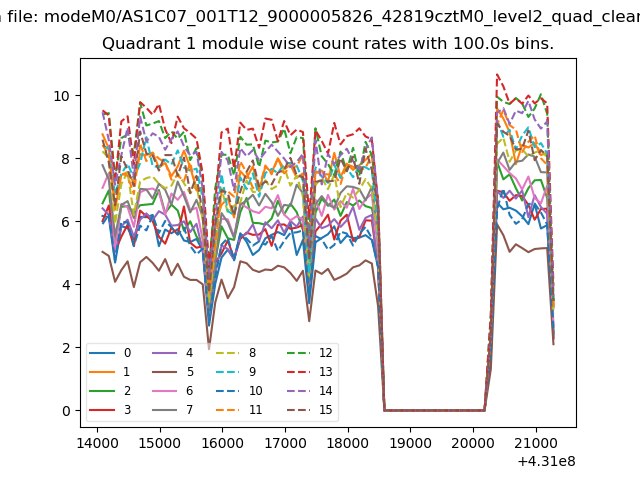
| Module-wise count rates for Quadrant A Data is divided into 100 sec bins |
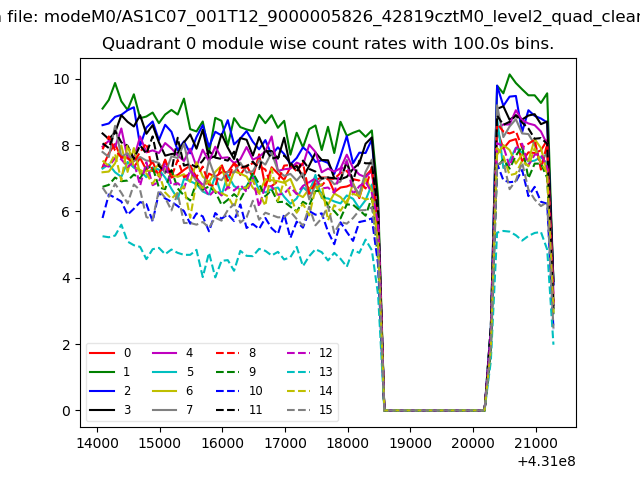 |
 |
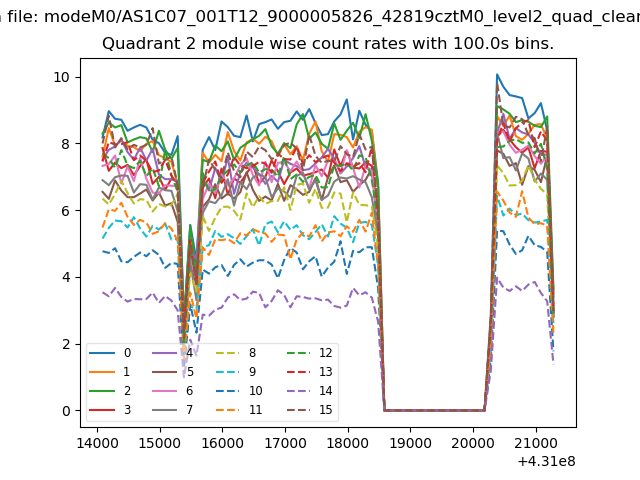
| Module-wise count rates for Quadrant B Data is divided into 100 sec bins |
 |
 |
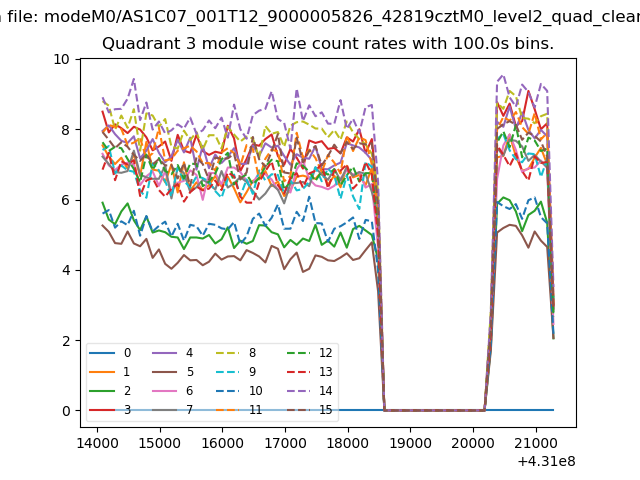
| Module-wise count rates for Quadrant C Data is divided into 100 sec bins |
 |
 |
| Module-wise count rates for Quadrant D Data is divided into 100 sec bins |
 |
 |
| Parameter | Plot |
|---|---|
| CZT HV Monitor | 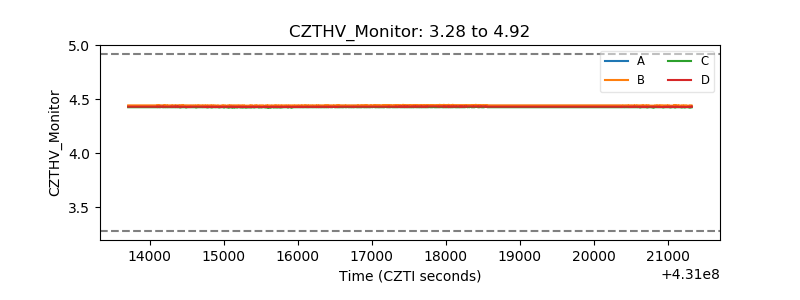 |
| D_VDD | 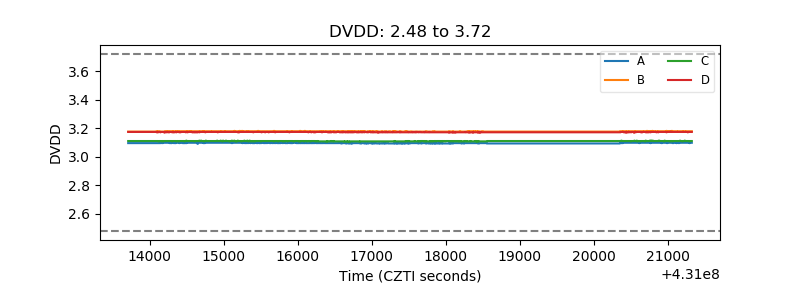 |
| Temperature 1 | 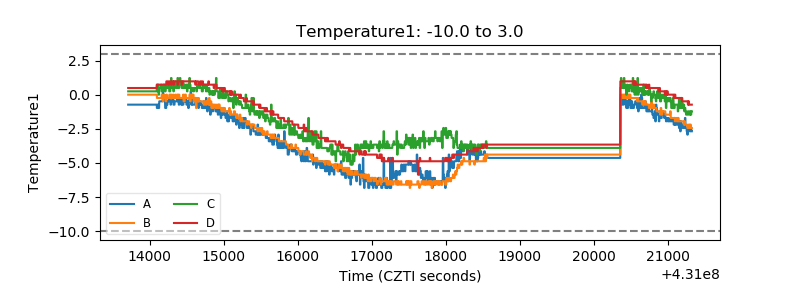 |
| Veto HV Monitor | 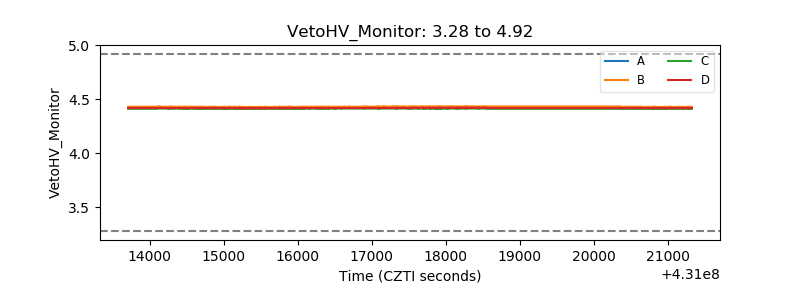 |
| Veto LLD | 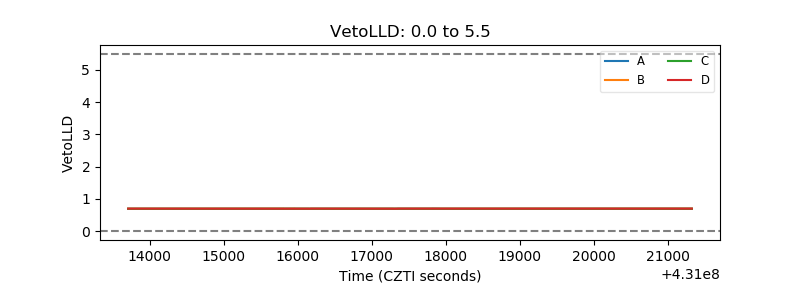 |
| Alpha Counter | 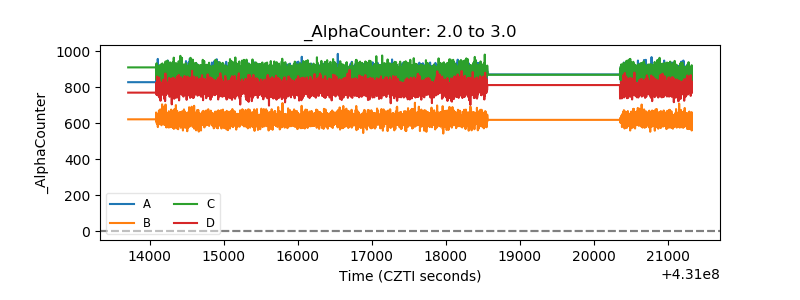 |
| _CPM_Rate | 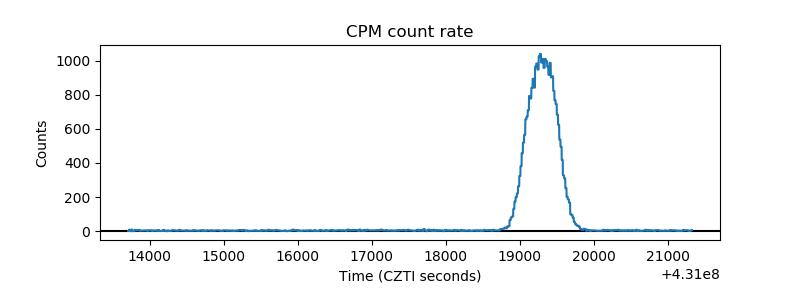 |
| CZT Counter | 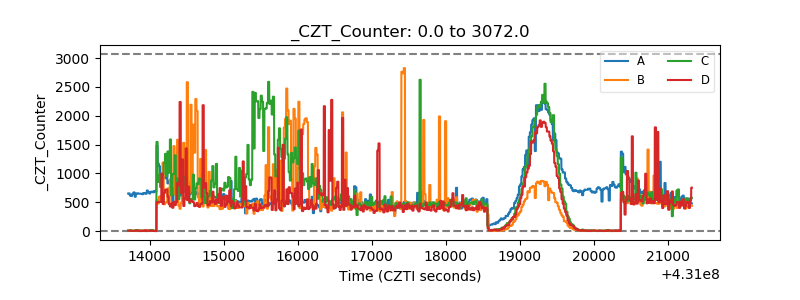 |
| +2.5 Volts monitor | 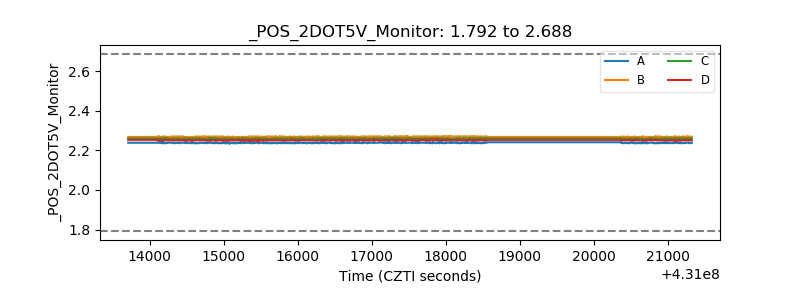 |
| +5 Volts monitor | 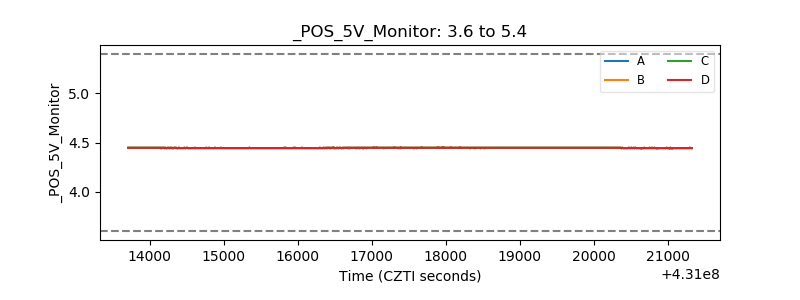 |
| _ROLL_ROT | 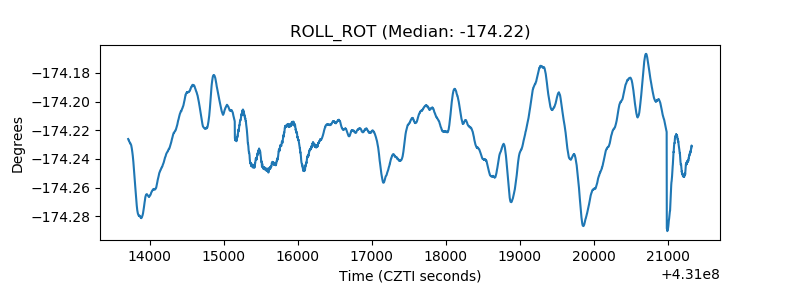 |
| _Roll_DEC | 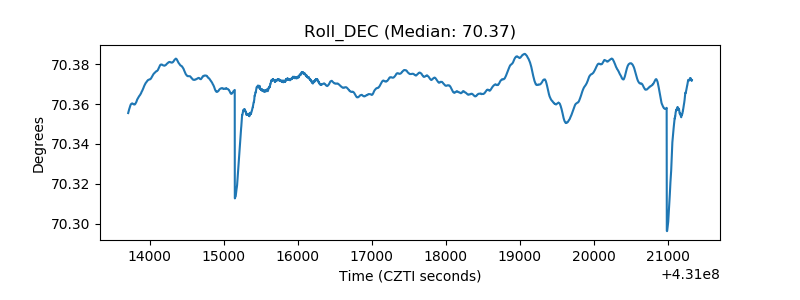 |
| _Roll_RA | 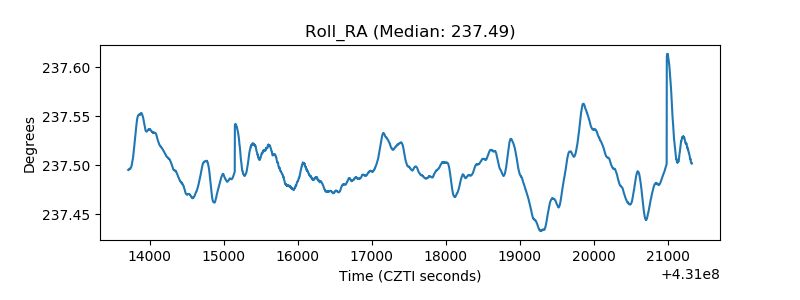 |
| Veto Counter | 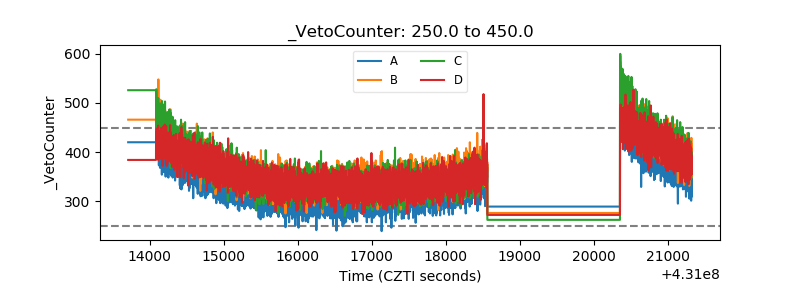 |