| Param | Original file | Final file |
|---|---|---|
| Filename | modeM0/AS1C07_001T12_9000005826_42820cztM0_level2.fits | modeM0/AS1C07_001T12_9000005826_42820cztM0_level2_quad_clean.evt |
| Size (bytes) | 311,270,400 | 89,017,920 |
| Size | 296.9 MB | 84.9 MB |
| Events in quadrant A | 2,934,208 | 602,209 |
| Events in quadrant B | 2,646,897 | 603,476 |
| Events in quadrant C | 2,781,399 | 582,073 |
| Events in quadrant D | 2,759,265 | 547,315 |
| Mode M0 | |||
|---|---|---|---|
| Quadrant | BADHDUFLAG | Total packets | Discarded packets |
| A | 0 | 11931 | 3 |
| B | 0 | 11401 | 2 |
| C | 0 | 11475 | 2 |
| D | 0 | 11873 | 2 |
| Mode SS | |||
|---|---|---|---|
| Quadrant | BADHDUFLAG | Total packets | Discarded packets |
| A | 0 | 106 | 0 |
| B | 0 | 106 | 0 |
| C | 0 | 106 | 0 |
| D | 0 | 106 | 0 |
| Mode M9 | |||
|---|---|---|---|
| Quadrant | BADHDUFLAG | Total packets | Discarded packets |
| A | 0 | 25 | 0 |
| B | 0 | 26 | 0 |
| C | 0 | 26 | 0 |
| D | 0 | 26 | 0 |
| Quadrant | Total seconds | Saturated seconds | Saturation percentage |
|---|---|---|---|
| A | 5138 | 27 | 0.525496% |
| B | 5138 | 49 | 0.953678% |
| C | 5138 | 10 | 0.194628% |
| D | 5138 | 39 | 0.759050% |
Noise dominated data is calculated using 1-second bins in cleaned event files. If a bin has >2000 counts, and if more than 50% of those come from <1% of pixels, then it is considered to be noise-dominated and hence unusable.
| Quadrant | # 1 sec bins | Bins with >0 counts | Bins with >2000 counts | High rate bins dominated by noise | Noise dominated (total time) | Noise dominated (detector-on time) | Marked lightcurve |
|---|---|---|---|---|---|---|---|
| A | 7021 | 5139 | 16 | 16 | 0.23% | 0.31% | 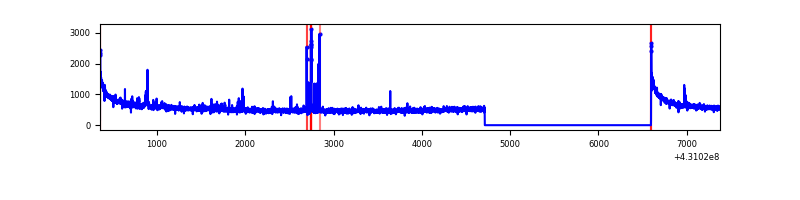 |
| B | 7021 | 5139 | 34 | 34 | 0.48% | 0.66% | 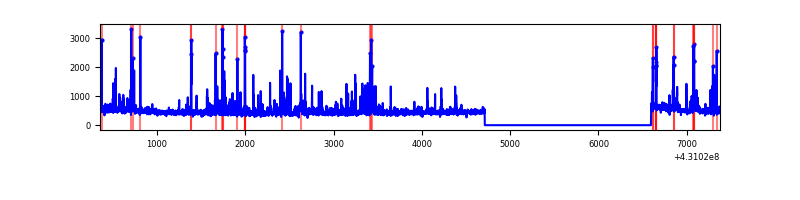 |
| C | 7021 | 5139 | 8 | 8 | 0.11% | 0.16% | 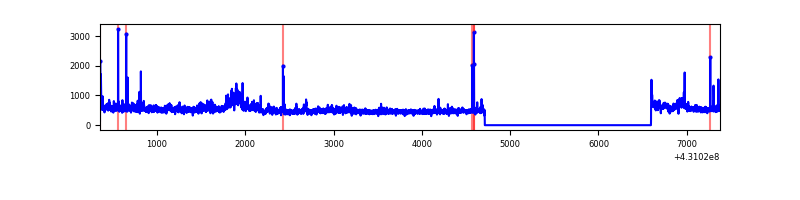 |
| D | 7021 | 5139 | 42 | 42 | 0.60% | 0.82% | 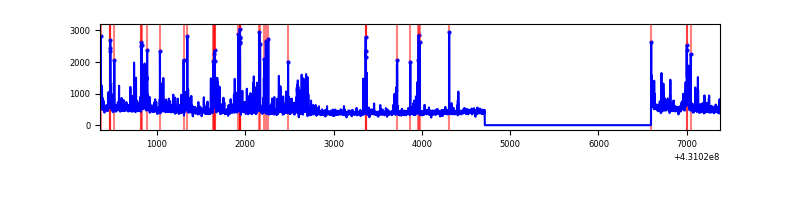 |
Top three noisy pixels from each quadrant. If the there are fewer than three noisy pixels in the level2.evt file, extra rows are filled as -1
| Pixel properties | Quadrant properties | ||||||
|---|---|---|---|---|---|---|---|
| Quadrant | DetID | PixID | Counts | Sigma | Mean | Median | Sigma |
| A | 10 | 83 | 651376 | 5669.45 | 560 | 550 | 114.8 |
| A | 12 | 189 | 49945 | 430.29 | 560 | 550 | 114.8 |
| A | 15 | 237 | 38604 | 331.49 | 560 | 550 | 114.8 |
| B | 7 | 221 | 107972 | 1012.91 | 559 | 545 | 106.1 |
| B | 5 | 255 | 102898 | 965.07 | 559 | 545 | 106.1 |
| B | 0 | 245 | 75404 | 705.84 | 559 | 545 | 106.1 |
| C | 3 | 233 | 328635 | 2568.75 | 554 | 558 | 127.7 |
| C | 15 | 214 | 211315 | 1650.17 | 554 | 558 | 127.7 |
| C | 14 | 254 | 28254 | 216.85 | 554 | 558 | 127.7 |
| D | 1 | 47 | 229163 | 1696.42 | 553 | 538 | 134.8 |
| D | 1 | 52 | 124819 | 922.18 | 553 | 538 | 134.8 |
| D | 7 | 96 | 48077 | 352.74 | 553 | 538 | 134.8 |
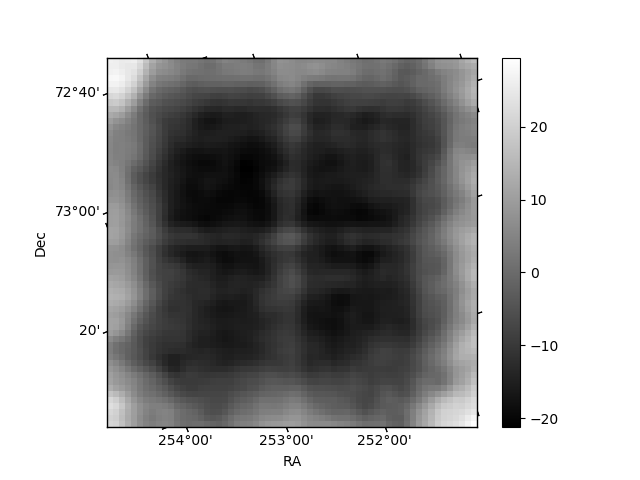
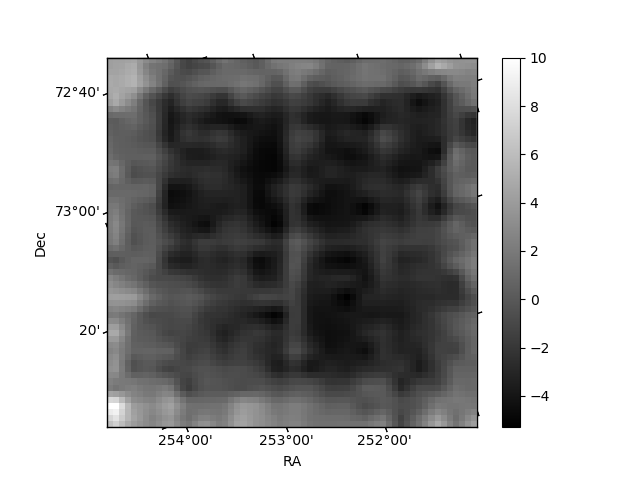
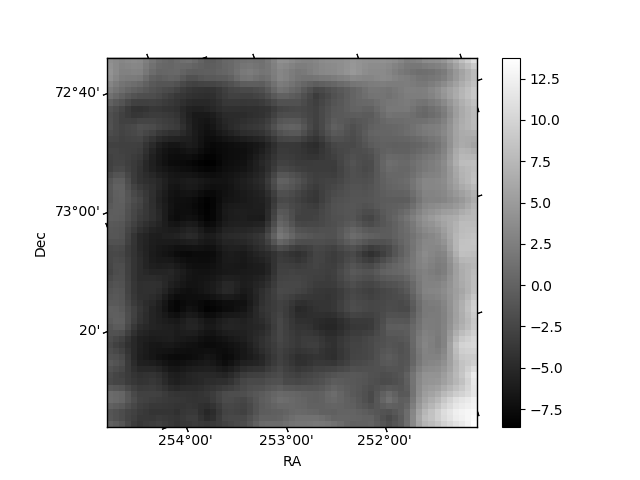
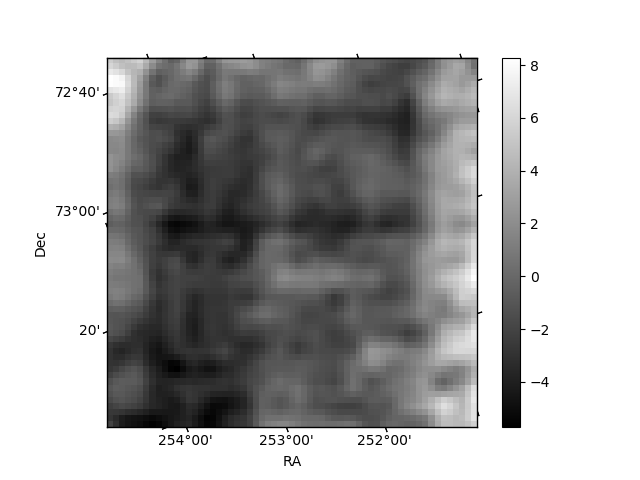
Histogram calculated using DETX and DETY for each event in the final _common_clean file
| Quadrant A | 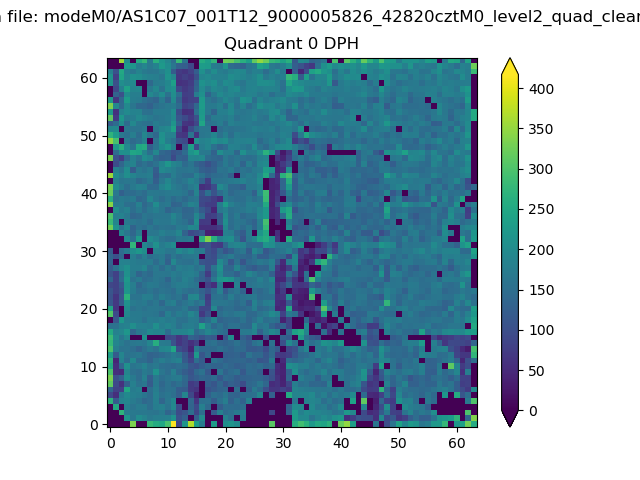 |
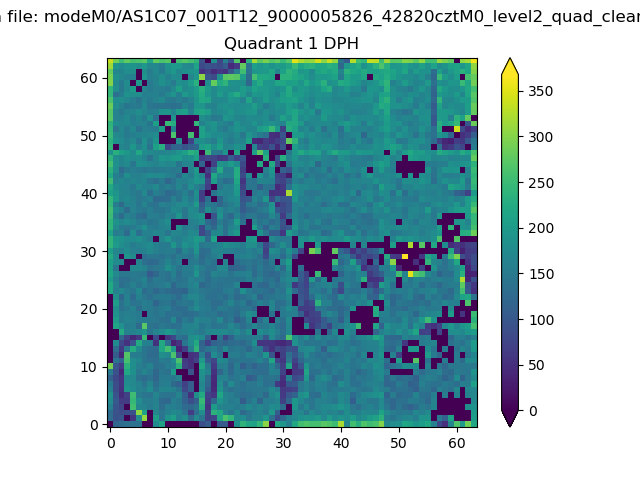 |
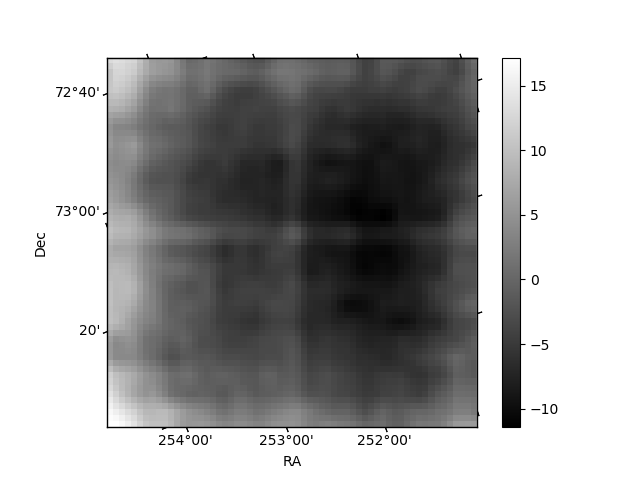
Quadrant B |
|---|---|---|---|
| Quadrant D | 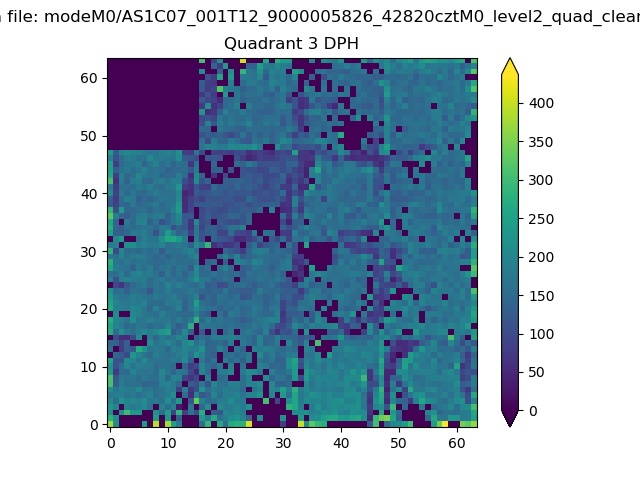 |
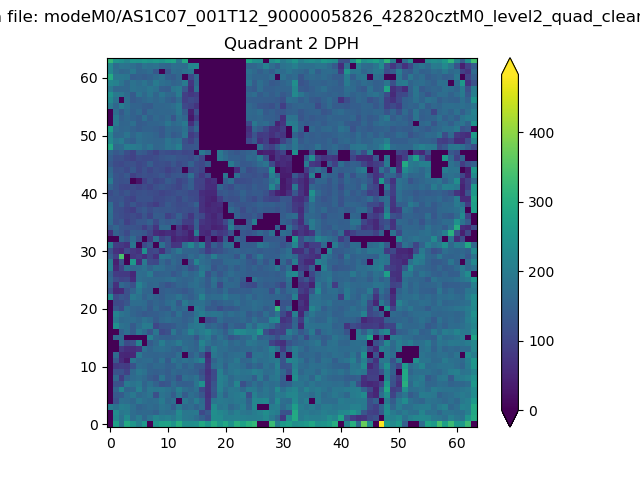 |
Quadrant C |
| Plot type | Count rate plots | Images |
|---|---|---|
| Comparison with Poisson distribution Blue bars denote a histogram of data divided into 1 sec bins. Red curve is a Poisson curve with rate = median count rate of data. |
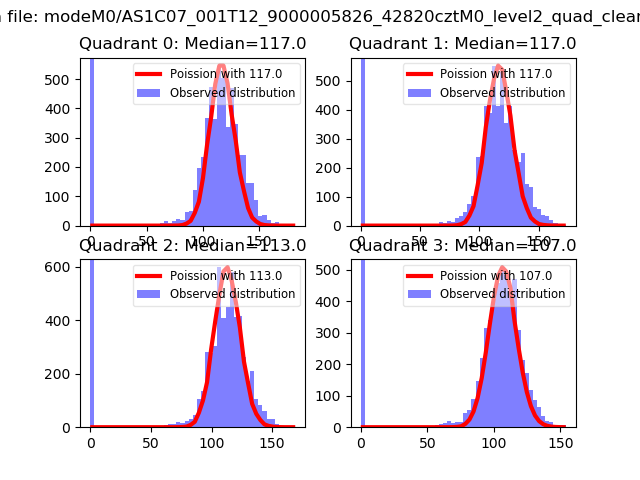 |
 |
| Quadrant-wise count rates Data is divided into 100 sec bins |
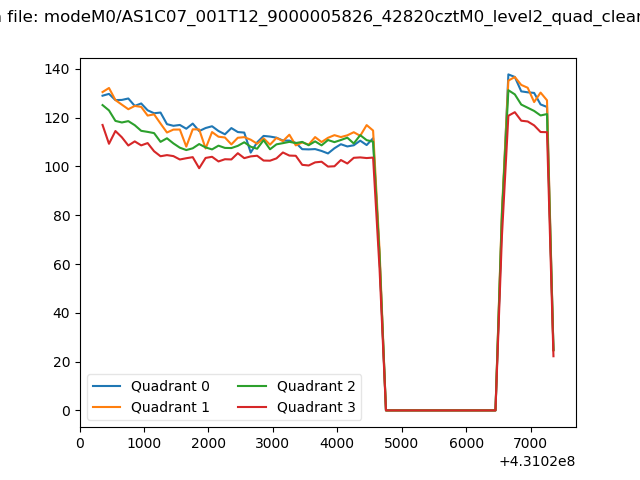 |
|
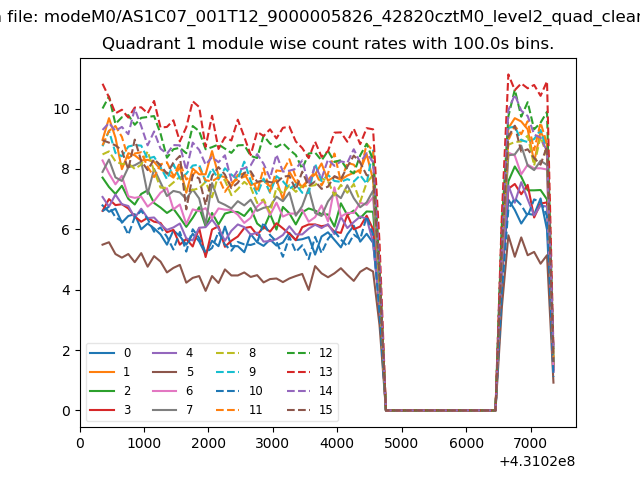
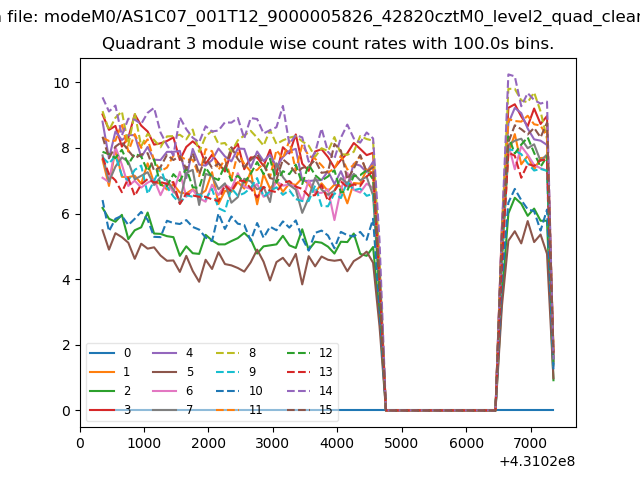
| Module-wise count rates for Quadrant A Data is divided into 100 sec bins |
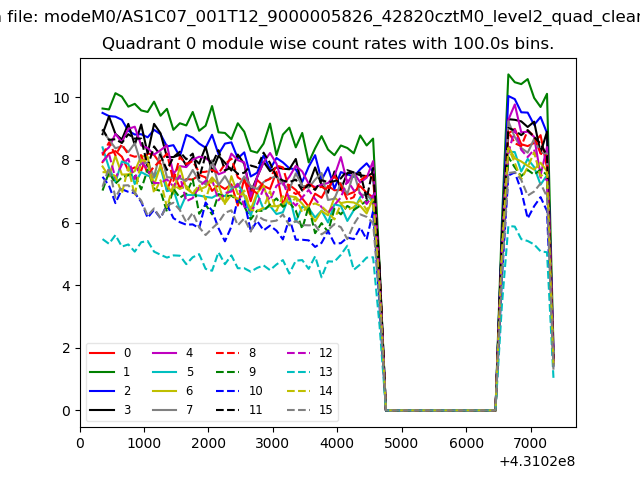 |
 |
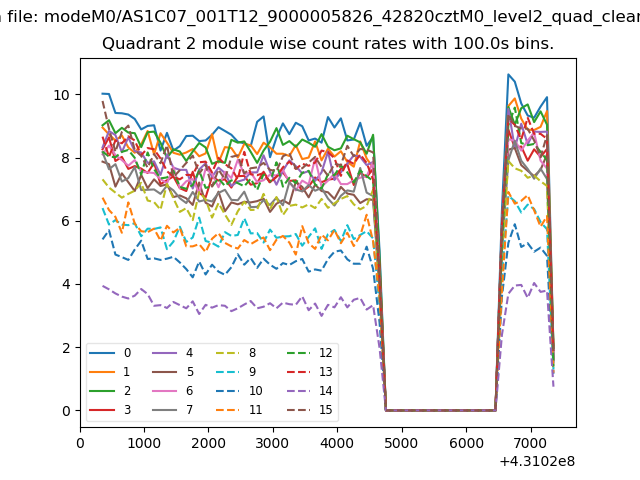
| Module-wise count rates for Quadrant B Data is divided into 100 sec bins |
 |
 |
| Module-wise count rates for Quadrant C Data is divided into 100 sec bins |
 |
 |
| Module-wise count rates for Quadrant D Data is divided into 100 sec bins |
 |
 |
| Parameter | Plot |
|---|---|
| CZT HV Monitor | 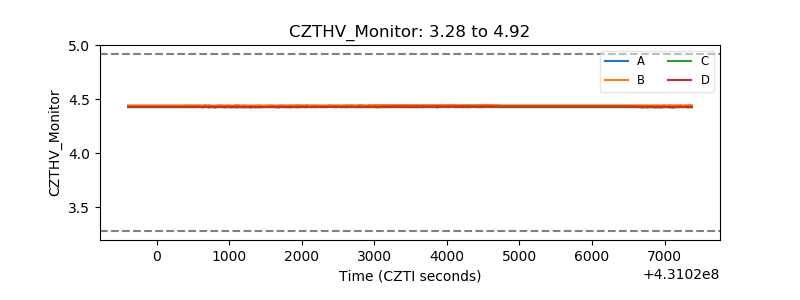 |
| D_VDD | 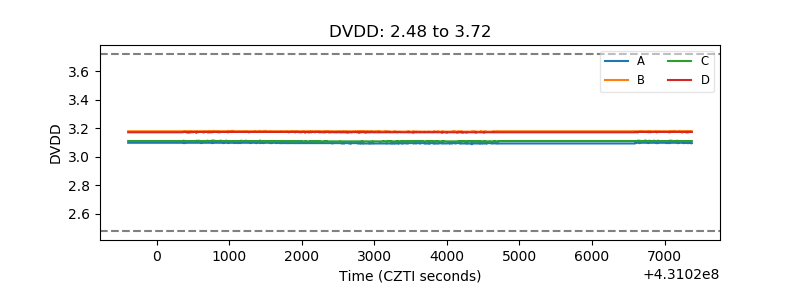 |
| Temperature 1 | 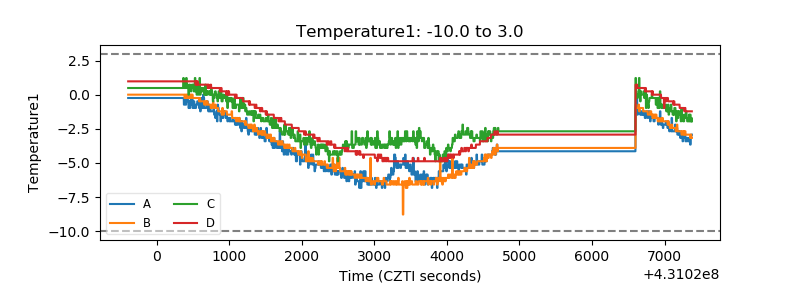 |
| Veto HV Monitor | 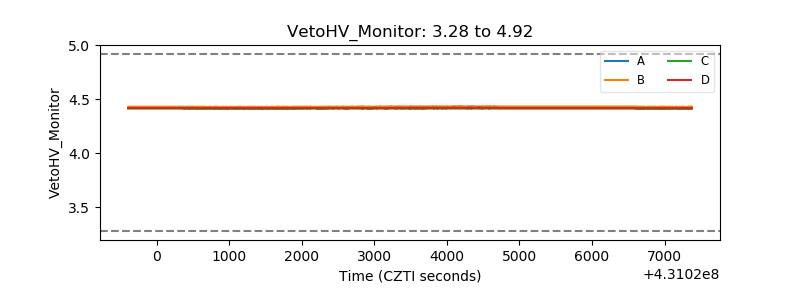 |
| Veto LLD | 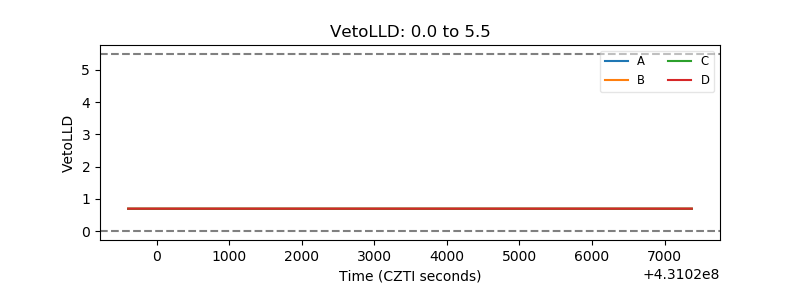 |
| Alpha Counter | 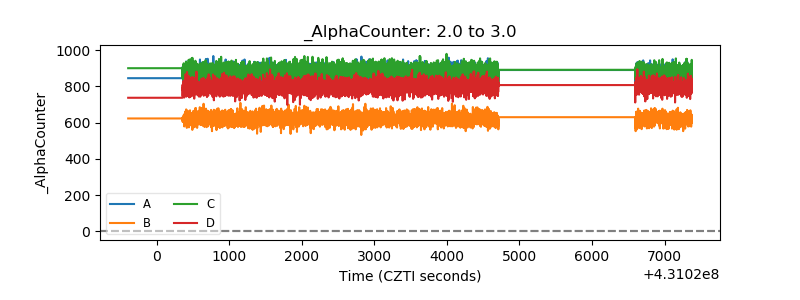 |
| _CPM_Rate | 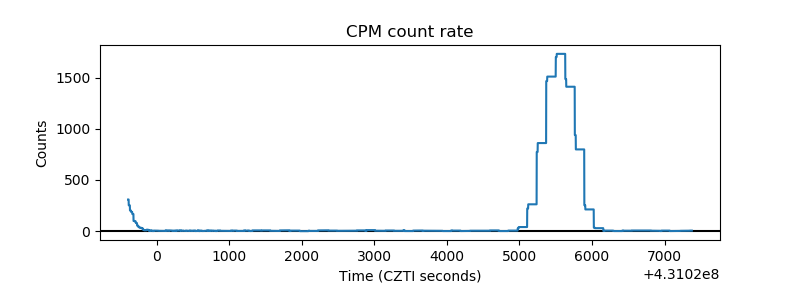 |
| CZT Counter | 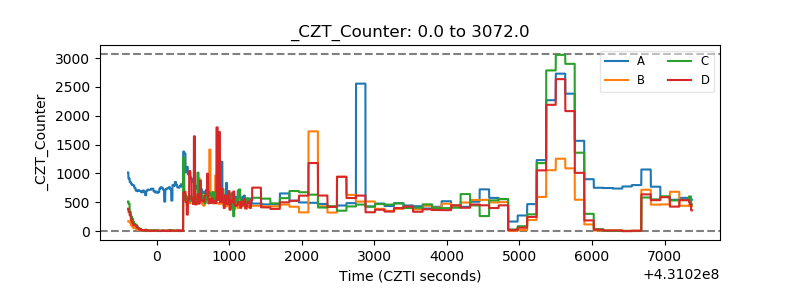 |
| +2.5 Volts monitor |  |
| +5 Volts monitor | 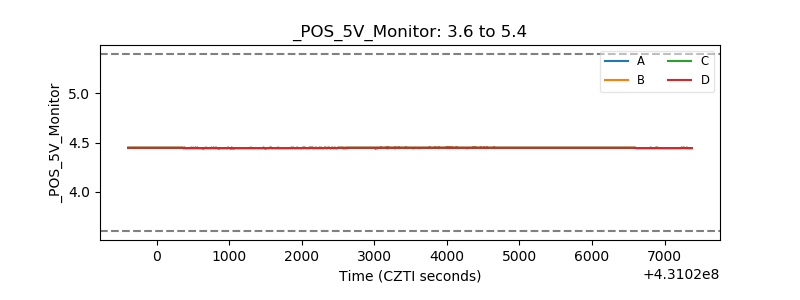 |
| _ROLL_ROT | 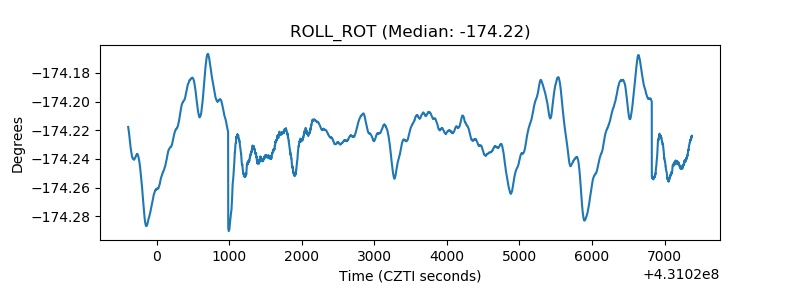 |
| _Roll_DEC | 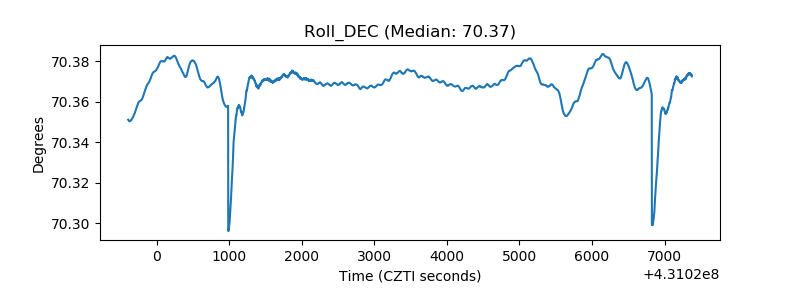 |
| _Roll_RA | 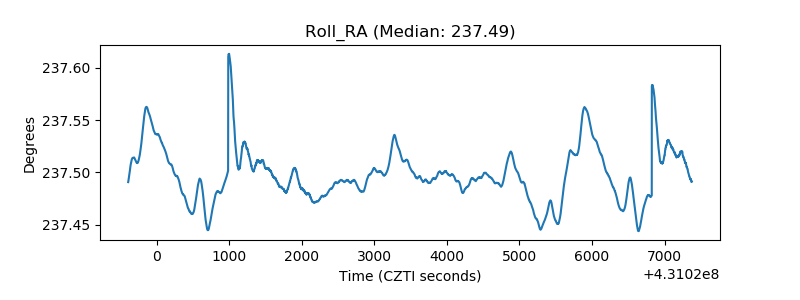 |
| Veto Counter | 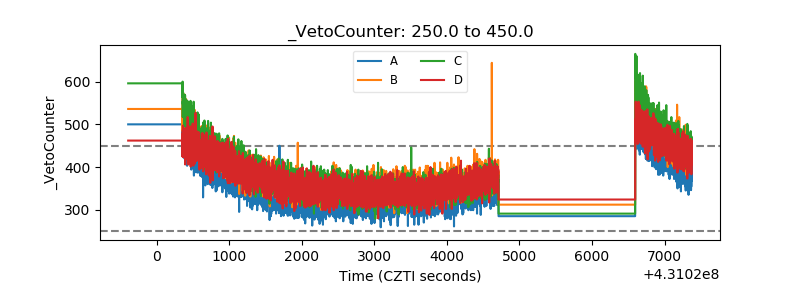 |