| Param | Original file | Final file |
|---|---|---|
| Filename | modeM0/AS1C07_001T12_9000005826_42821cztM0_level2.fits | modeM0/AS1C07_001T12_9000005826_42821cztM0_level2_quad_clean.evt |
| Size (bytes) | 310,158,720 | 89,979,840 |
| Size | 295.8 MB | 85.8 MB |
| Events in quadrant A | 2,836,947 | 604,738 |
| Events in quadrant B | 2,705,621 | 615,947 |
| Events in quadrant C | 2,624,560 | 596,916 |
| Events in quadrant D | 2,917,678 | 550,679 |
| Mode M0 | |||
|---|---|---|---|
| Quadrant | BADHDUFLAG | Total packets | Discarded packets |
| A | 0 | 11560 | 2 |
| B | 0 | 11459 | 2 |
| C | 0 | 10997 | 2 |
| D | 0 | 12227 | 2 |
| Mode SS | |||
|---|---|---|---|
| Quadrant | BADHDUFLAG | Total packets | Discarded packets |
| A | 0 | 104 | 0 |
| B | 0 | 104 | 0 |
| C | 0 | 104 | 0 |
| D | 0 | 104 | 0 |
| Mode M9 | |||
|---|---|---|---|
| Quadrant | BADHDUFLAG | Total packets | Discarded packets |
| A | 0 | 28 | 0 |
| B | 0 | 29 | 0 |
| C | 0 | 29 | 0 |
| D | 0 | 29 | 0 |
| Quadrant | Total seconds | Saturated seconds | Saturation percentage |
|---|---|---|---|
| A | 5083 | 17 | 0.334448% |
| B | 5083 | 53 | 1.042691% |
| C | 5083 | 12 | 0.236081% |
| D | 5083 | 78 | 1.534527% |
Noise dominated data is calculated using 1-second bins in cleaned event files. If a bin has >2000 counts, and if more than 50% of those come from <1% of pixels, then it is considered to be noise-dominated and hence unusable.
| Quadrant | # 1 sec bins | Bins with >0 counts | Bins with >2000 counts | High rate bins dominated by noise | Noise dominated (total time) | Noise dominated (detector-on time) | Marked lightcurve |
|---|---|---|---|---|---|---|---|
| A | 7083 | 5084 | 8 | 8 | 0.11% | 0.16% | 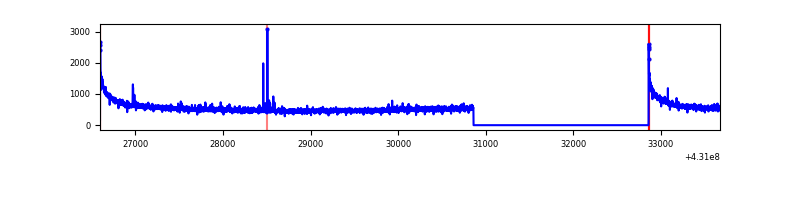 |
| B | 7083 | 5084 | 43 | 43 | 0.61% | 0.85% | 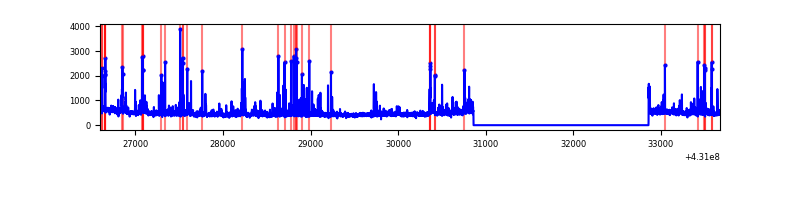 |
| C | 7083 | 5084 | 7 | 7 | 0.10% | 0.14% | 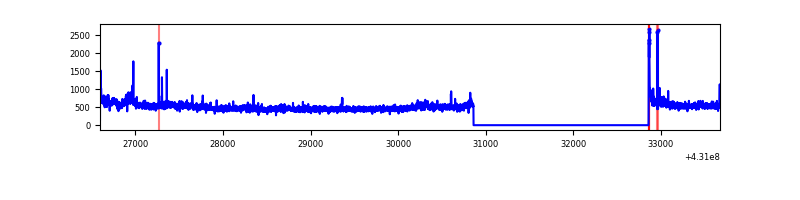 |
| D | 7083 | 5084 | 69 | 69 | 0.97% | 1.36% | 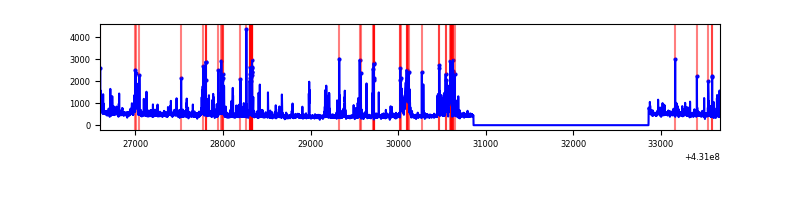 |
Top three noisy pixels from each quadrant. If the there are fewer than three noisy pixels in the level2.evt file, extra rows are filled as -1
| Pixel properties | Quadrant properties | ||||||
|---|---|---|---|---|---|---|---|
| Quadrant | DetID | PixID | Counts | Sigma | Mean | Median | Sigma |
| A | 10 | 83 | 627943 | 5475.95 | 558 | 546 | 114.6 |
| A | 12 | 189 | 14741 | 123.89 | 558 | 546 | 114.6 |
| A | 15 | 237 | 11587 | 96.37 | 558 | 546 | 114.6 |
| B | 0 | 190 | 125236 | 1182.65 | 559 | 545 | 105.4 |
| B | 5 | 255 | 115833 | 1093.46 | 559 | 545 | 105.4 |
| B | 0 | 245 | 74851 | 704.76 | 559 | 545 | 105.4 |
| C | 15 | 214 | 208107 | 1616.33 | 556 | 561 | 128.4 |
| C | 3 | 233 | 200702 | 1558.66 | 556 | 561 | 128.4 |
| C | 14 | 254 | 21389 | 162.2 | 556 | 561 | 128.4 |
| D | 12 | 33 | 246178 | 1834.76 | 551 | 535 | 133.9 |
| D | 1 | 47 | 111815 | 831.17 | 551 | 535 | 133.9 |
| D | 1 | 52 | 106827 | 793.92 | 551 | 535 | 133.9 |
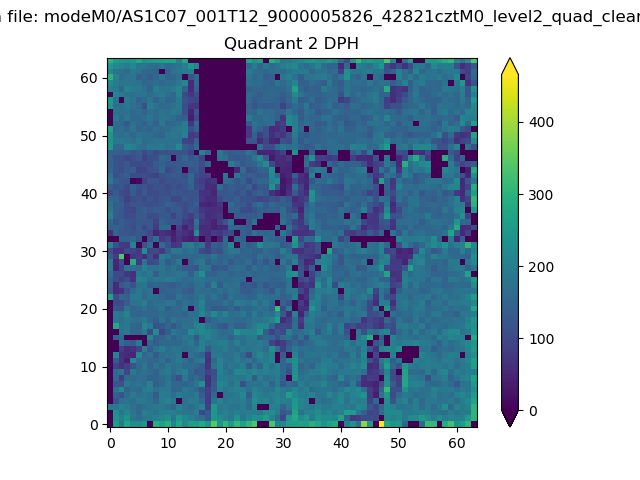
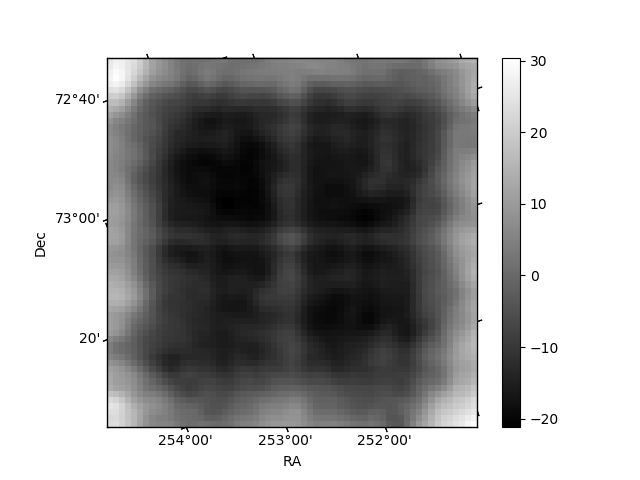
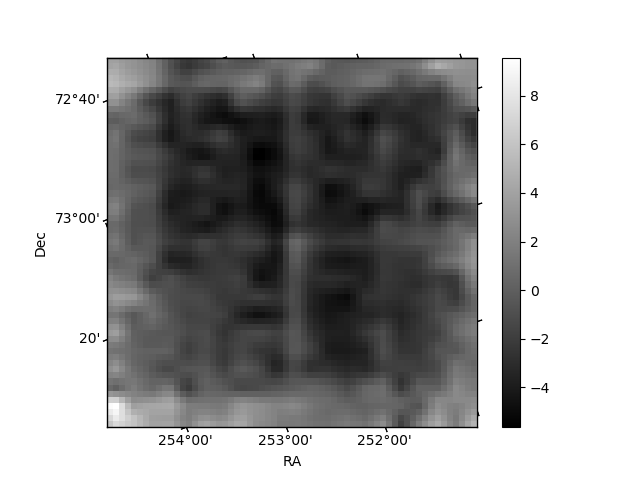
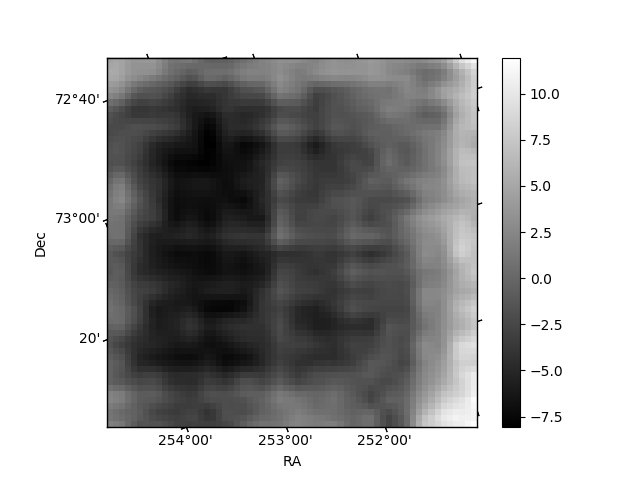
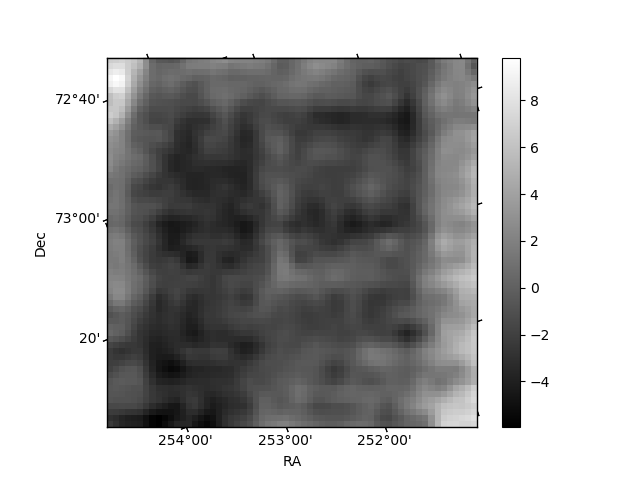
Histogram calculated using DETX and DETY for each event in the final _common_clean file
| Quadrant A | 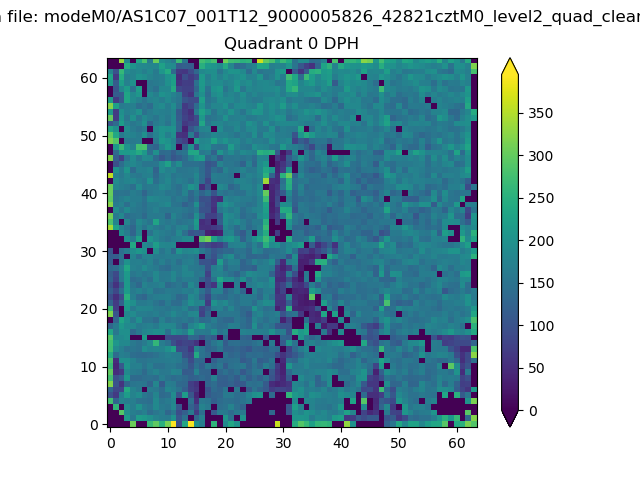 |
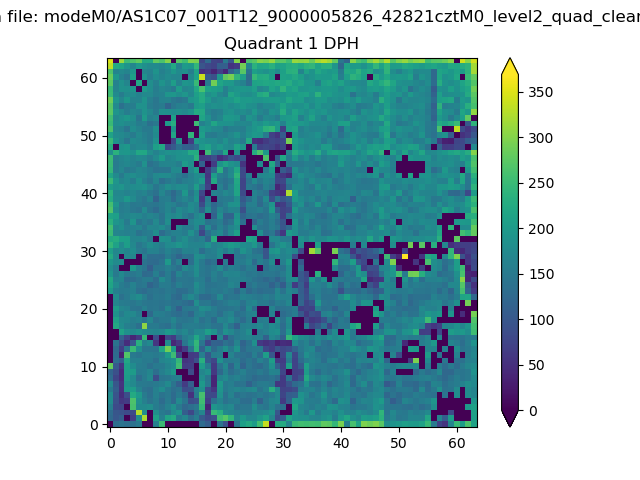 |
Quadrant B |
|---|---|---|---|
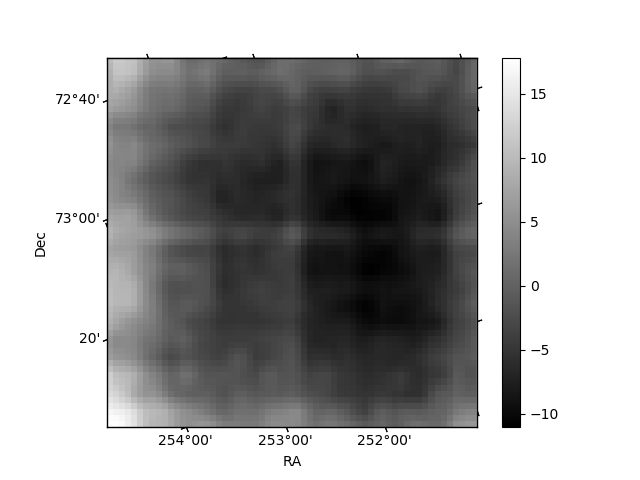
| Quadrant D | 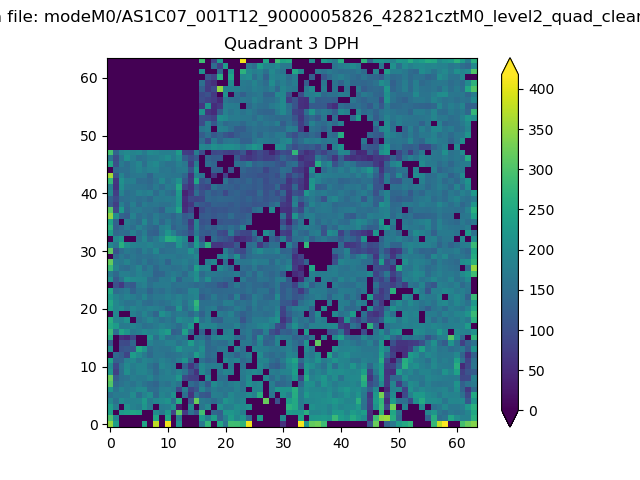 |
 |
Quadrant C |
| Plot type | Count rate plots | Images |
|---|---|---|
| Comparison with Poisson distribution Blue bars denote a histogram of data divided into 1 sec bins. Red curve is a Poisson curve with rate = median count rate of data. |
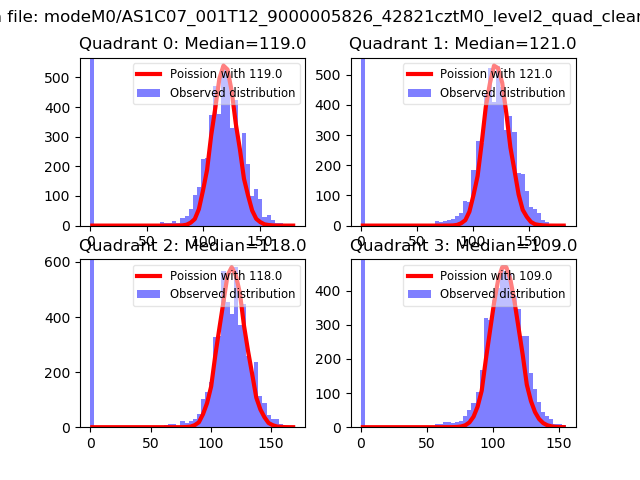 |
 |
| Quadrant-wise count rates Data is divided into 100 sec bins |
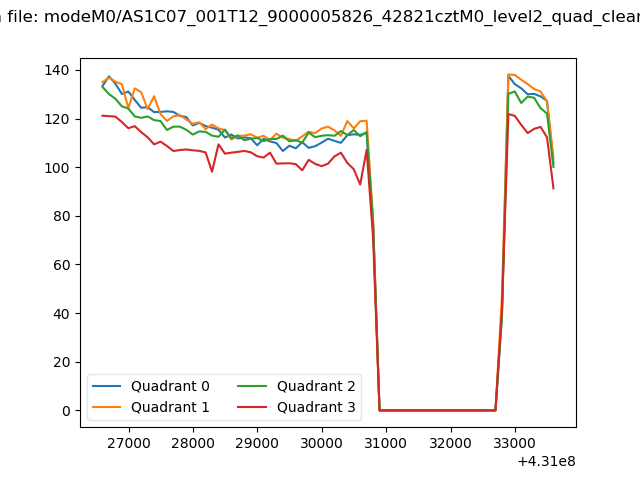 |
|
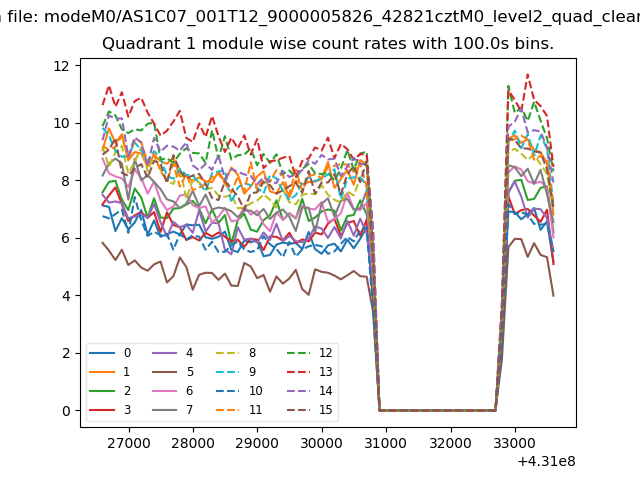
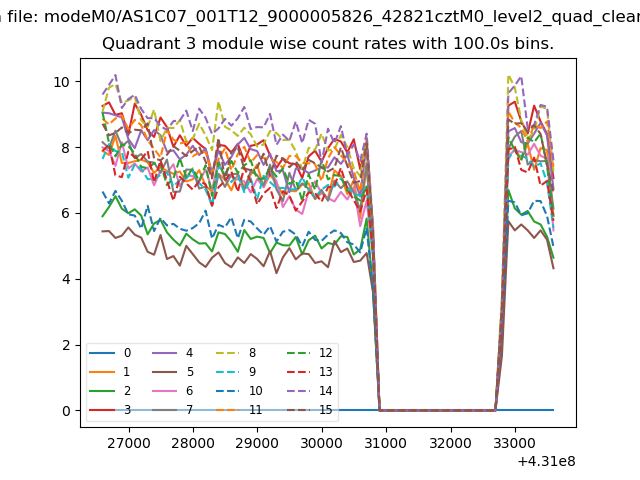
| Module-wise count rates for Quadrant A Data is divided into 100 sec bins |
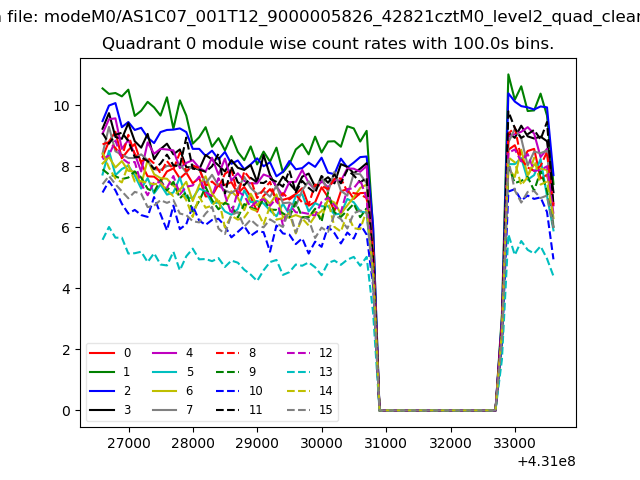 |
 |
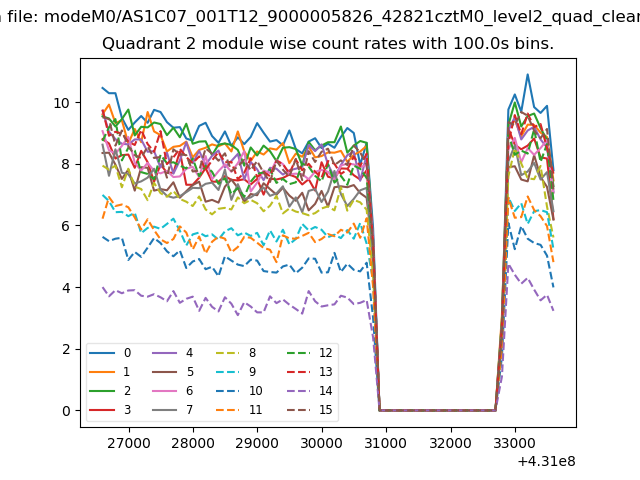
| Module-wise count rates for Quadrant B Data is divided into 100 sec bins |
 |
 |
| Module-wise count rates for Quadrant C Data is divided into 100 sec bins |
 |
 |
| Module-wise count rates for Quadrant D Data is divided into 100 sec bins |
 |
 |
| Parameter | Plot |
|---|---|
| CZT HV Monitor | 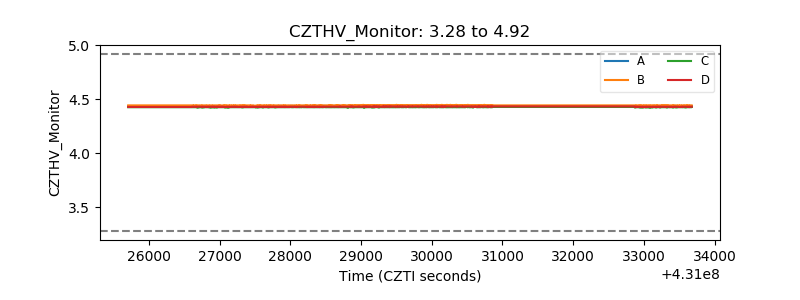 |
| D_VDD | 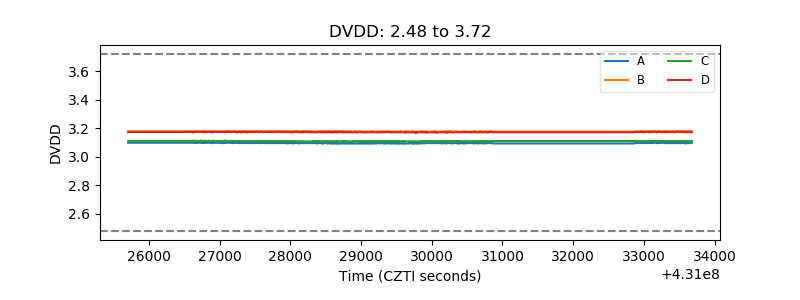 |
| Temperature 1 | 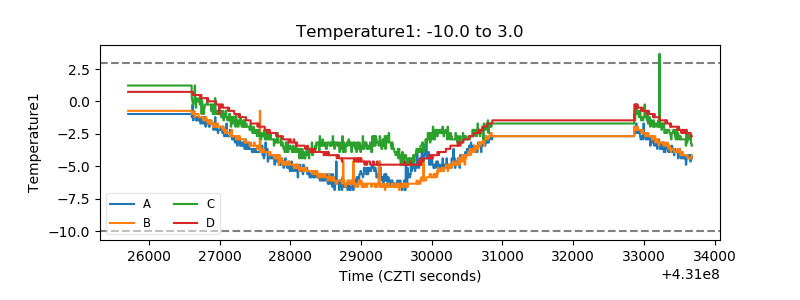 |
| Veto HV Monitor | 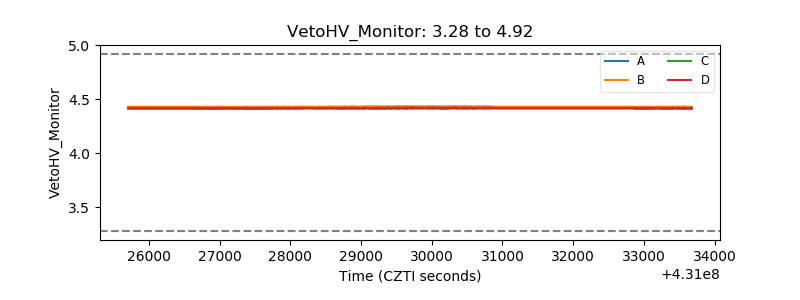 |
| Veto LLD | 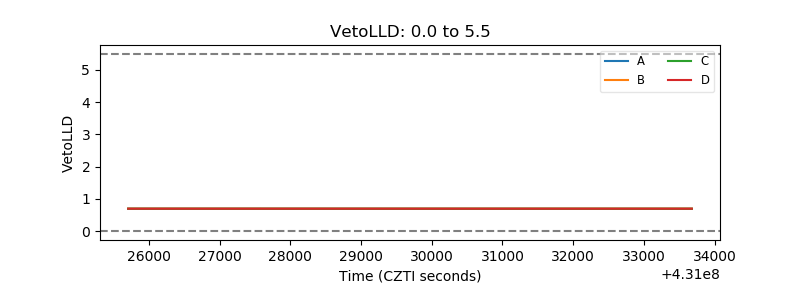 |
| Alpha Counter | 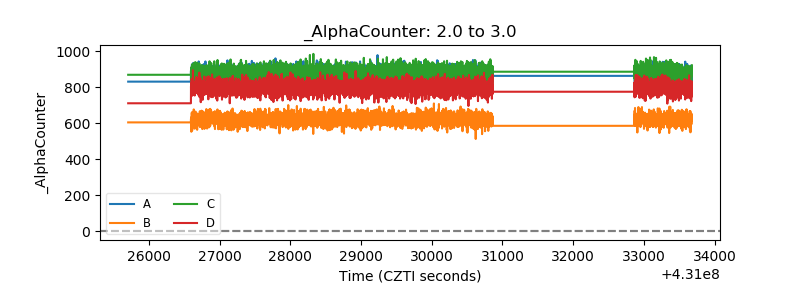 |
| _CPM_Rate | 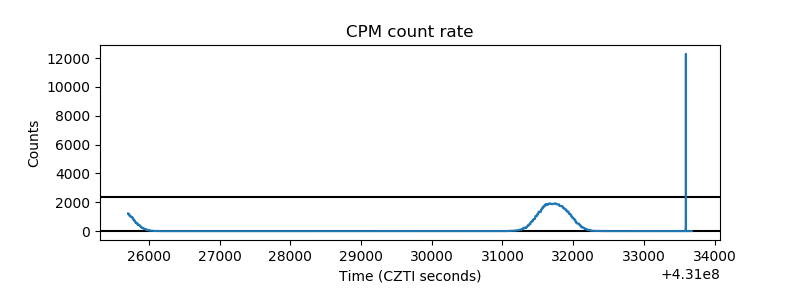 |
| CZT Counter | 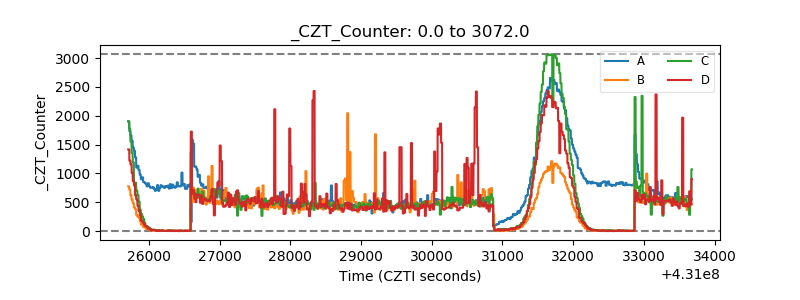 |
| +2.5 Volts monitor | 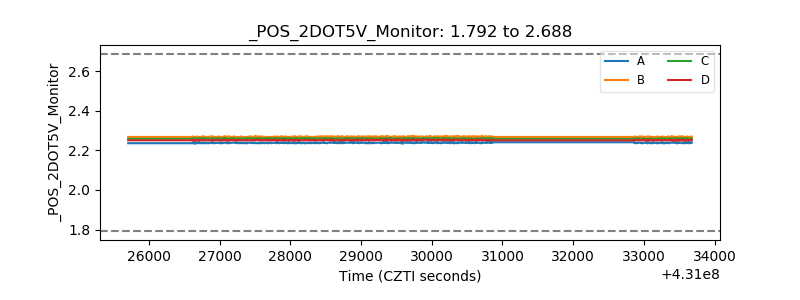 |
| +5 Volts monitor | 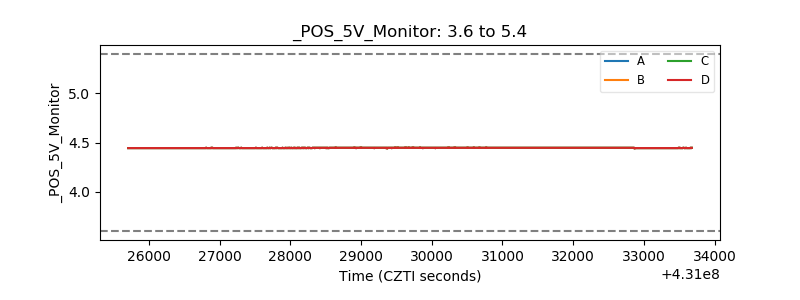 |
| _ROLL_ROT | 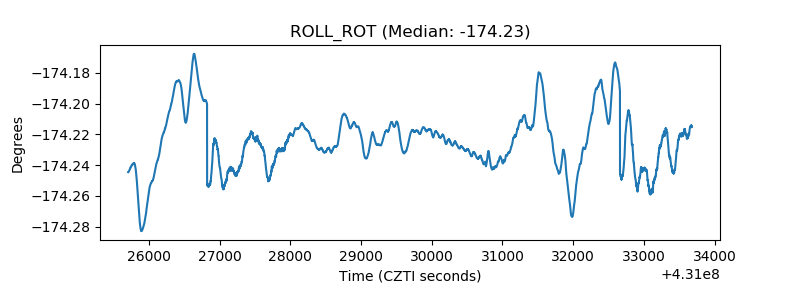 |
| _Roll_DEC | 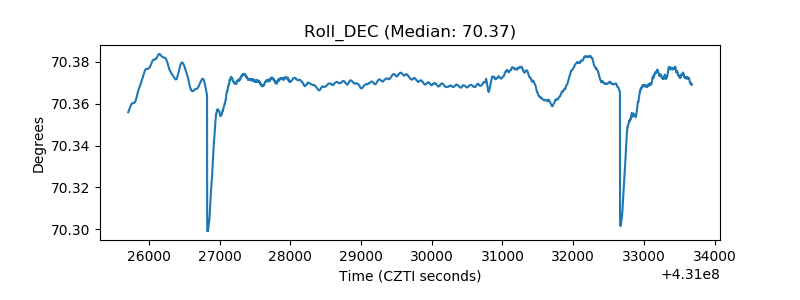 |
| _Roll_RA | 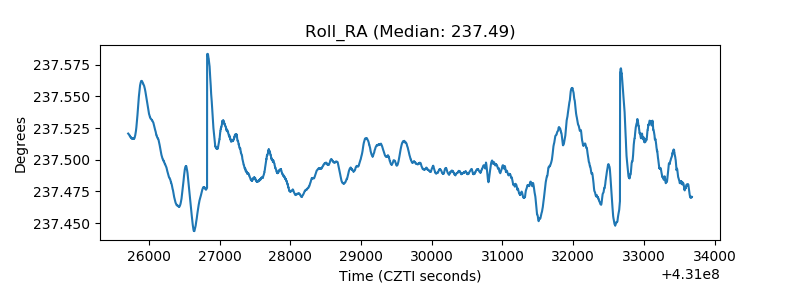 |
| Veto Counter | 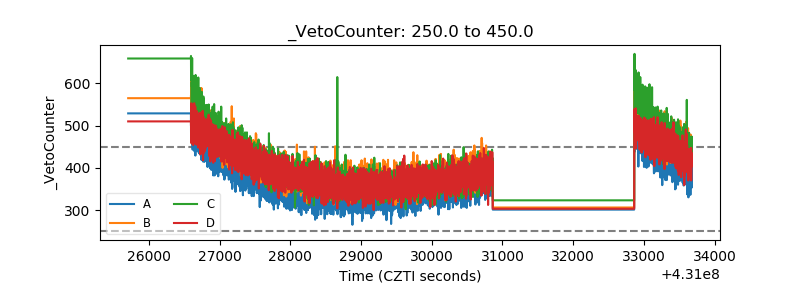 |