| Param | Original file | Final file |
|---|---|---|
| Filename | modeM0/AS1C07_001T12_9000005826_42822cztM0_level2.fits | modeM0/AS1C07_001T12_9000005826_42822cztM0_level2_quad_clean.evt |
| Size (bytes) | 316,828,800 | 86,906,880 |
| Size | 302.2 MB | 82.9 MB |
| Events in quadrant A | 2,745,739 | 586,688 |
| Events in quadrant B | 2,446,329 | 606,265 |
| Events in quadrant C | 2,562,669 | 583,495 |
| Events in quadrant D | 3,585,538 | 506,451 |
| Mode M0 | |||
|---|---|---|---|
| Quadrant | BADHDUFLAG | Total packets | Discarded packets |
| A | 0 | 11201 | 2 |
| B | 0 | 10641 | 2 |
| C | 0 | 10747 | 2 |
| D | 0 | 14117 | 2 |
| Mode SS | |||
|---|---|---|---|
| Quadrant | BADHDUFLAG | Total packets | Discarded packets |
| A | 0 | 102 | 0 |
| B | 0 | 102 | 0 |
| C | 0 | 102 | 0 |
| D | 0 | 102 | 0 |
| Mode M9 | |||
|---|---|---|---|
| Quadrant | BADHDUFLAG | Total packets | Discarded packets |
| A | 0 | 31 | 0 |
| B | 0 | 32 | 0 |
| C | 0 | 32 | 0 |
| D | 0 | 32 | 0 |
| Quadrant | Total seconds | Saturated seconds | Saturation percentage |
|---|---|---|---|
| A | 4971 | 21 | 0.422450% |
| B | 4971 | 35 | 0.704084% |
| C | 4971 | 42 | 0.844900% |
| D | 4971 | 361 | 7.262120% |
Noise dominated data is calculated using 1-second bins in cleaned event files. If a bin has >2000 counts, and if more than 50% of those come from <1% of pixels, then it is considered to be noise-dominated and hence unusable.
| Quadrant | # 1 sec bins | Bins with >0 counts | Bins with >2000 counts | High rate bins dominated by noise | Noise dominated (total time) | Noise dominated (detector-on time) | Marked lightcurve |
|---|---|---|---|---|---|---|---|
| A | 7064 | 4972 | 11 | 11 | 0.16% | 0.22% | 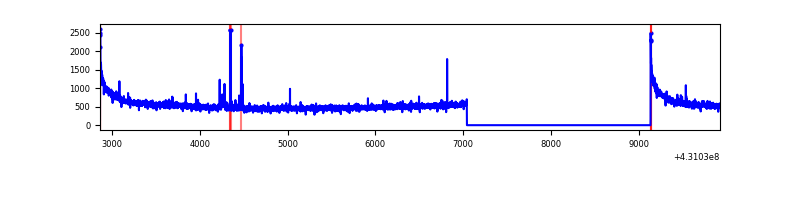 |
| B | 7064 | 4972 | 23 | 23 | 0.33% | 0.46% | 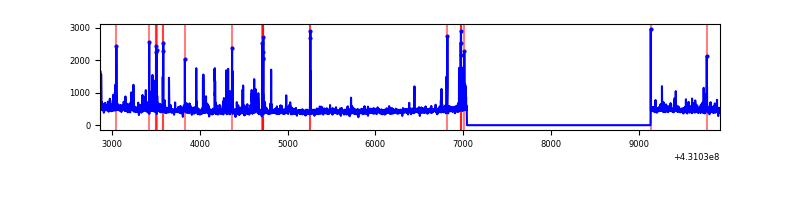 |
| C | 7064 | 4972 | 33 | 33 | 0.47% | 0.66% | 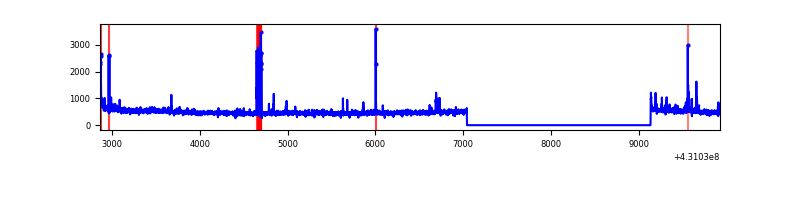 |
| D | 7064 | 4972 | 376 | 376 | 5.32% | 7.56% | 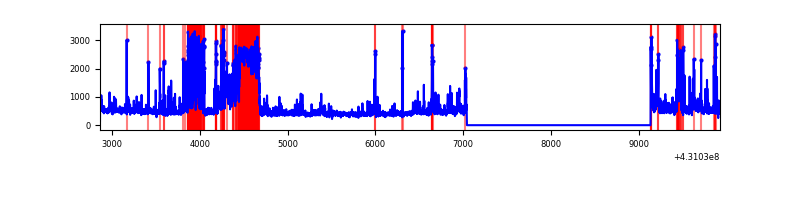 |
Top three noisy pixels from each quadrant. If the there are fewer than three noisy pixels in the level2.evt file, extra rows are filled as -1
| Pixel properties | Quadrant properties | ||||||
|---|---|---|---|---|---|---|---|
| Quadrant | DetID | PixID | Counts | Sigma | Mean | Median | Sigma |
| A | 10 | 83 | 592725 | 5282.13 | 542 | 530 | 112.1 |
| A | 12 | 189 | 16780 | 144.94 | 542 | 530 | 112.1 |
| A | 15 | 237 | 16048 | 138.41 | 542 | 530 | 112.1 |
| B | 5 | 255 | 100114 | 970.62 | 547 | 533 | 102.6 |
| B | 5 | 172 | 63747 | 616.15 | 547 | 533 | 102.6 |
| B | 0 | 245 | 60734 | 586.78 | 547 | 533 | 102.6 |
| C | 15 | 214 | 200247 | 1612.75 | 538 | 542 | 123.8 |
| C | 14 | 254 | 125617 | 1010.06 | 538 | 542 | 123.8 |
| C | 3 | 233 | 118325 | 951.17 | 538 | 542 | 123.8 |
| D | 12 | 33 | 749006 | 5894.7 | 522 | 505 | 127.0 |
| D | 14 | 49 | 237474 | 1866.21 | 522 | 505 | 127.0 |
| D | 1 | 47 | 94876 | 743.2 | 522 | 505 | 127.0 |
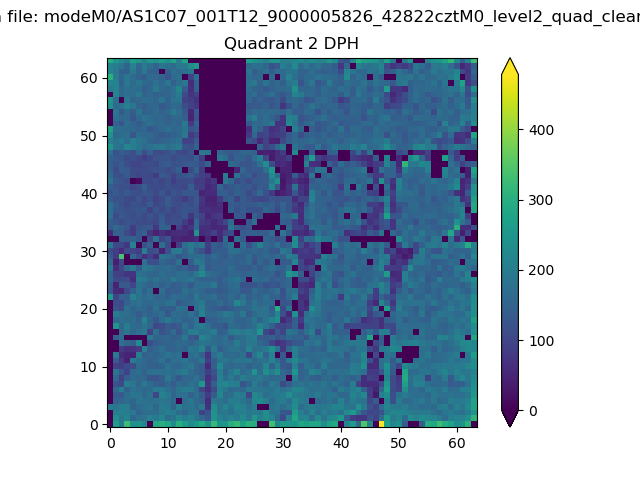
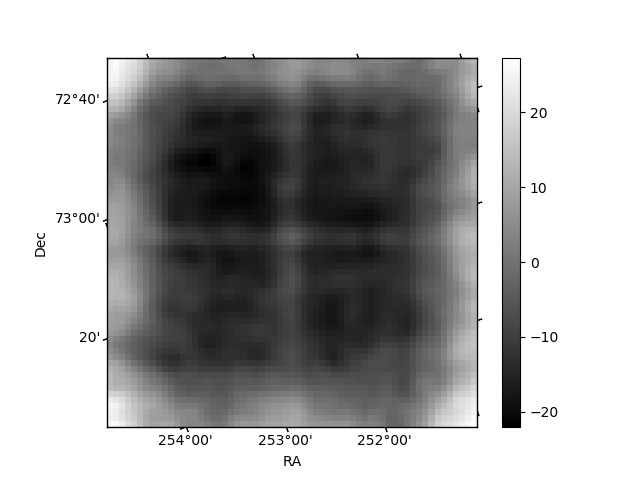
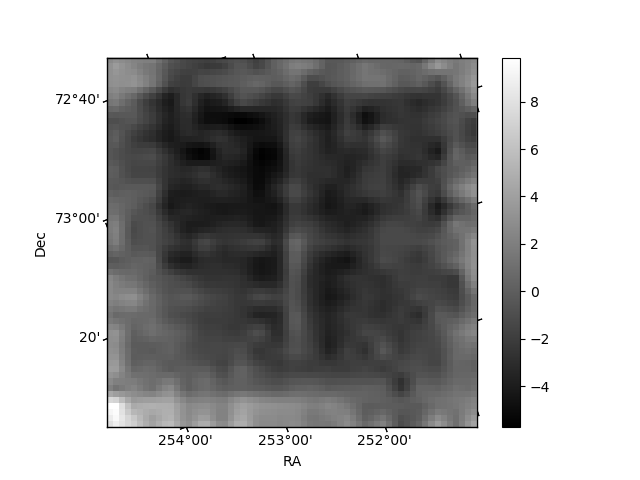
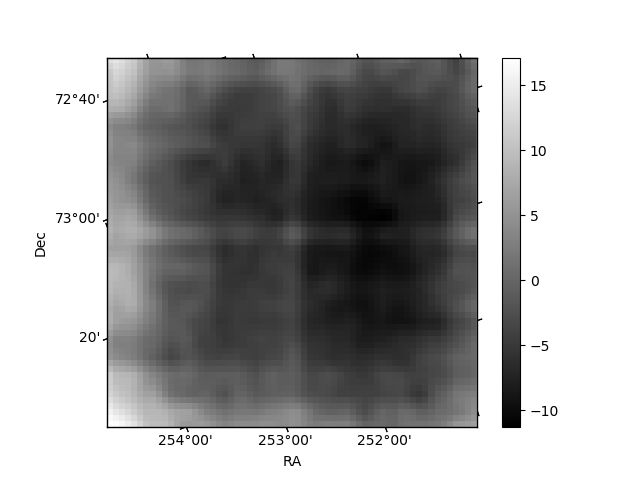
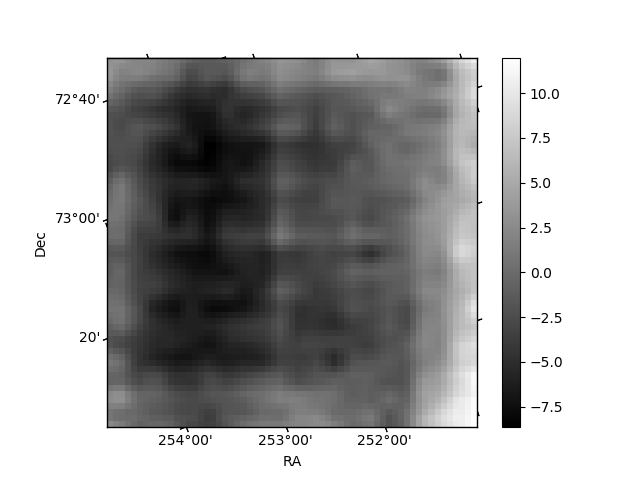
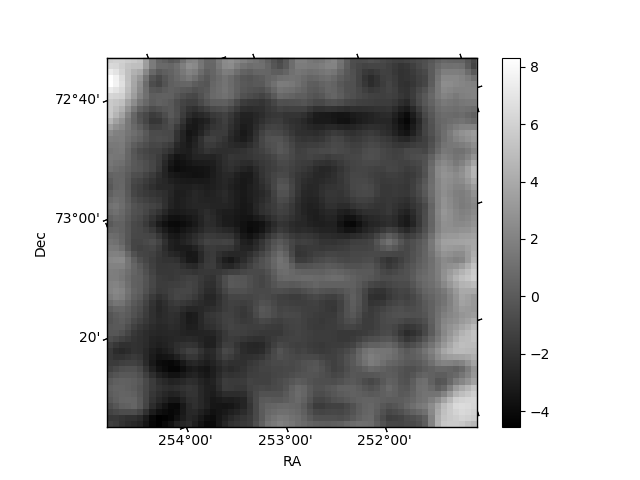
Histogram calculated using DETX and DETY for each event in the final _common_clean file
| Quadrant A | 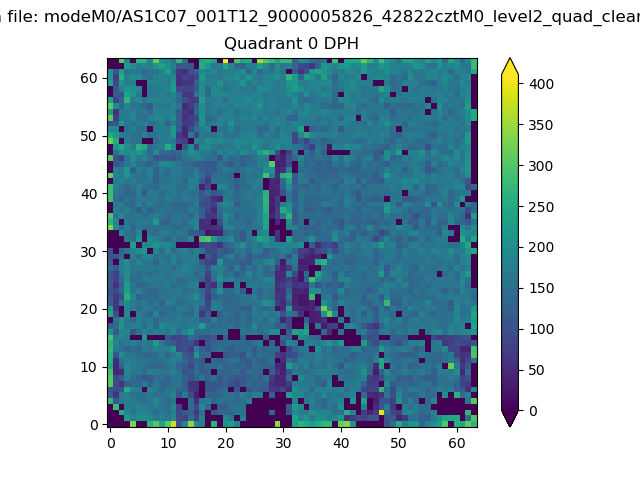 |
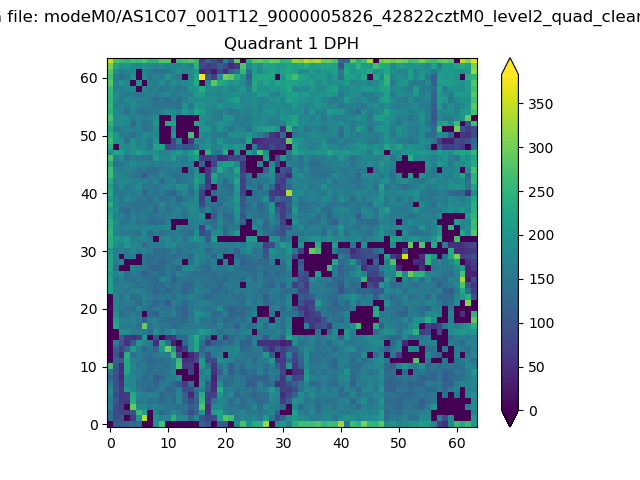 |
Quadrant B |
|---|---|---|---|
| Quadrant D | 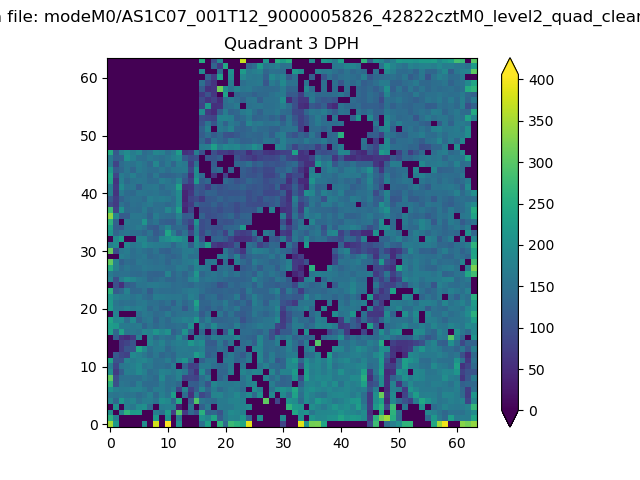 |
 |
Quadrant C |
| Plot type | Count rate plots | Images |
|---|---|---|
| Comparison with Poisson distribution Blue bars denote a histogram of data divided into 1 sec bins. Red curve is a Poisson curve with rate = median count rate of data. |
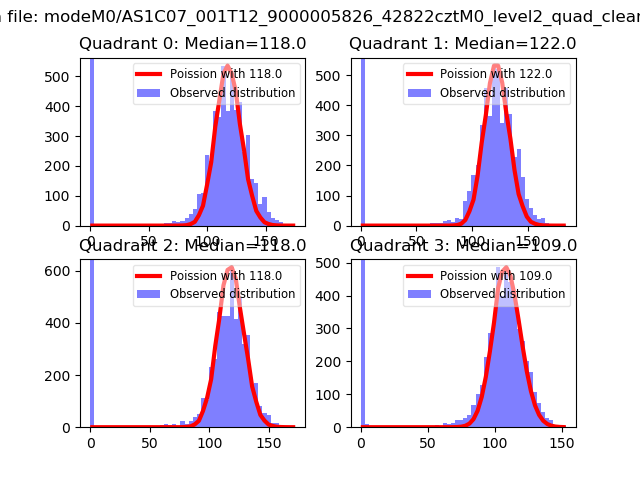 |
 |
| Quadrant-wise count rates Data is divided into 100 sec bins |
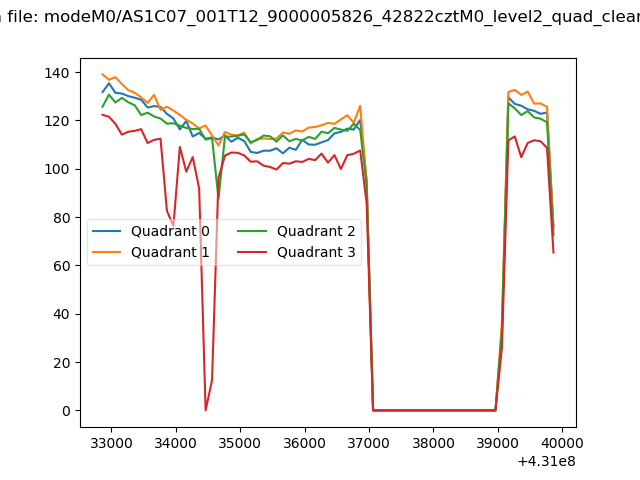 |
|
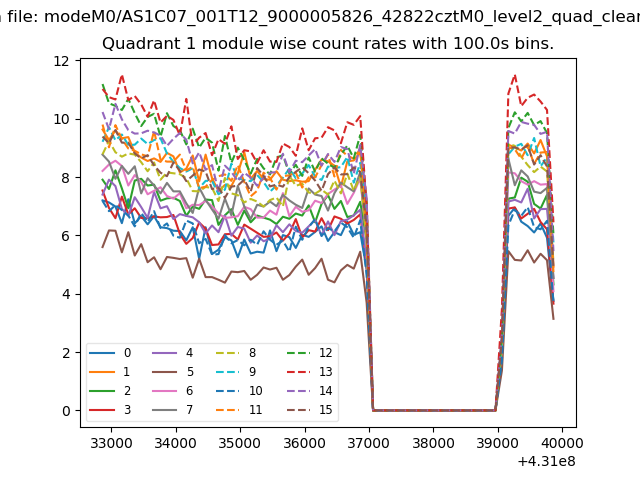
| Module-wise count rates for Quadrant A Data is divided into 100 sec bins |
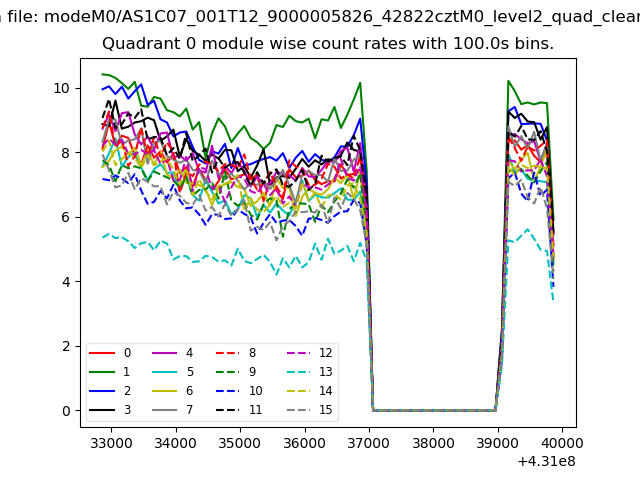 |
 |
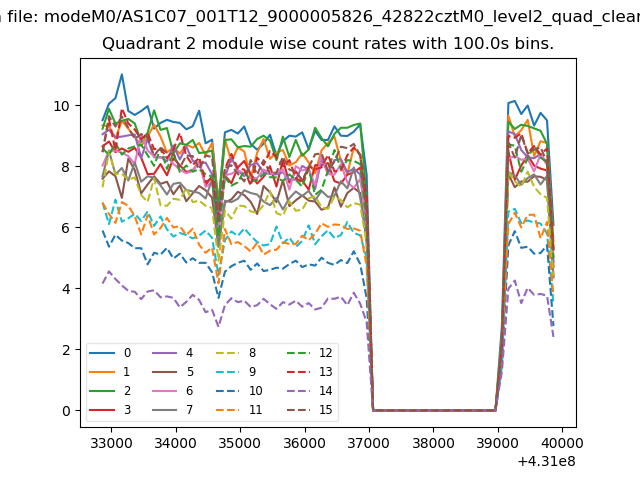
| Module-wise count rates for Quadrant B Data is divided into 100 sec bins |
 |
 |
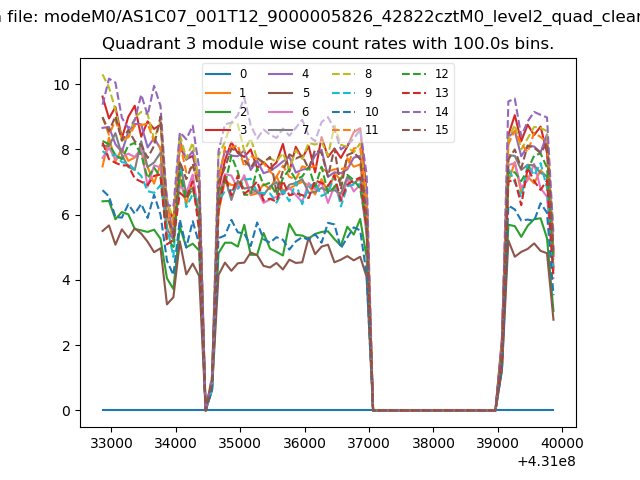
| Module-wise count rates for Quadrant C Data is divided into 100 sec bins |
 |
 |
| Module-wise count rates for Quadrant D Data is divided into 100 sec bins |
 |
 |
| Parameter | Plot |
|---|---|
| CZT HV Monitor | 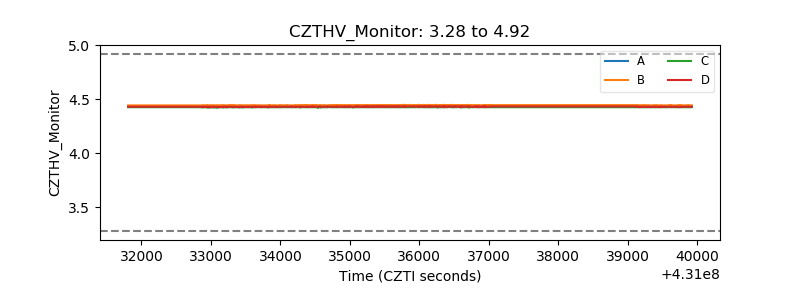 |
| D_VDD | 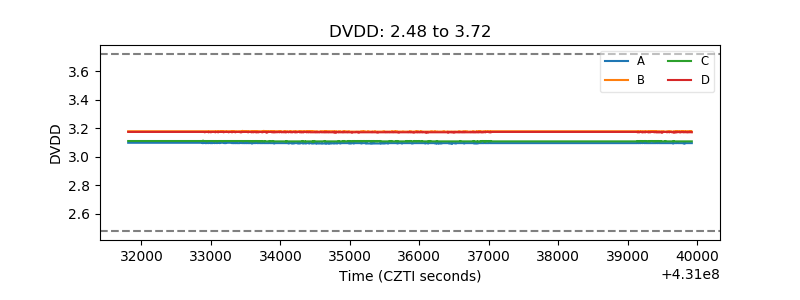 |
| Temperature 1 | 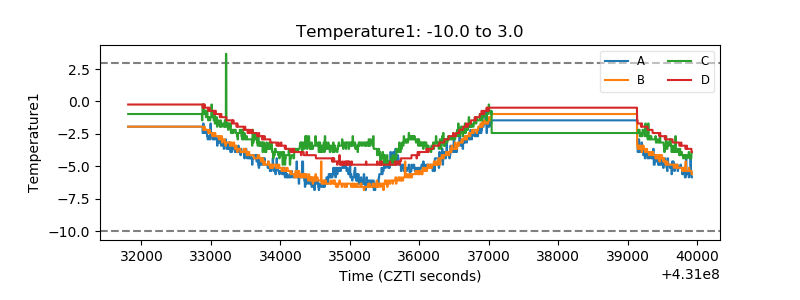 |
| Veto HV Monitor | 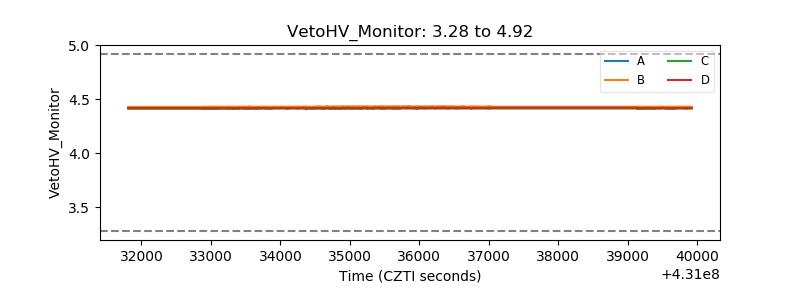 |
| Veto LLD | 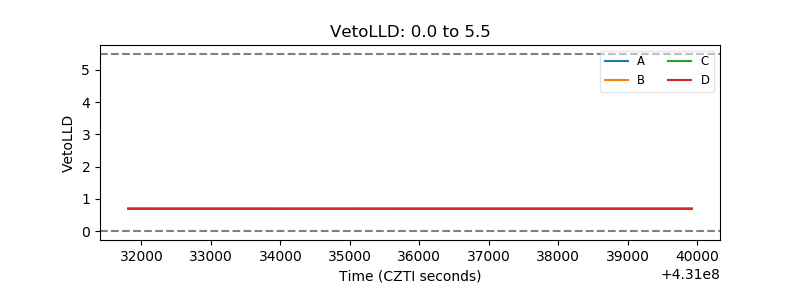 |
| Alpha Counter | 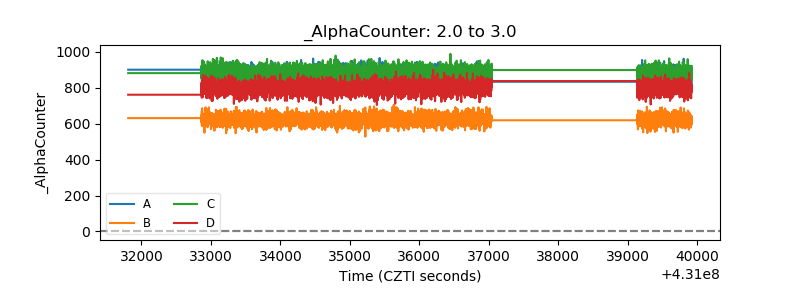 |
| _CPM_Rate | 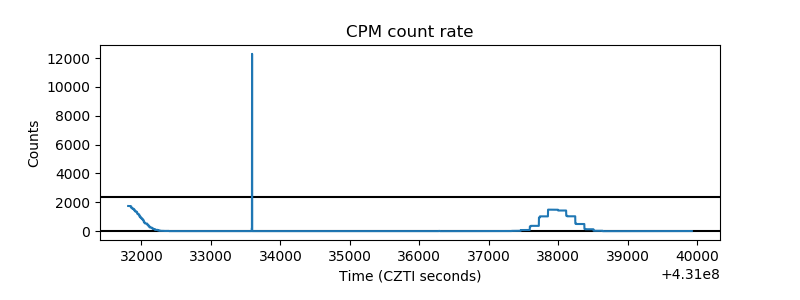 |
| CZT Counter | 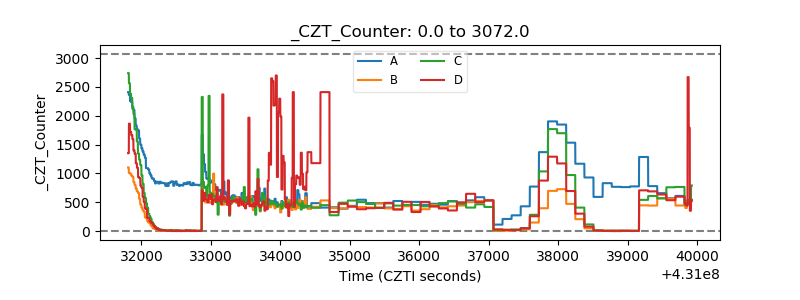 |
| +2.5 Volts monitor | 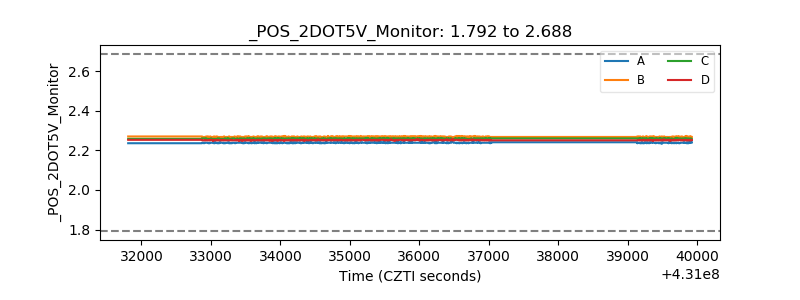 |
| +5 Volts monitor | 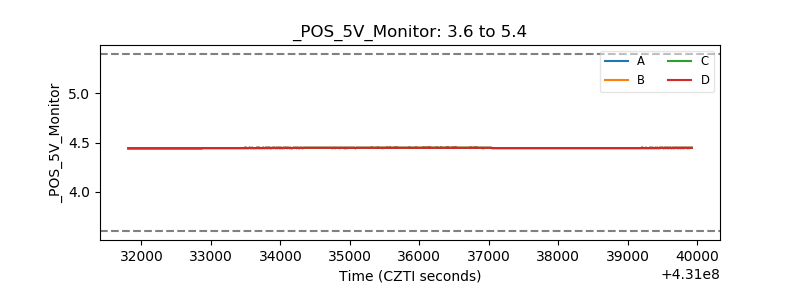 |
| _ROLL_ROT | 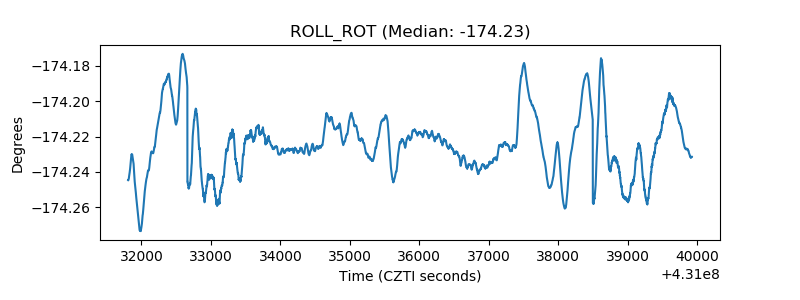 |
| _Roll_DEC | 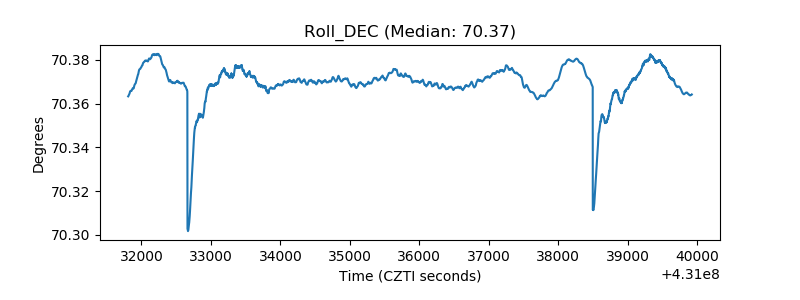 |
| _Roll_RA | 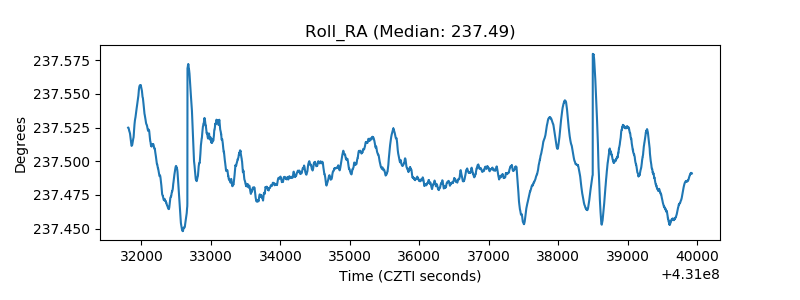 |
| Veto Counter | 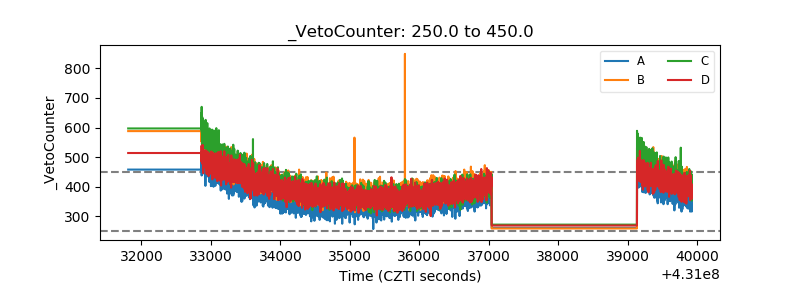 |