| Param | Original file | Final file |
|---|---|---|
| Filename | modeM0/AS1C07_001T12_9000005826_42823cztM0_level2.fits | modeM0/AS1C07_001T12_9000005826_42823cztM0_level2_quad_clean.evt |
| Size (bytes) | 307,416,960 | 83,741,760 |
| Size | 293.2 MB | 79.9 MB |
| Events in quadrant A | 2,695,421 | 559,282 |
| Events in quadrant B | 2,554,336 | 573,699 |
| Events in quadrant C | 2,963,704 | 548,567 |
| Events in quadrant D | 2,783,730 | 510,151 |
| Mode M0 | |||
|---|---|---|---|
| Quadrant | BADHDUFLAG | Total packets | Discarded packets |
| A | 0 | 11052 | 2 |
| B | 0 | 10998 | 2 |
| C | 0 | 11972 | 2 |
| D | 0 | 11925 | 2 |
| Mode SS | |||
|---|---|---|---|
| Quadrant | BADHDUFLAG | Total packets | Discarded packets |
| A | 0 | 100 | 0 |
| B | 0 | 100 | 0 |
| C | 0 | 100 | 0 |
| D | 0 | 100 | 0 |
| Mode M9 | |||
|---|---|---|---|
| Quadrant | BADHDUFLAG | Total packets | Discarded packets |
| A | 0 | 32 | 0 |
| B | 0 | 33 | 0 |
| C | 0 | 33 | 0 |
| D | 0 | 33 | 0 |
| Quadrant | Total seconds | Saturated seconds | Saturation percentage |
|---|---|---|---|
| A | 4905 | 40 | 0.815494% |
| B | 4905 | 99 | 2.018349% |
| C | 4905 | 170 | 3.465851% |
| D | 4905 | 104 | 2.120285% |
Noise dominated data is calculated using 1-second bins in cleaned event files. If a bin has >2000 counts, and if more than 50% of those come from <1% of pixels, then it is considered to be noise-dominated and hence unusable.
| Quadrant | # 1 sec bins | Bins with >0 counts | Bins with >2000 counts | High rate bins dominated by noise | Noise dominated (total time) | Noise dominated (detector-on time) | Marked lightcurve |
|---|---|---|---|---|---|---|---|
| A | 7058 | 4906 | 21 | 21 | 0.30% | 0.43% | 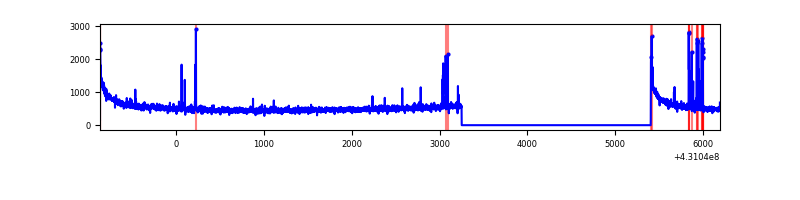 |
| B | 7058 | 4906 | 74 | 74 | 1.05% | 1.51% | 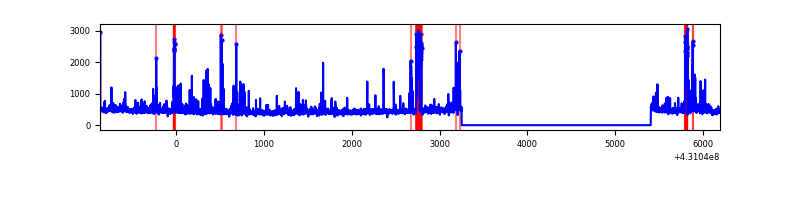 |
| C | 7058 | 4906 | 144 | 144 | 2.04% | 2.94% | 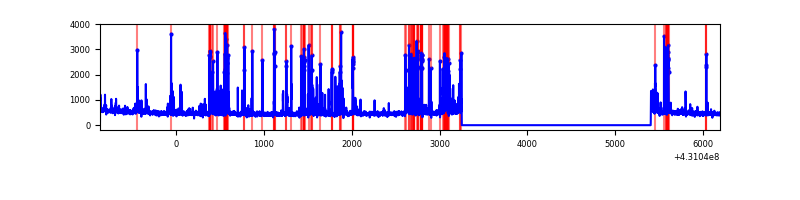 |
| D | 7058 | 4906 | 104 | 104 | 1.47% | 2.12% | 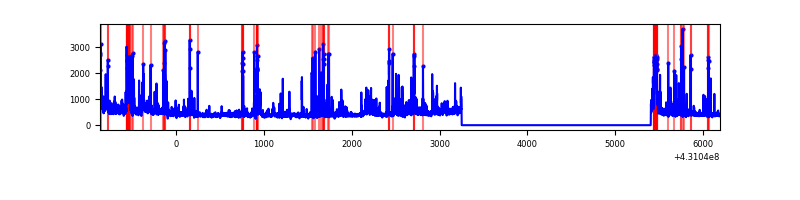 |
Top three noisy pixels from each quadrant. If the there are fewer than three noisy pixels in the level2.evt file, extra rows are filled as -1
| Pixel properties | Quadrant properties | ||||||
|---|---|---|---|---|---|---|---|
| Quadrant | DetID | PixID | Counts | Sigma | Mean | Median | Sigma |
| A | 10 | 83 | 558932 | 5196.96 | 523 | 513 | 107.5 |
| A | 15 | 237 | 78019 | 721.31 | 523 | 513 | 107.5 |
| A | 2 | 79 | 13210 | 118.17 | 523 | 513 | 107.5 |
| B | 5 | 255 | 264622 | 2641.74 | 523 | 508 | 100.0 |
| B | 5 | 172 | 124256 | 1237.76 | 523 | 508 | 100.0 |
| B | 0 | 245 | 52077 | 515.81 | 523 | 508 | 100.0 |
| C | 14 | 254 | 700149 | 5938.2 | 512 | 515 | 117.8 |
| C | 15 | 214 | 195184 | 1652.27 | 512 | 515 | 117.8 |
| C | 3 | 233 | 54444 | 457.73 | 512 | 515 | 117.8 |
| D | 1 | 47 | 230813 | 1877.55 | 511 | 497 | 122.7 |
| D | 5 | 32 | 103532 | 839.95 | 511 | 497 | 122.7 |
| D | 1 | 52 | 89283 | 723.79 | 511 | 497 | 122.7 |
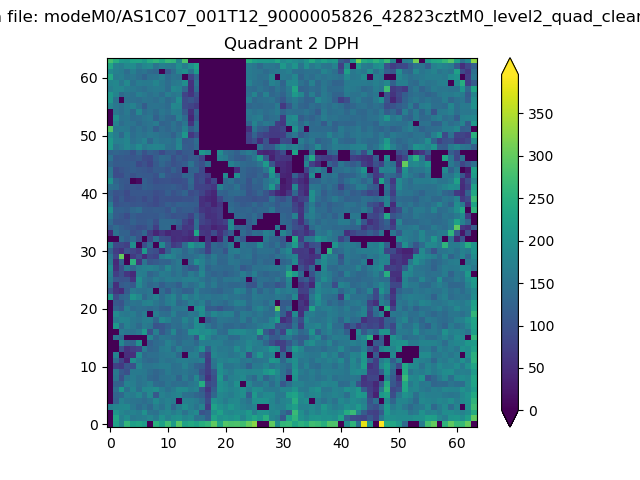
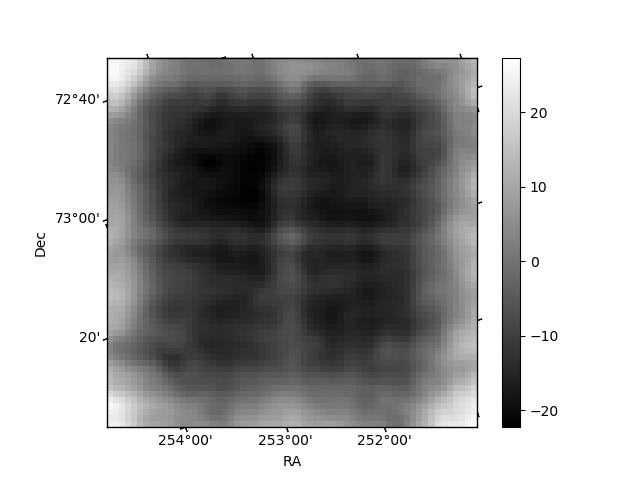
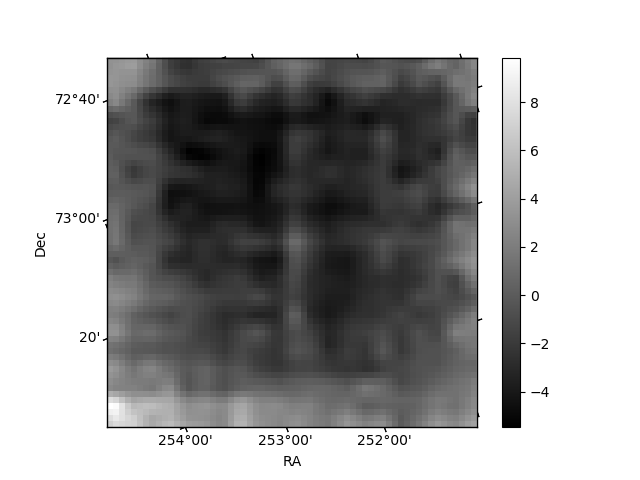
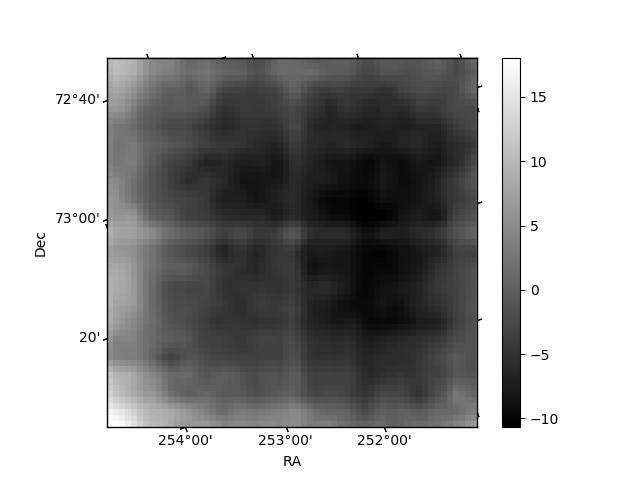
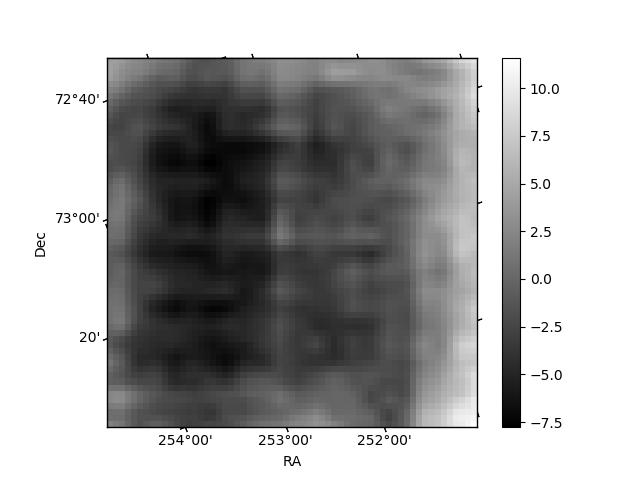
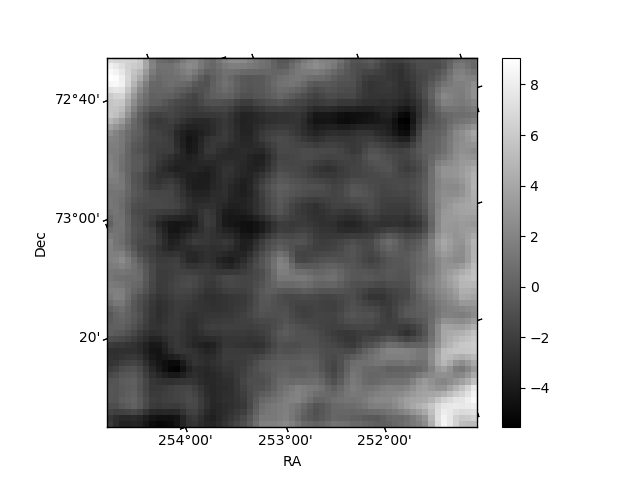
Histogram calculated using DETX and DETY for each event in the final _common_clean file
| Quadrant A | 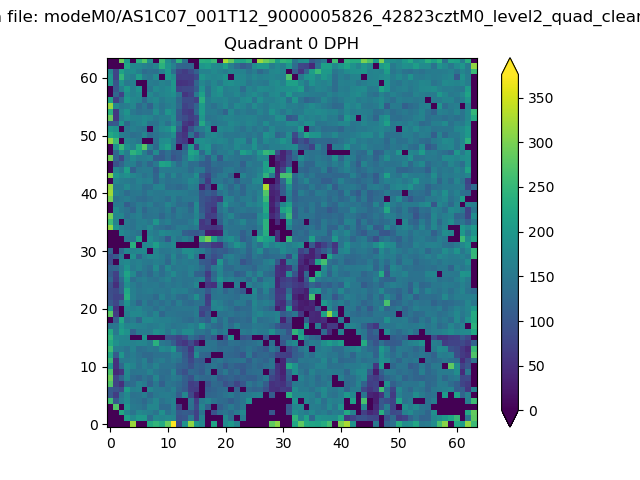 |
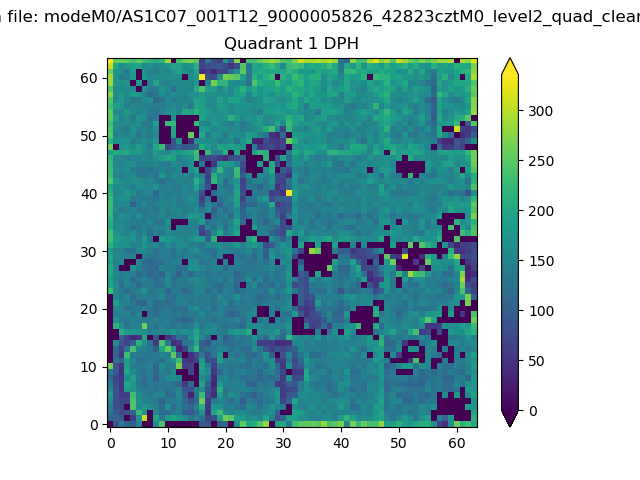 |
Quadrant B |
|---|---|---|---|
| Quadrant D | 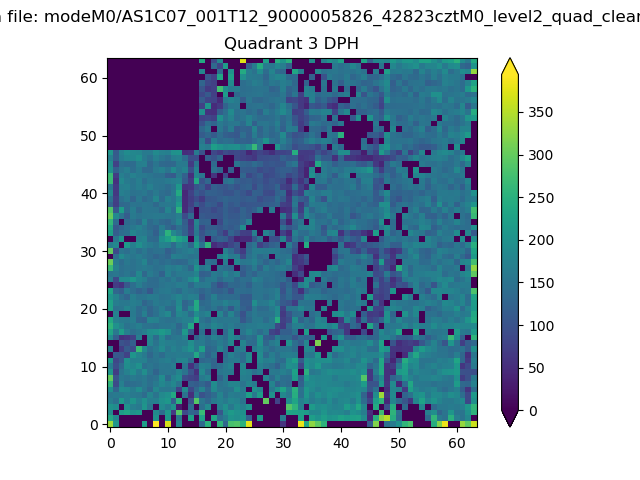 |
 |
Quadrant C |
| Plot type | Count rate plots | Images |
|---|---|---|
| Comparison with Poisson distribution Blue bars denote a histogram of data divided into 1 sec bins. Red curve is a Poisson curve with rate = median count rate of data. |
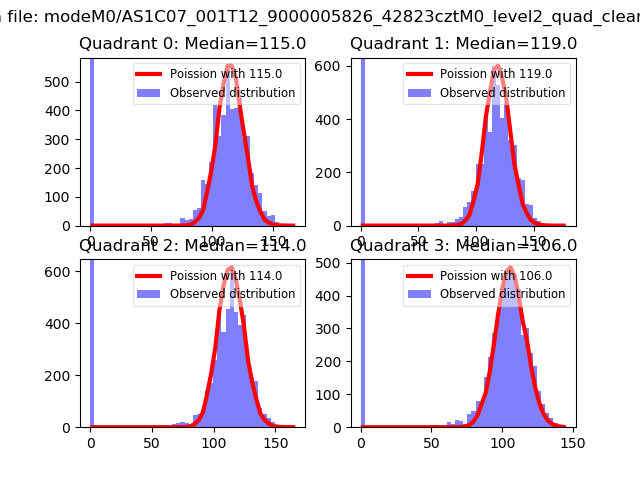 |
 |
| Quadrant-wise count rates Data is divided into 100 sec bins |
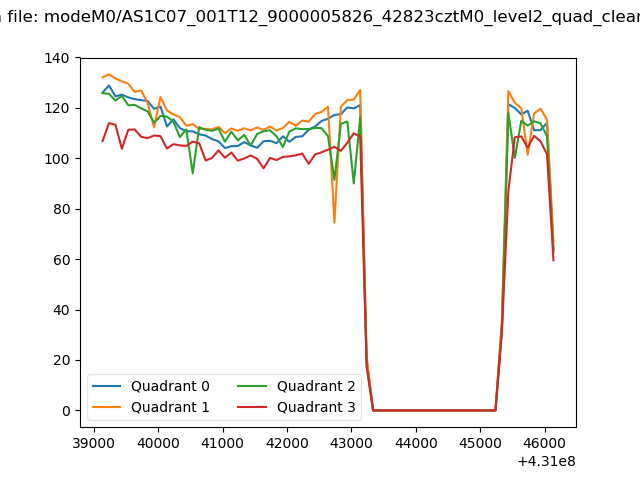 |
|
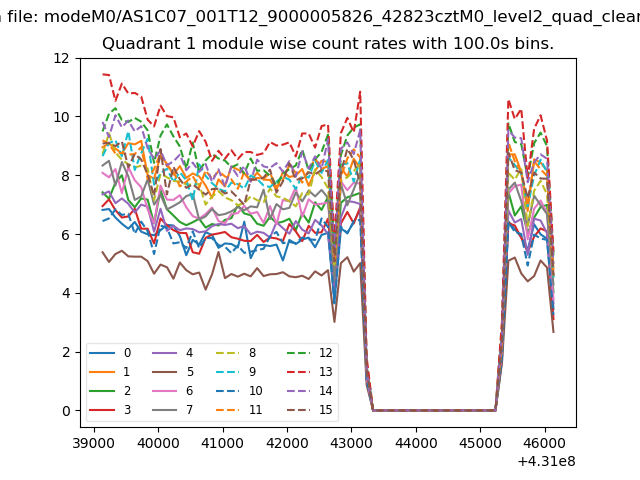
| Module-wise count rates for Quadrant A Data is divided into 100 sec bins |
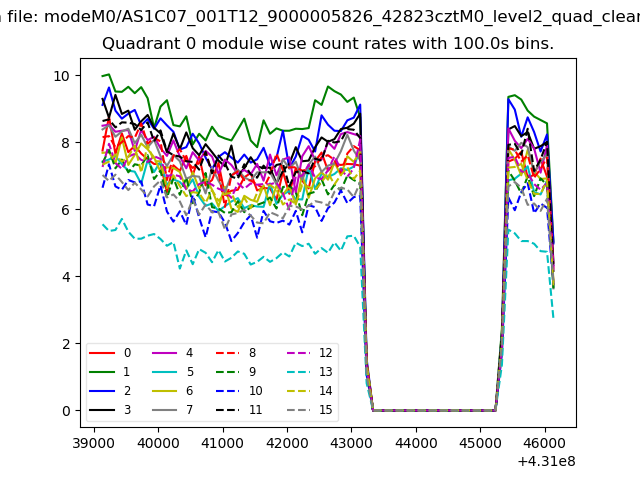 |
 |
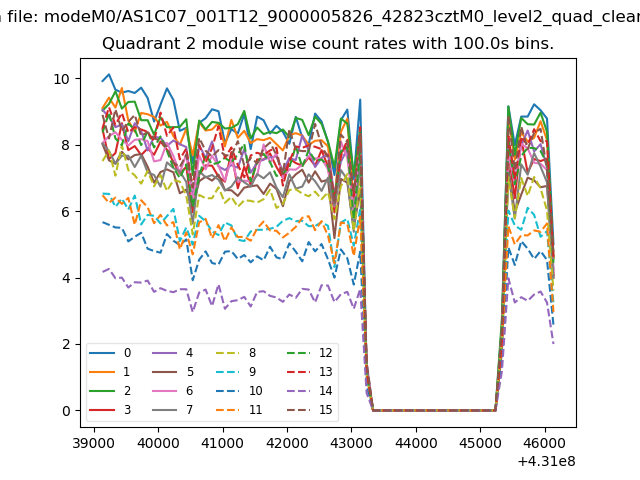
| Module-wise count rates for Quadrant B Data is divided into 100 sec bins |
 |
 |
| Module-wise count rates for Quadrant C Data is divided into 100 sec bins |
 |
 |
| Module-wise count rates for Quadrant D Data is divided into 100 sec bins |
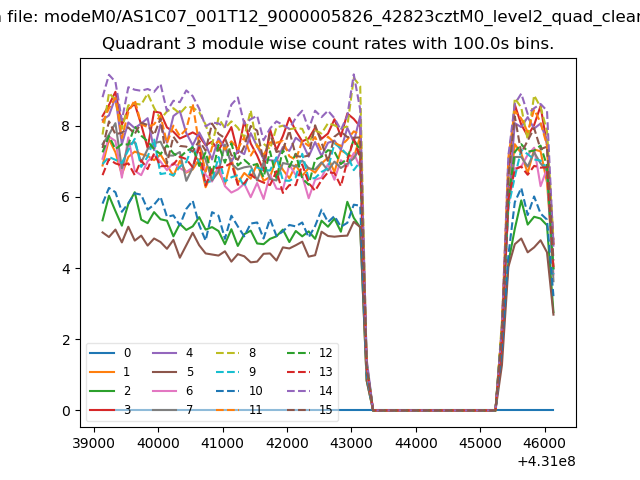 |
 |
| Parameter | Plot |
|---|---|
| CZT HV Monitor | 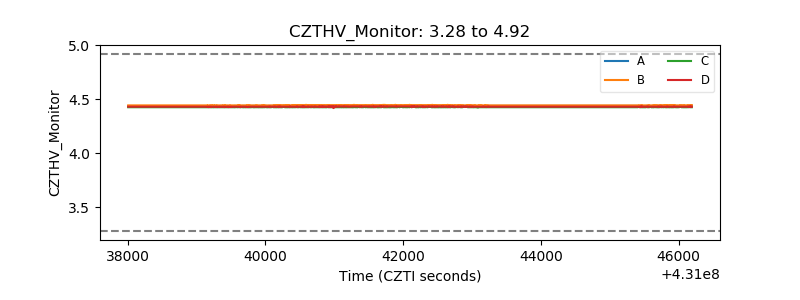 |
| D_VDD | 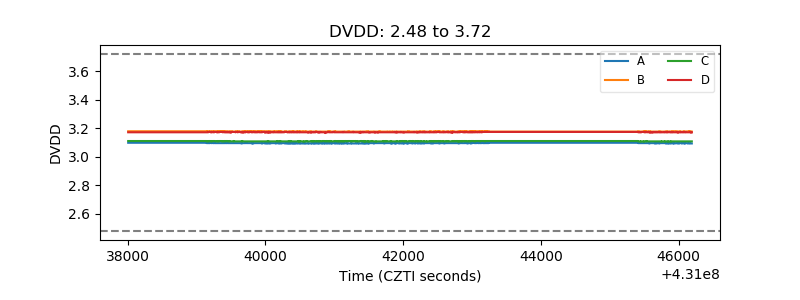 |
| Temperature 1 | 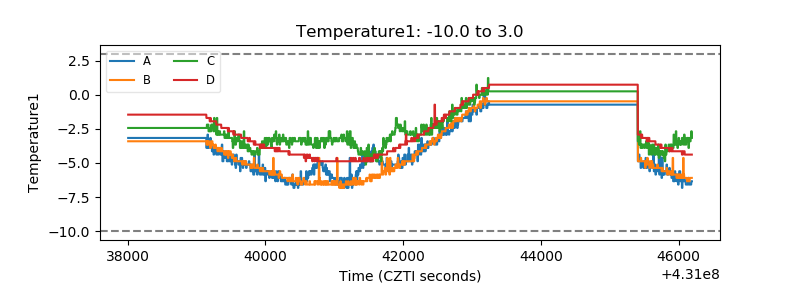 |
| Veto HV Monitor |  |
| Veto LLD | 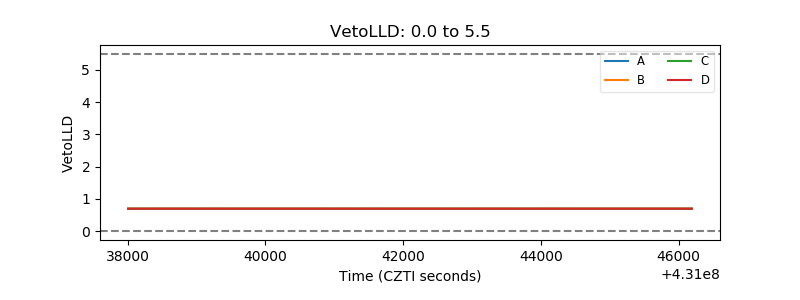 |
| Alpha Counter | 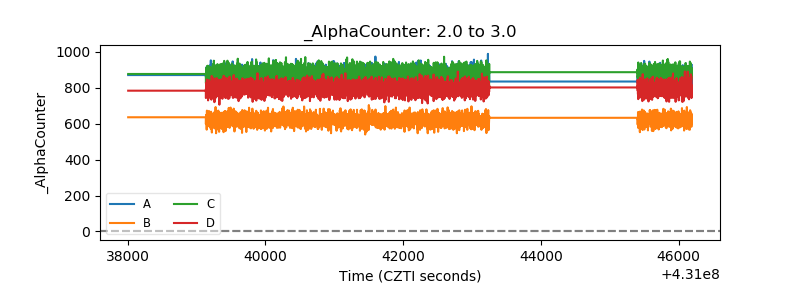 |
| _CPM_Rate | 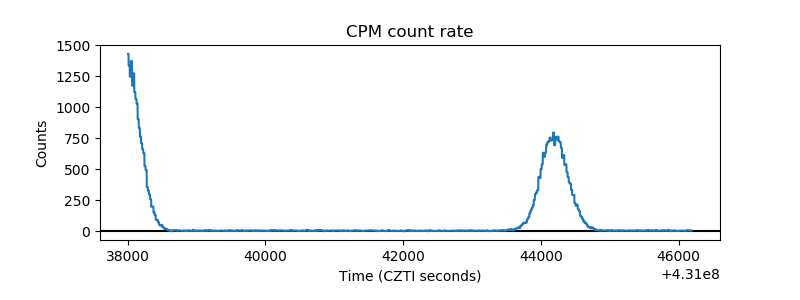 |
| CZT Counter | 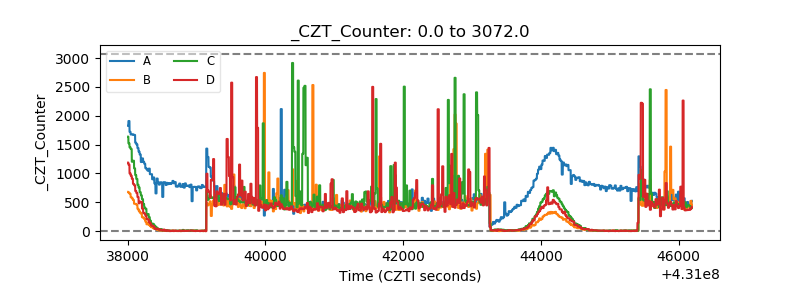 |
| +2.5 Volts monitor | 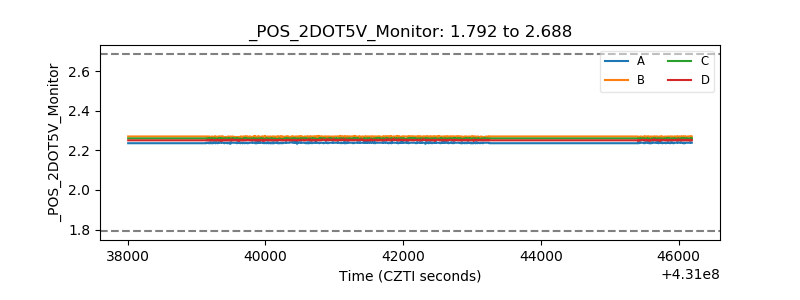 |
| +5 Volts monitor | 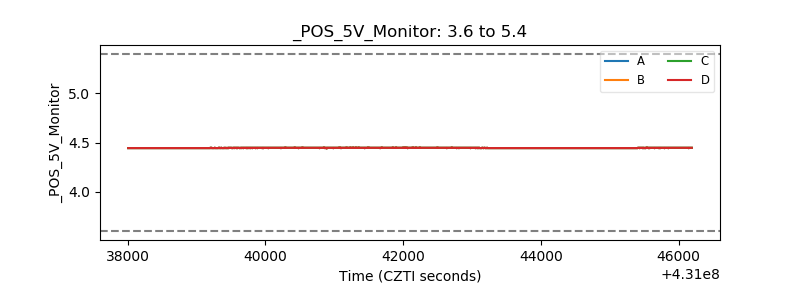 |
| _ROLL_ROT | 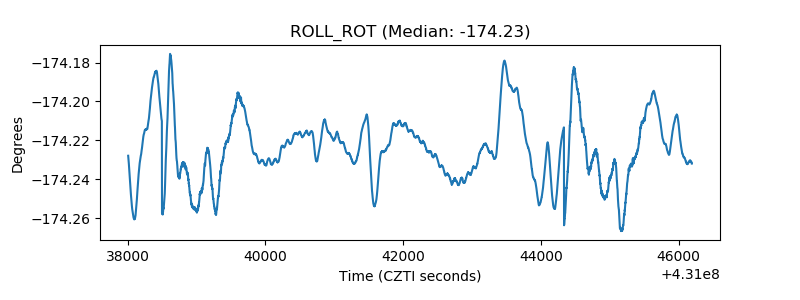 |
| _Roll_DEC | 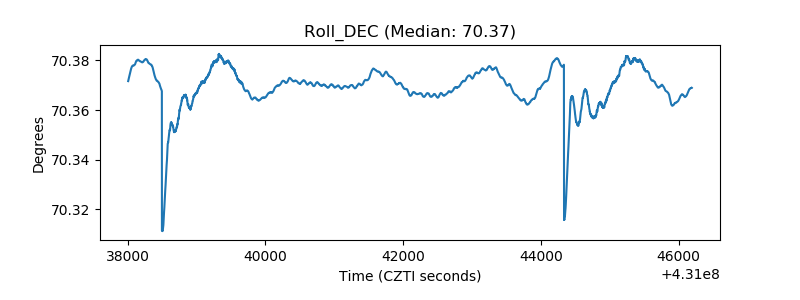 |
| _Roll_RA | 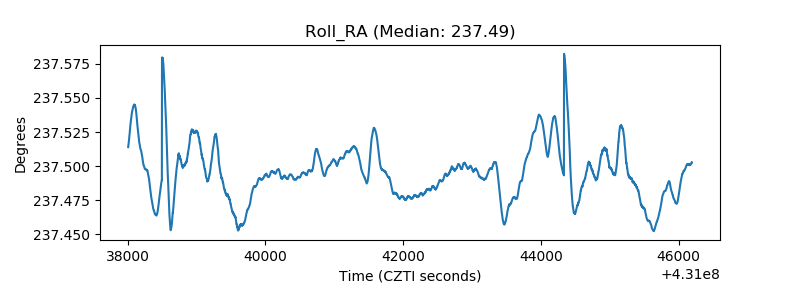 |
| Veto Counter | 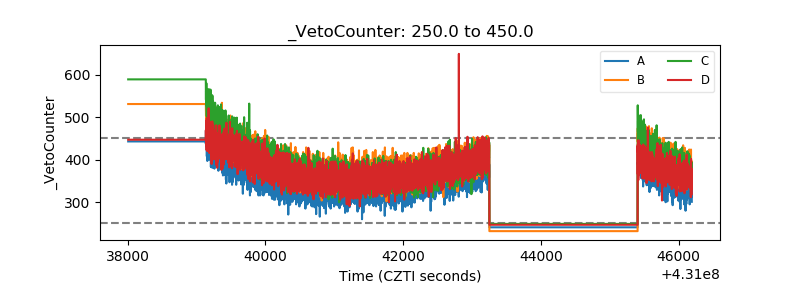 |