| Param | Original file | Final file |
|---|---|---|
| Filename | modeM0/AS1C07_001T12_9000005826_42824cztM0_level2.fits | modeM0/AS1C07_001T12_9000005826_42824cztM0_level2_quad_clean.evt |
| Size (bytes) | 295,047,360 | 81,832,320 |
| Size | 281.4 MB | 78.0 MB |
| Events in quadrant A | 2,680,859 | 543,812 |
| Events in quadrant B | 2,297,682 | 559,922 |
| Events in quadrant C | 2,635,921 | 536,185 |
| Events in quadrant D | 2,923,033 | 492,202 |
| Mode M0 | |||
|---|---|---|---|
| Quadrant | BADHDUFLAG | Total packets | Discarded packets |
| A | 0 | 11026 | 2 |
| B | 0 | 10452 | 2 |
| C | 0 | 11110 | 2 |
| D | 0 | 12426 | 2 |
| Mode SS | |||
|---|---|---|---|
| Quadrant | BADHDUFLAG | Total packets | Discarded packets |
| A | 0 | 102 | 0 |
| B | 0 | 102 | 0 |
| C | 0 | 102 | 0 |
| D | 0 | 102 | 0 |
| Mode M9 | |||
|---|---|---|---|
| Quadrant | BADHDUFLAG | Total packets | Discarded packets |
| A | 0 | 33 | 0 |
| B | 0 | 34 | 0 |
| C | 0 | 34 | 0 |
| D | 0 | 34 | 0 |
| Quadrant | Total seconds | Saturated seconds | Saturation percentage |
|---|---|---|---|
| A | 4925 | 39 | 0.791878% |
| B | 4925 | 39 | 0.791878% |
| C | 4925 | 71 | 1.441624% |
| D | 4925 | 158 | 3.208122% |
Noise dominated data is calculated using 1-second bins in cleaned event files. If a bin has >2000 counts, and if more than 50% of those come from <1% of pixels, then it is considered to be noise-dominated and hence unusable.
| Quadrant | # 1 sec bins | Bins with >0 counts | Bins with >2000 counts | High rate bins dominated by noise | Noise dominated (total time) | Noise dominated (detector-on time) | Marked lightcurve |
|---|---|---|---|---|---|---|---|
| A | 7017 | 4926 | 28 | 28 | 0.40% | 0.57% | 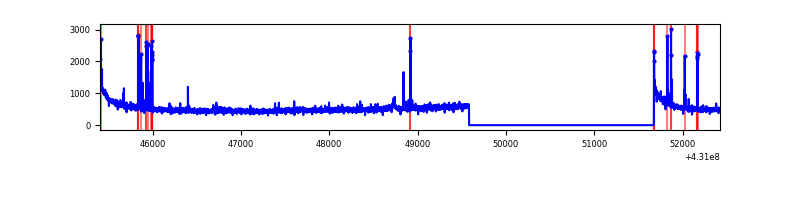 |
| B | 7017 | 4926 | 31 | 31 | 0.44% | 0.63% | 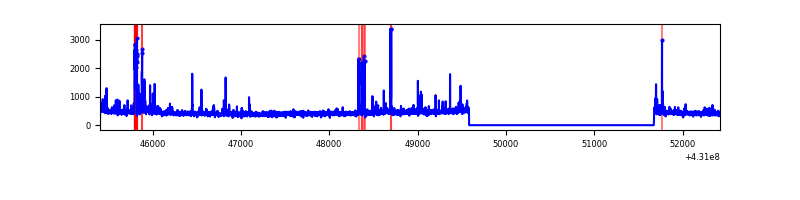 |
| C | 7017 | 4926 | 64 | 64 | 0.91% | 1.30% | 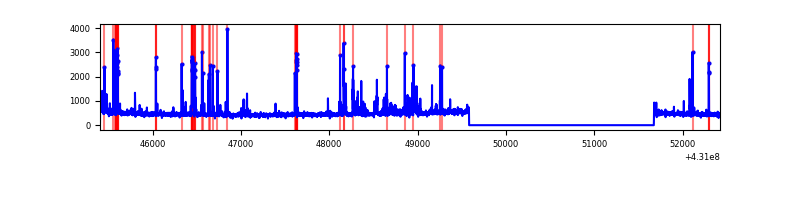 |
| D | 7017 | 4926 | 155 | 155 | 2.21% | 3.15% | 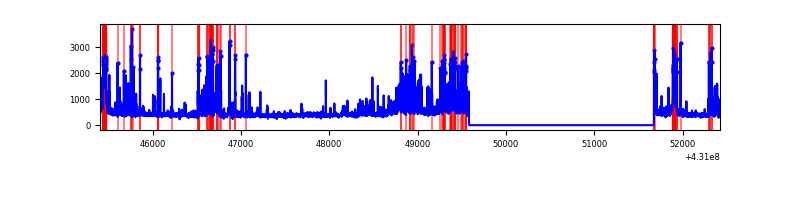 |
Top three noisy pixels from each quadrant. If the there are fewer than three noisy pixels in the level2.evt file, extra rows are filled as -1
| Pixel properties | Quadrant properties | ||||||
|---|---|---|---|---|---|---|---|
| Quadrant | DetID | PixID | Counts | Sigma | Mean | Median | Sigma |
| A | 10 | 83 | 557773 | 5232.21 | 517 | 506 | 106.5 |
| A | 15 | 237 | 70174 | 654.12 | 517 | 506 | 106.5 |
| A | 13 | 248 | 25685 | 236.41 | 517 | 506 | 106.5 |
| B | 5 | 255 | 131364 | 1314.69 | 519 | 504 | 99.5 |
| B | 5 | 172 | 40887 | 405.71 | 519 | 504 | 99.5 |
| B | 0 | 245 | 38426 | 380.99 | 519 | 504 | 99.5 |
| C | 14 | 254 | 382519 | 3219.02 | 505 | 508 | 118.7 |
| C | 15 | 214 | 198256 | 1666.33 | 505 | 508 | 118.7 |
| C | 12 | 249 | 32956 | 273.42 | 505 | 508 | 118.7 |
| D | 1 | 47 | 377269 | 3092.05 | 499 | 485 | 121.9 |
| D | 2 | 249 | 129208 | 1056.36 | 499 | 485 | 121.9 |
| D | 5 | 70 | 108302 | 884.79 | 499 | 485 | 121.9 |
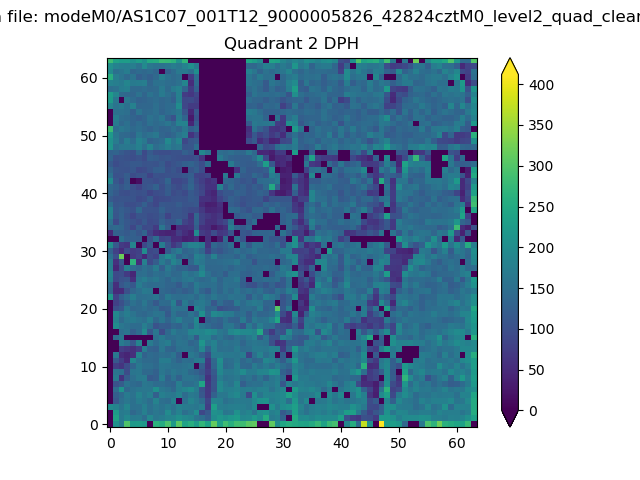
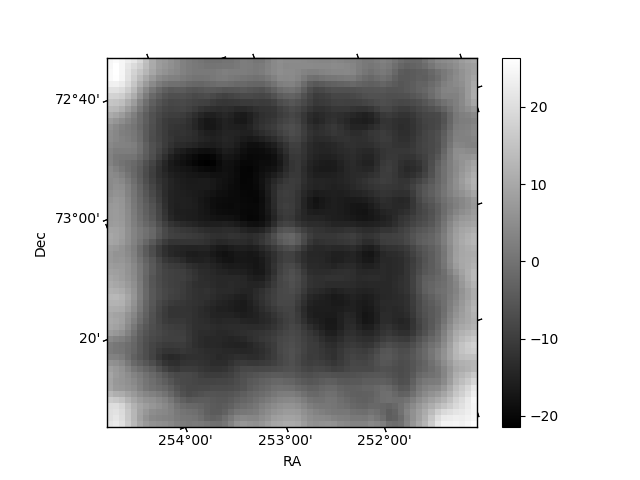
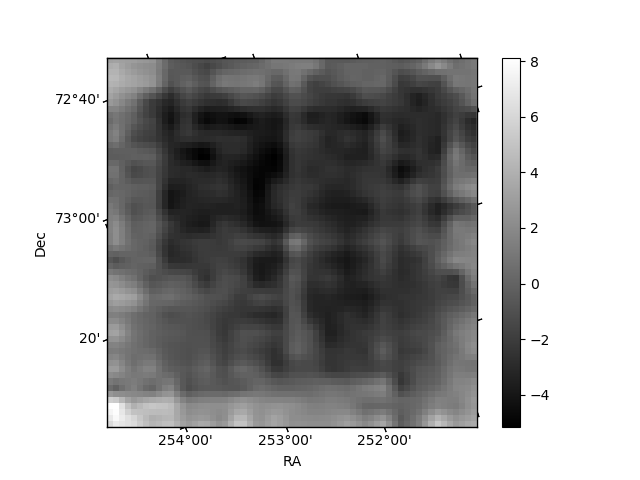
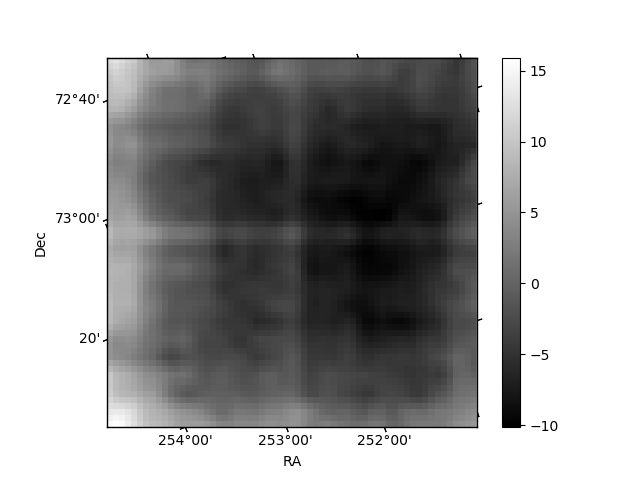
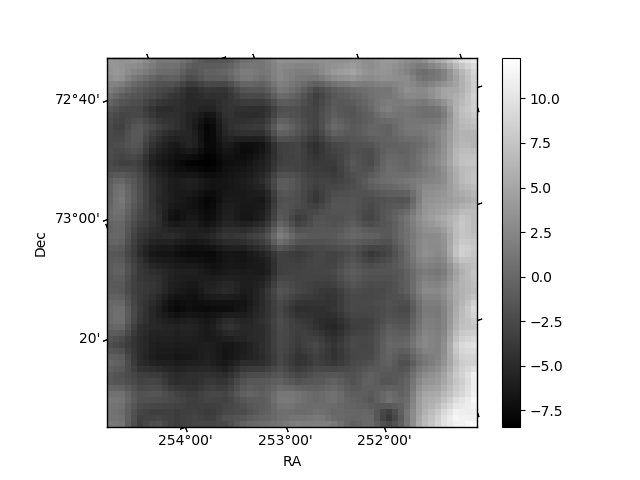
Histogram calculated using DETX and DETY for each event in the final _common_clean file
| Quadrant A | 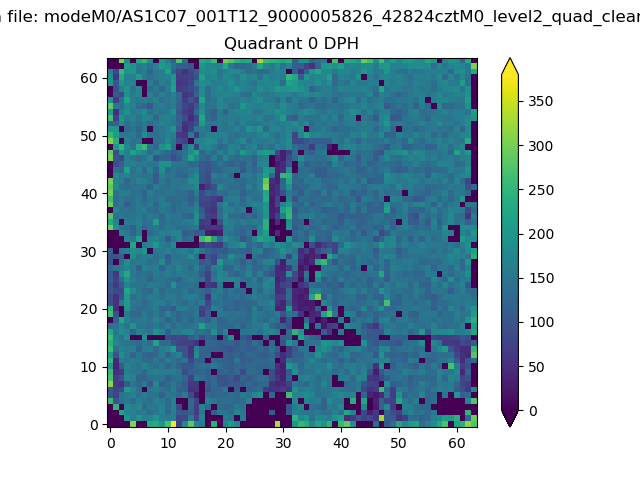 |
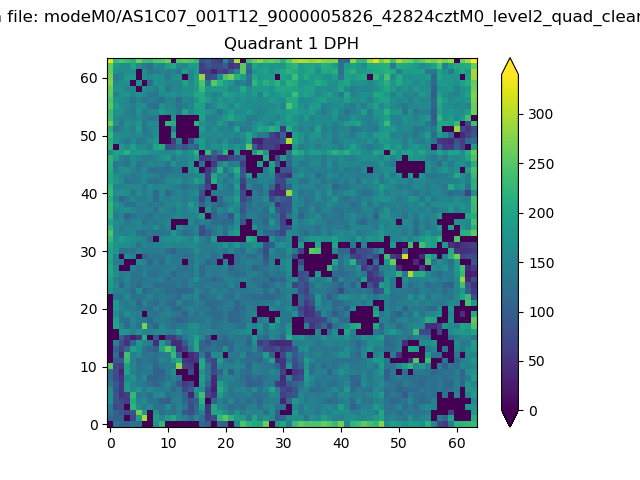 |
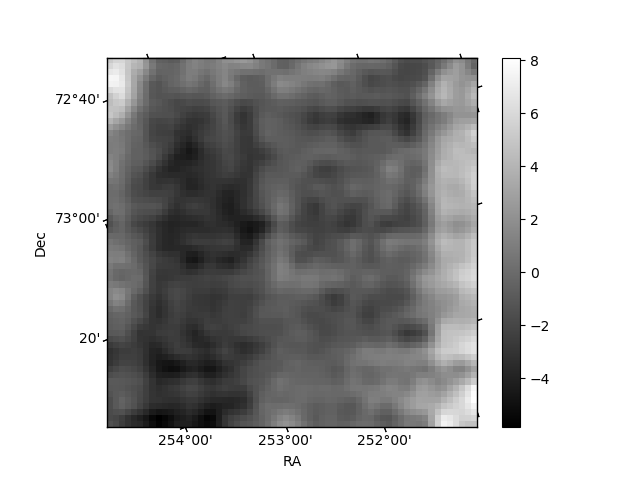
Quadrant B |
|---|---|---|---|
| Quadrant D | 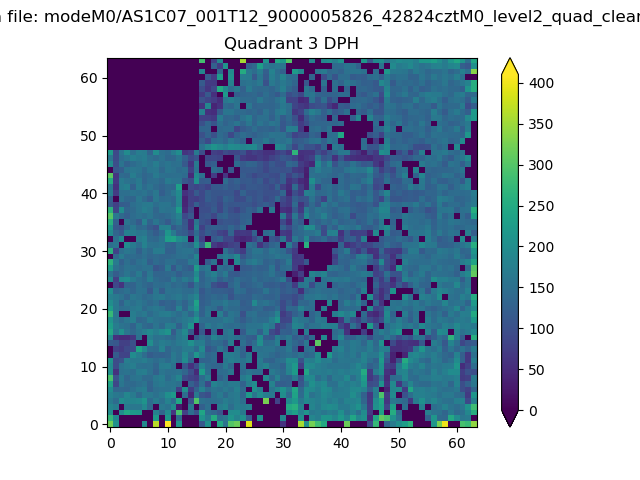 |
 |
Quadrant C |
| Plot type | Count rate plots | Images |
|---|---|---|
| Comparison with Poisson distribution Blue bars denote a histogram of data divided into 1 sec bins. Red curve is a Poisson curve with rate = median count rate of data. |
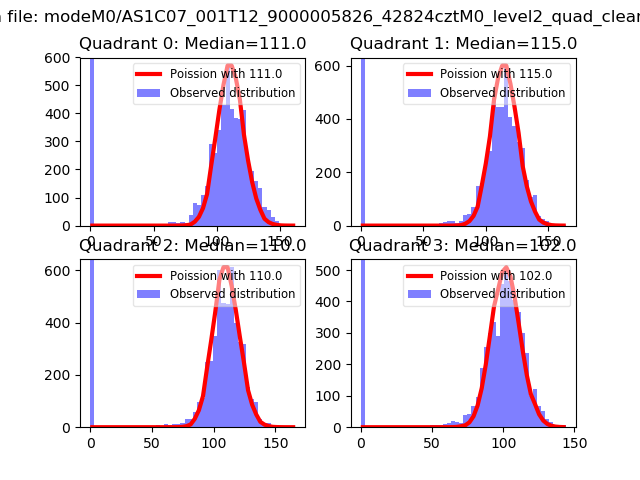 |
 |
| Quadrant-wise count rates Data is divided into 100 sec bins |
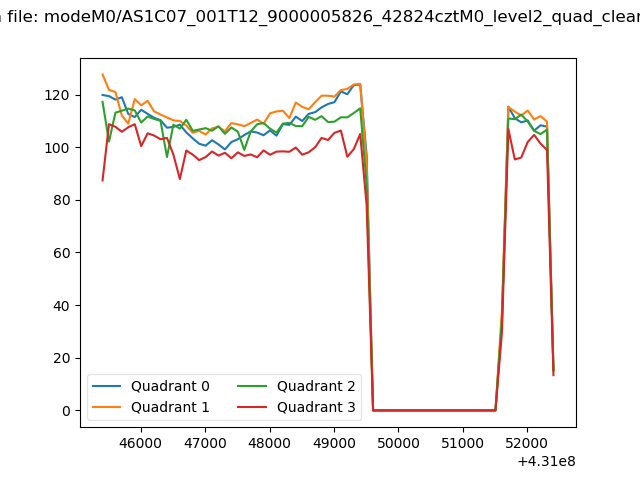 |
|
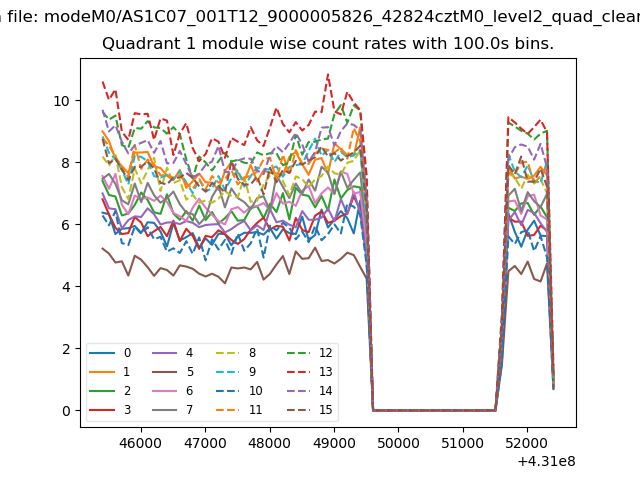
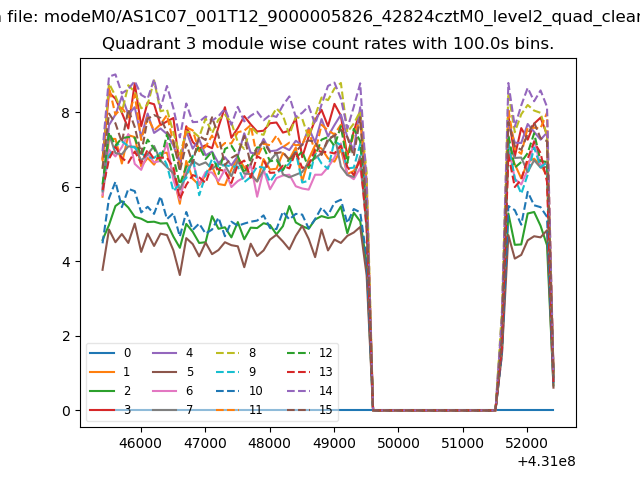
| Module-wise count rates for Quadrant A Data is divided into 100 sec bins |
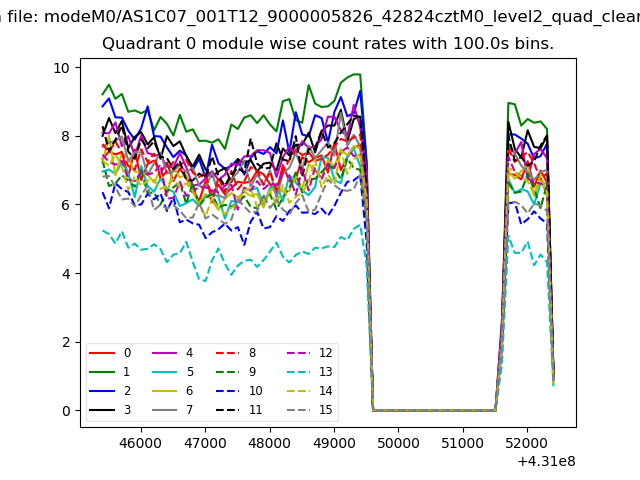 |
 |
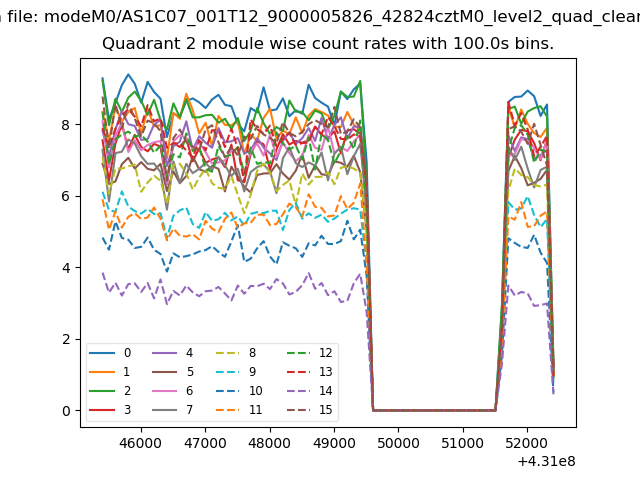
| Module-wise count rates for Quadrant B Data is divided into 100 sec bins |
 |
 |
| Module-wise count rates for Quadrant C Data is divided into 100 sec bins |
 |
 |
| Module-wise count rates for Quadrant D Data is divided into 100 sec bins |
 |
 |
| Parameter | Plot |
|---|---|
| CZT HV Monitor | 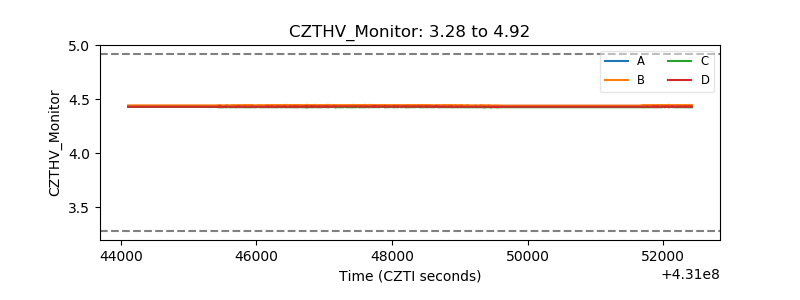 |
| D_VDD | 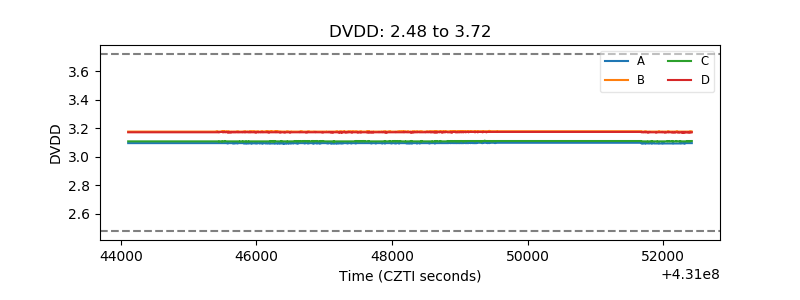 |
| Temperature 1 | 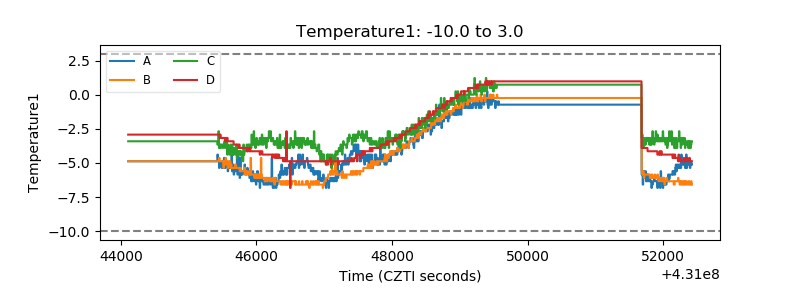 |
| Veto HV Monitor | 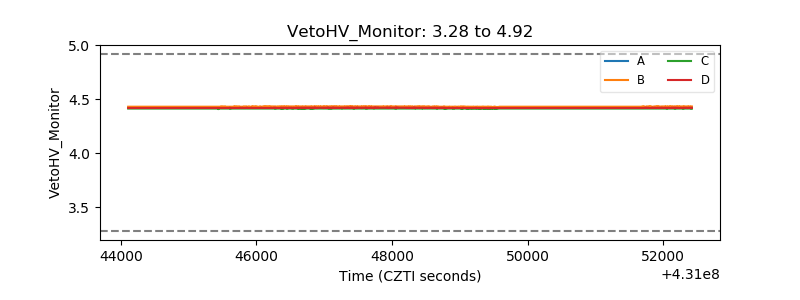 |
| Veto LLD | 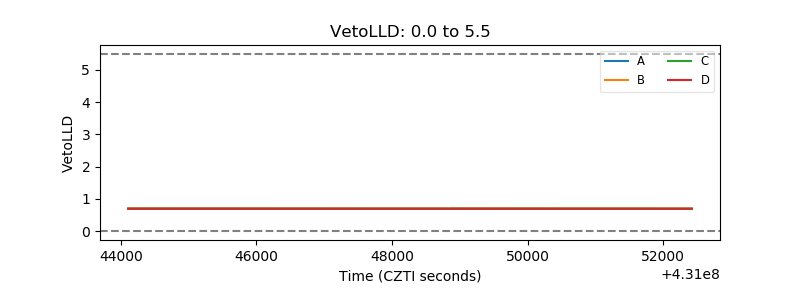 |
| Alpha Counter | 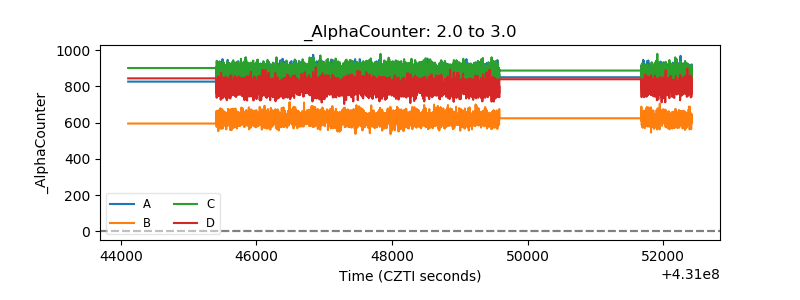 |
| _CPM_Rate | 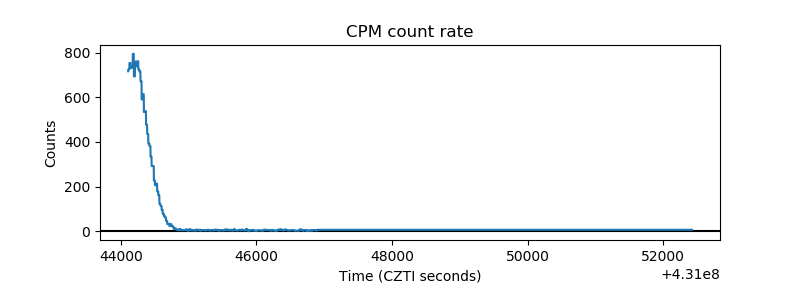 |
| CZT Counter | 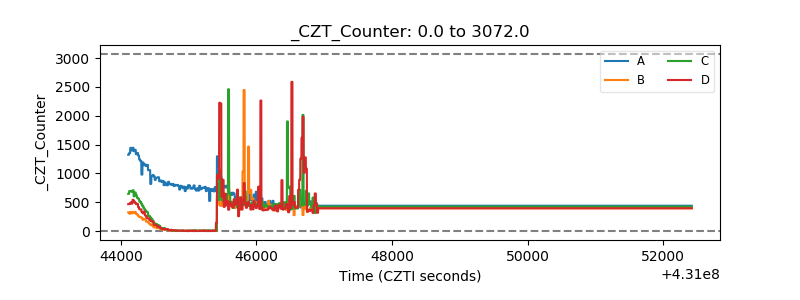 |
| +2.5 Volts monitor | 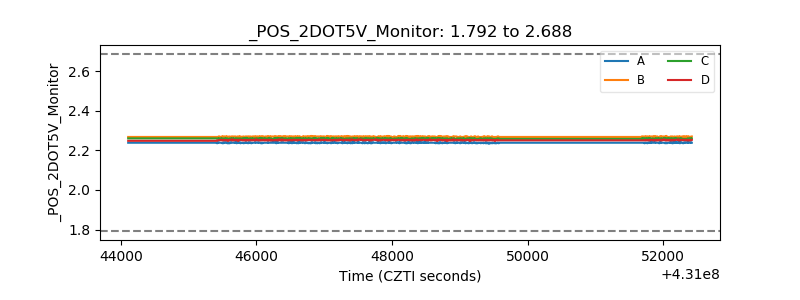 |
| +5 Volts monitor | 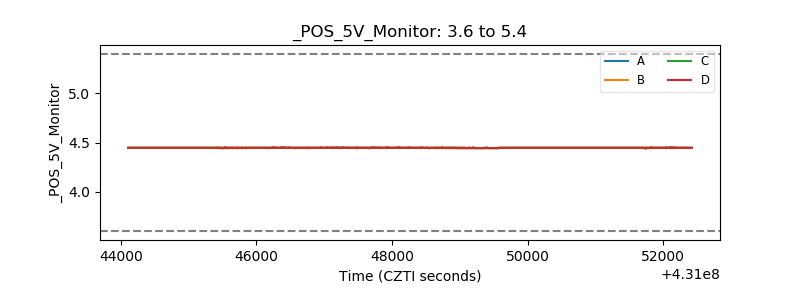 |
| _ROLL_ROT | 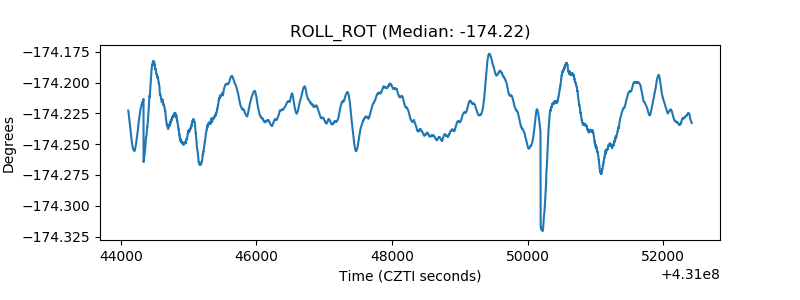 |
| _Roll_DEC | 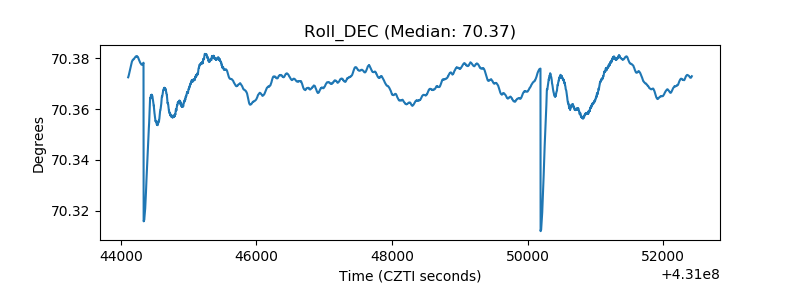 |
| _Roll_RA | 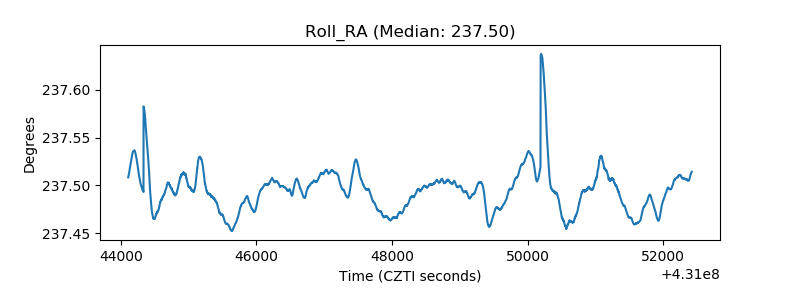 |
| Veto Counter | 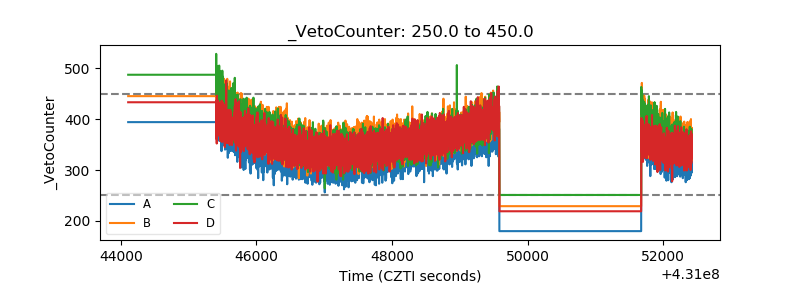 |