| Param | Original file | Final file |
|---|---|---|
| Filename | modeM0/AS1T05_138T01_9000005828_42827cztM0_level2.fits | modeM0/AS1T05_138T01_9000005828_42827cztM0_level2_quad_clean.evt |
| Size (bytes) | 343,846,080 | 95,423,040 |
| Size | 327.9 MB | 91.0 MB |
| Events in quadrant A | 3,460,374 | 618,855 |
| Events in quadrant B | 2,763,910 | 646,095 |
| Events in quadrant C | 2,889,418 | 641,496 |
| Events in quadrant D | 3,156,392 | 571,493 |
| Mode M0 | |||
|---|---|---|---|
| Quadrant | BADHDUFLAG | Total packets | Discarded packets |
| A | 0 | 13740 | 2 |
| B | 0 | 12405 | 2 |
| C | 0 | 12234 | 3 |
| D | 0 | 13550 | 2 |
| Mode M9 | |||
|---|---|---|---|
| Quadrant | BADHDUFLAG | Total packets | Discarded packets |
| A | 0 | 18 | 0 |
| B | 0 | 19 | 0 |
| C | 0 | 19 | 0 |
| D | 0 | 19 | 0 |
| Mode SS | |||
|---|---|---|---|
| Quadrant | BADHDUFLAG | Total packets | Discarded packets |
| A | 0 | 122 | 0 |
| B | 0 | 122 | 0 |
| C | 0 | 122 | 0 |
| D | 0 | 122 | 0 |
| Quadrant | Total seconds | Saturated seconds | Saturation percentage |
|---|---|---|---|
| A | 5878 | 55 | 0.935692% |
| B | 5878 | 42 | 0.714529% |
| C | 5877 | 15 | 0.255232% |
| D | 5877 | 124 | 2.109920% |
Noise dominated data is calculated using 1-second bins in cleaned event files. If a bin has >2000 counts, and if more than 50% of those come from <1% of pixels, then it is considered to be noise-dominated and hence unusable.
| Quadrant | # 1 sec bins | Bins with >0 counts | Bins with >2000 counts | High rate bins dominated by noise | Noise dominated (total time) | Noise dominated (detector-on time) | Marked lightcurve |
|---|---|---|---|---|---|---|---|
| A | 7223 | 5880 | 34 | 34 | 0.47% | 0.58% | 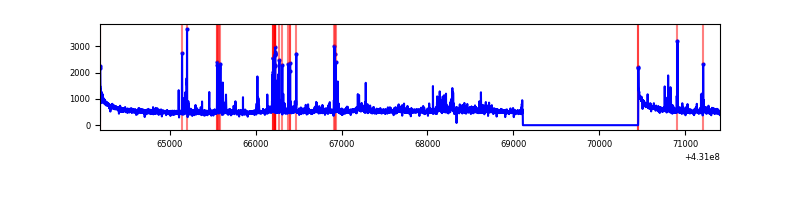 |
| B | 7223 | 5880 | 33 | 33 | 0.46% | 0.56% | 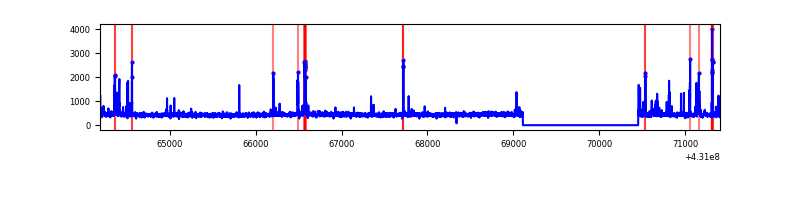 |
| C | 7222 | 5879 | 12 | 12 | 0.17% | 0.20% | 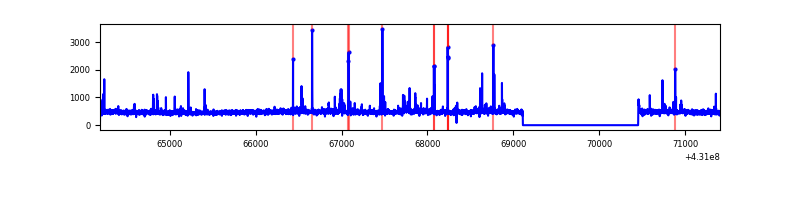 |
| D | 7222 | 5879 | 113 | 113 | 1.56% | 1.92% | 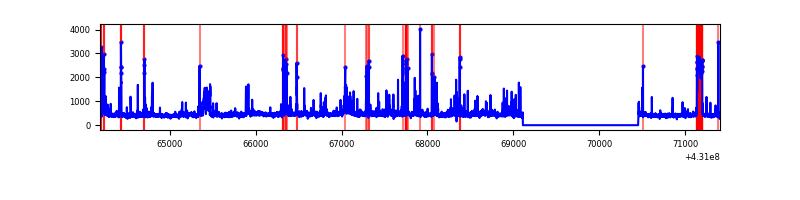 |
Top three noisy pixels from each quadrant. If the there are fewer than three noisy pixels in the level2.evt file, extra rows are filled as -1
| Pixel properties | Quadrant properties | ||||||
|---|---|---|---|---|---|---|---|
| Quadrant | DetID | PixID | Counts | Sigma | Mean | Median | Sigma |
| A | 10 | 83 | 632624 | 4736.47 | 636 | 621 | 133.4 |
| A | 12 | 189 | 115859 | 863.63 | 636 | 621 | 133.4 |
| A | 13 | 248 | 110883 | 826.34 | 636 | 621 | 133.4 |
| B | 5 | 255 | 174915 | 1397.66 | 636 | 616 | 124.7 |
| B | 0 | 190 | 60360 | 479.07 | 636 | 616 | 124.7 |
| B | 0 | 245 | 16460 | 127.05 | 636 | 616 | 124.7 |
| C | 15 | 214 | 240834 | 1607.6 | 631 | 634 | 149.4 |
| C | 14 | 254 | 159285 | 1061.81 | 631 | 634 | 149.4 |
| C | 3 | 233 | 20685 | 134.2 | 631 | 634 | 149.4 |
| D | 1 | 47 | 169024 | 1122.24 | 620 | 604 | 150.1 |
| D | 13 | 249 | 164120 | 1089.56 | 620 | 604 | 150.1 |
| D | 12 | 233 | 119744 | 793.87 | 620 | 604 | 150.1 |
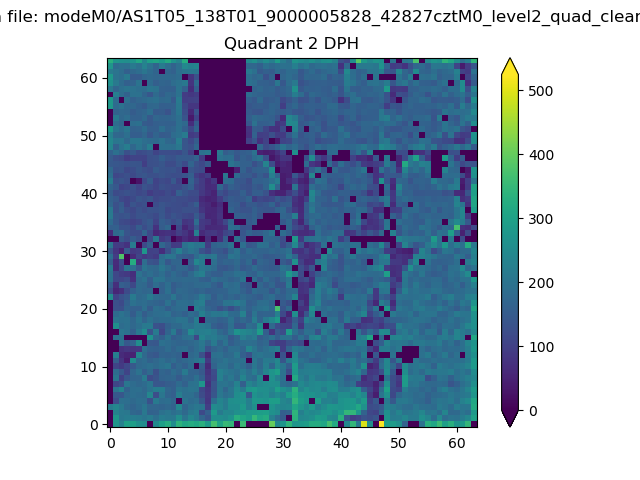
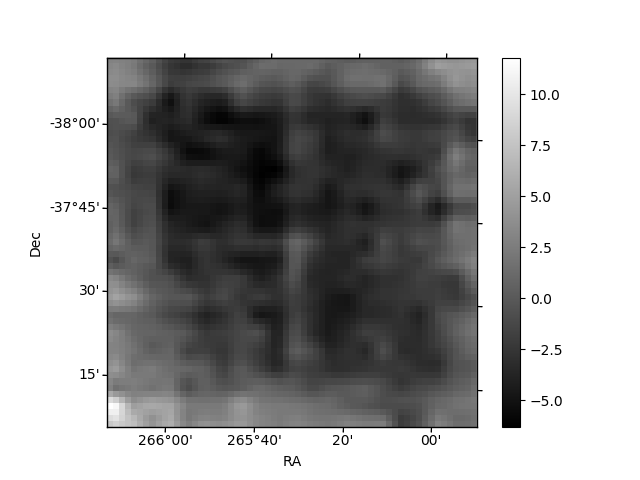
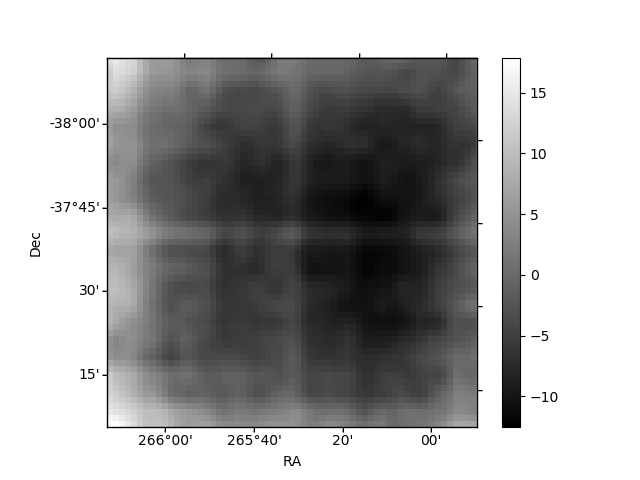
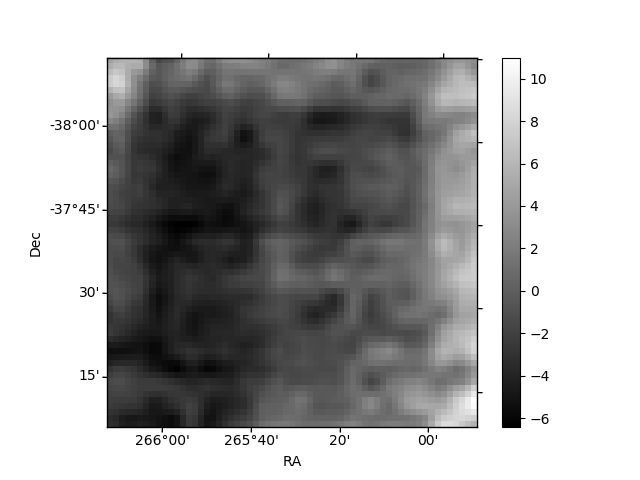
Histogram calculated using DETX and DETY for each event in the final _common_clean file
| Quadrant A |  |
 |
Quadrant B |
|---|---|---|---|
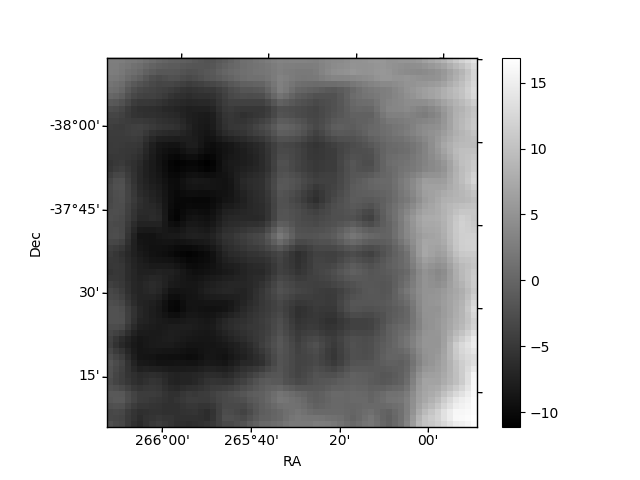
| Quadrant D | 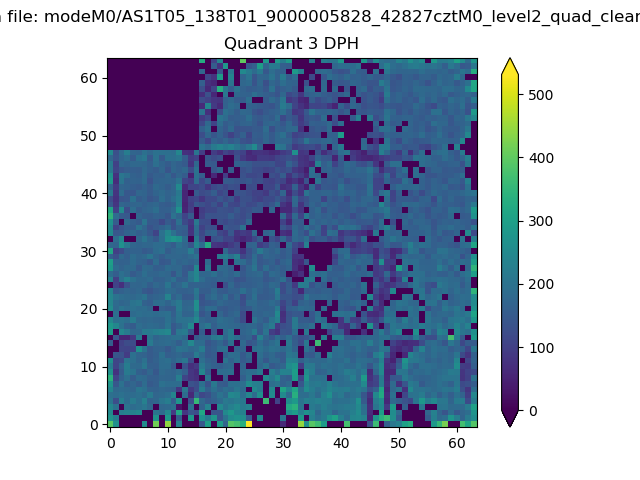 |
 |
Quadrant C |
| Plot type | Count rate plots | Images |
|---|---|---|
| Comparison with Poisson distribution Blue bars denote a histogram of data divided into 1 sec bins. Red curve is a Poisson curve with rate = median count rate of data. |
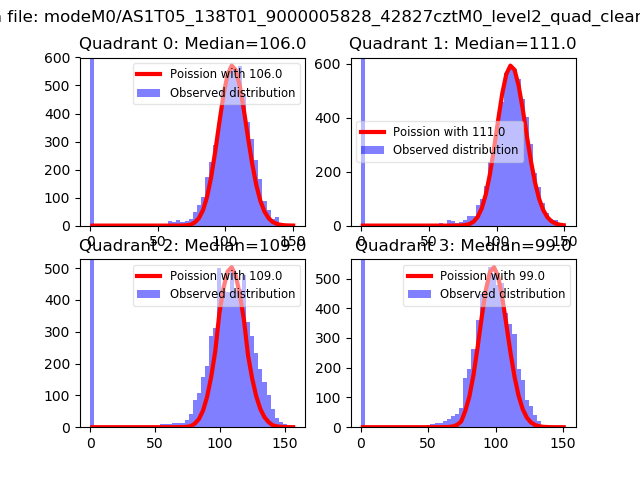 |
 |
| Quadrant-wise count rates Data is divided into 100 sec bins |
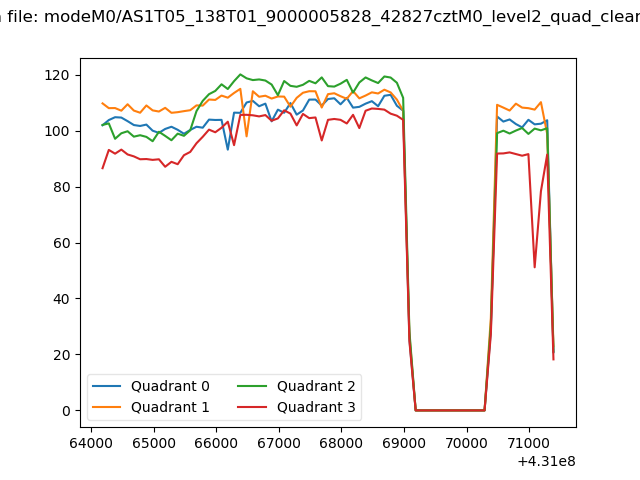 |
|
| Module-wise count rates for Quadrant A Data is divided into 100 sec bins |
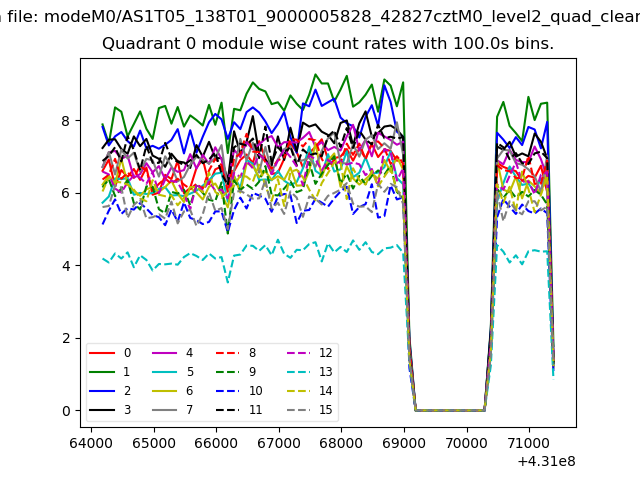 |
 |
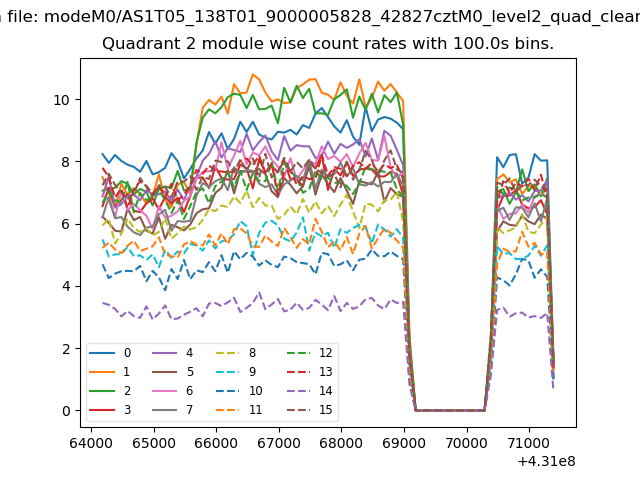
| Module-wise count rates for Quadrant B Data is divided into 100 sec bins |
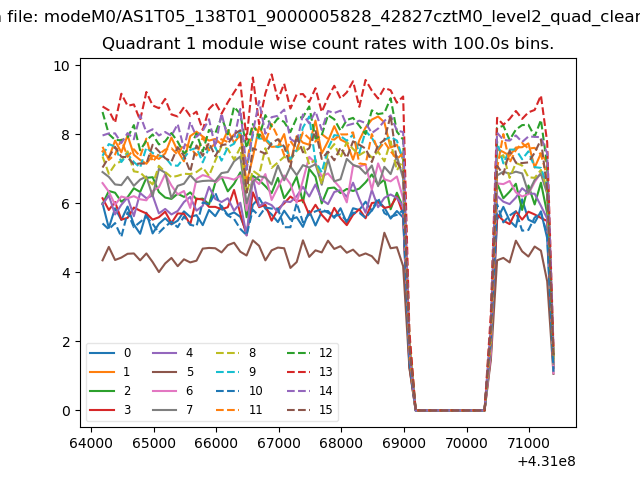 |
 |
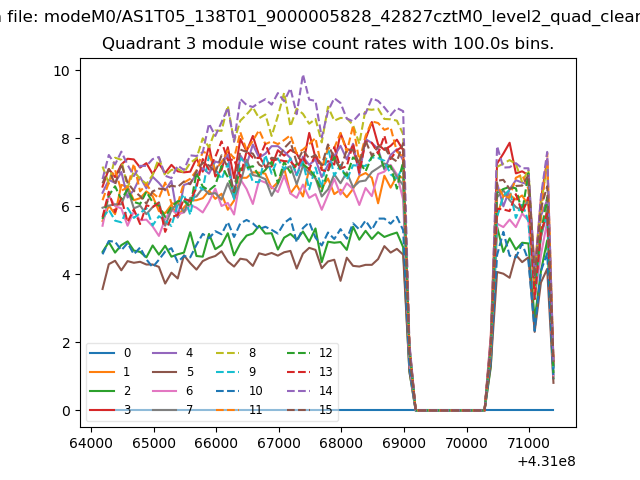
| Module-wise count rates for Quadrant C Data is divided into 100 sec bins |
 |
 |
| Module-wise count rates for Quadrant D Data is divided into 100 sec bins |
 |
 |
| Parameter | Plot |
|---|---|
| CZT HV Monitor | 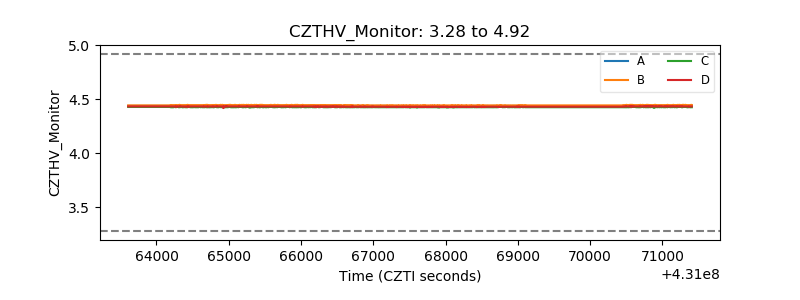 |
| D_VDD | 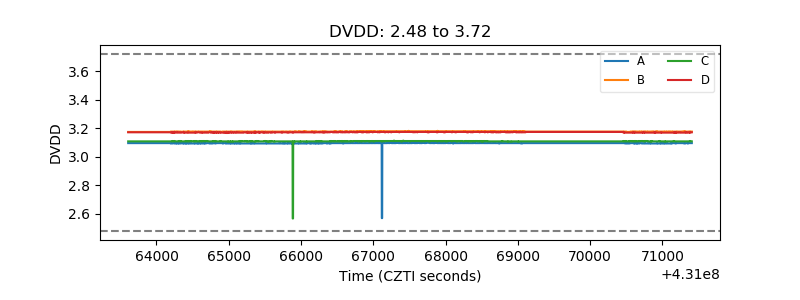 |
| Temperature 1 | 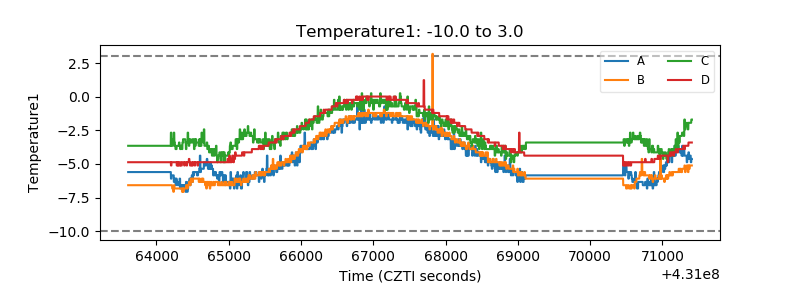 |
| Veto HV Monitor | 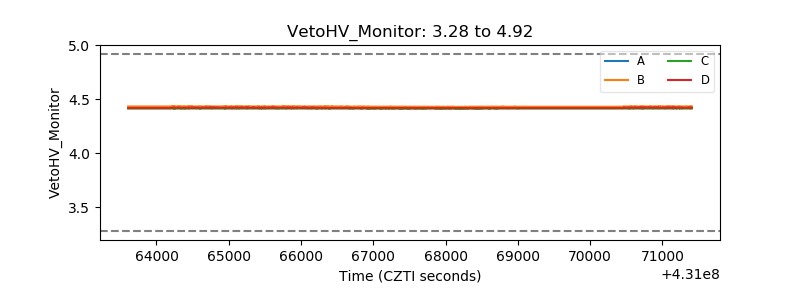 |
| Veto LLD | 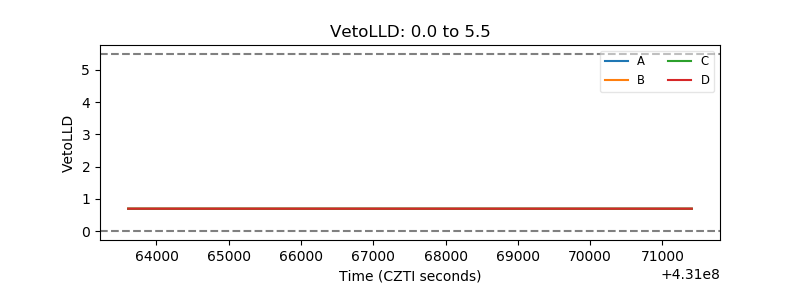 |
| Alpha Counter | 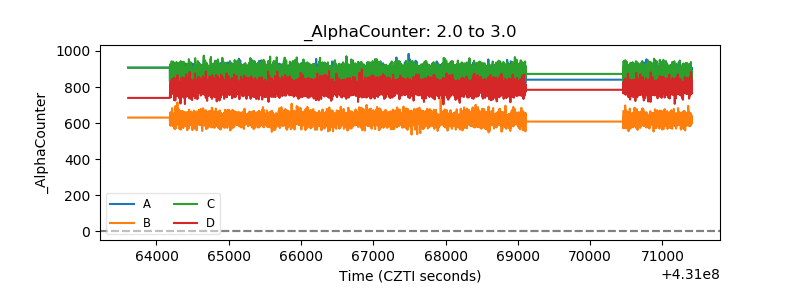 |
| _CPM_Rate | 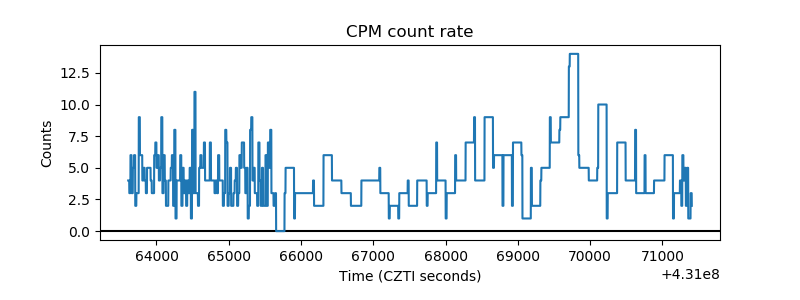 |
| CZT Counter | 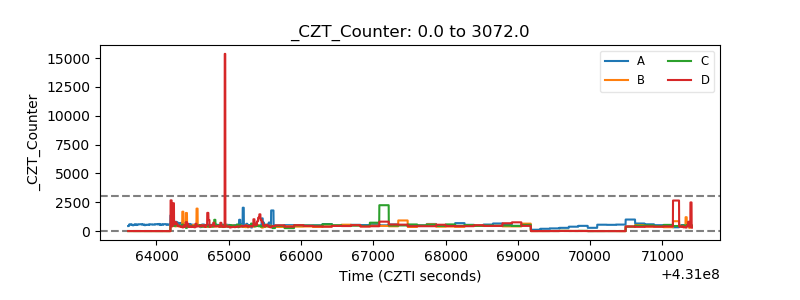 |
| +2.5 Volts monitor | 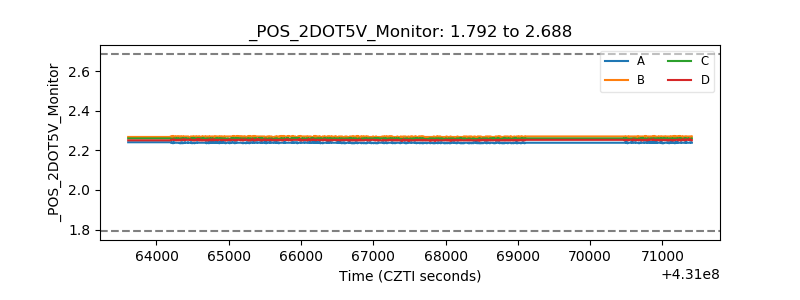 |
| +5 Volts monitor | 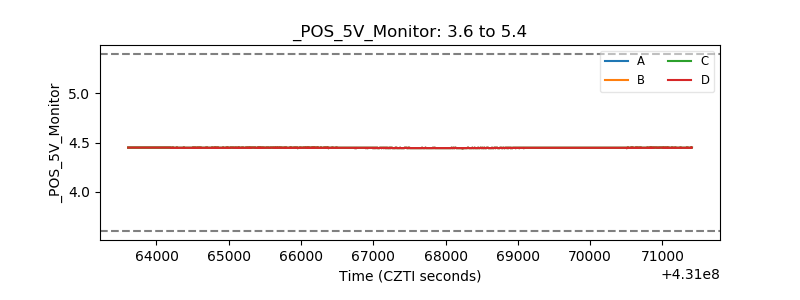 |
| _ROLL_ROT | 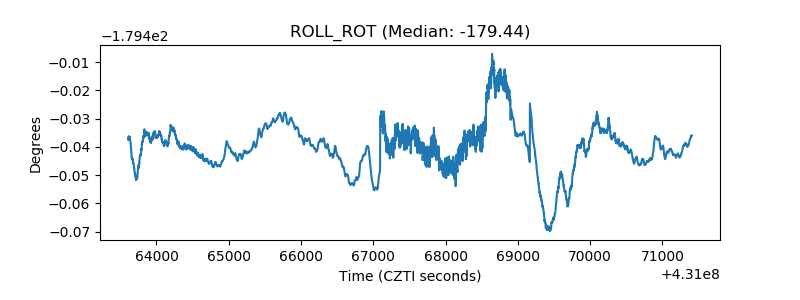 |
| _Roll_DEC | 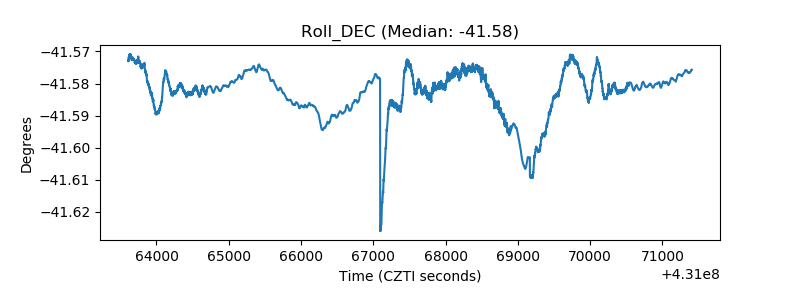 |
| _Roll_RA | 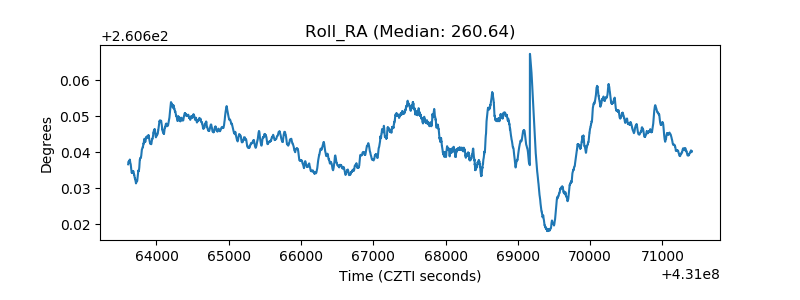 |
| Veto Counter | 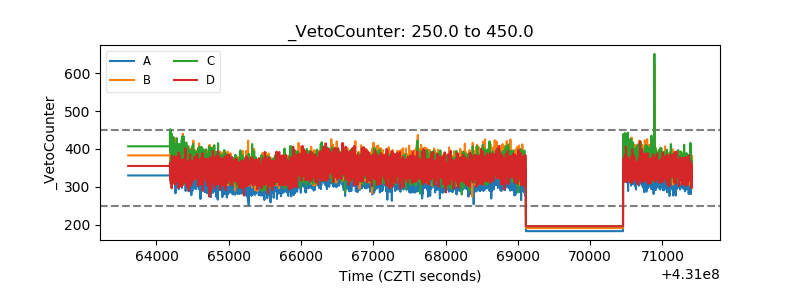 |