| Param | Original file | Final file |
|---|---|---|
| Filename | modeM0/AS1T05_138T01_9000005828_42830cztM0_level2.fits | modeM0/AS1T05_138T01_9000005828_42830cztM0_level2_quad_clean.evt |
| Size (bytes) | 1,021,939,200 | 255,761,280 |
| Size | 974.6 MB | 243.9 MB |
| Events in quadrant A | 10,068,968 | 1,639,050 |
| Events in quadrant B | 7,499,464 | 1,720,957 |
| Events in quadrant C | 8,784,415 | 1,746,183 |
| Events in quadrant D | 10,243,386 | 1,538,630 |
| Mode M0 | |||
|---|---|---|---|
| Quadrant | BADHDUFLAG | Total packets | Discarded packets |
| A | 0 | 39208 | 4 |
| B | 0 | 33471 | 4 |
| C | 0 | 35651 | 4 |
| D | 0 | 41445 | 4 |
| Mode M9 | |||
|---|---|---|---|
| Quadrant | BADHDUFLAG | Total packets | Discarded packets |
| A | 0 | 54 | 0 |
| B | 0 | 54 | 0 |
| C | 0 | 54 | 0 |
| D | 0 | 54 | 0 |
| Mode SS | |||
|---|---|---|---|
| Quadrant | BADHDUFLAG | Total packets | Discarded packets |
| A | 0 | 328 | 0 |
| B | 0 | 328 | 0 |
| C | 0 | 328 | 0 |
| D | 0 | 328 | 0 |
| Quadrant | Total seconds | Saturated seconds | Saturation percentage |
|---|---|---|---|
| A | 15922 | 404 | 2.537370% |
| B | 15923 | 94 | 0.590341% |
| C | 15923 | 178 | 1.117880% |
| D | 15923 | 542 | 3.403881% |
Noise dominated data is calculated using 1-second bins in cleaned event files. If a bin has >2000 counts, and if more than 50% of those come from <1% of pixels, then it is considered to be noise-dominated and hence unusable.
| Quadrant | # 1 sec bins | Bins with >0 counts | Bins with >2000 counts | High rate bins dominated by noise | Noise dominated (total time) | Noise dominated (detector-on time) | Marked lightcurve |
|---|---|---|---|---|---|---|---|
| A | 21386 | 15926 | 359 | 359 | 1.68% | 2.25% | 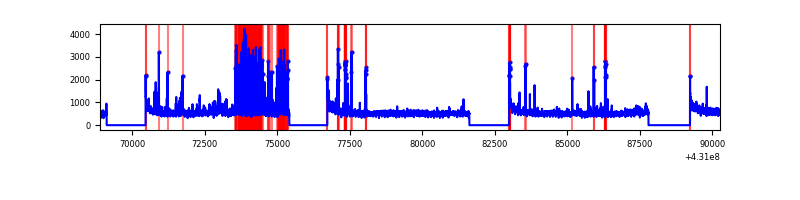 |
| B | 21387 | 15927 | 64 | 64 | 0.30% | 0.40% | 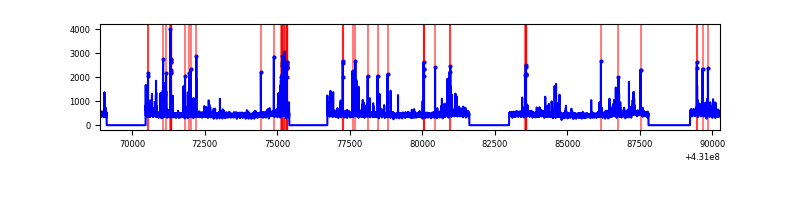 |
| C | 21387 | 15927 | 170 | 170 | 0.79% | 1.07% | 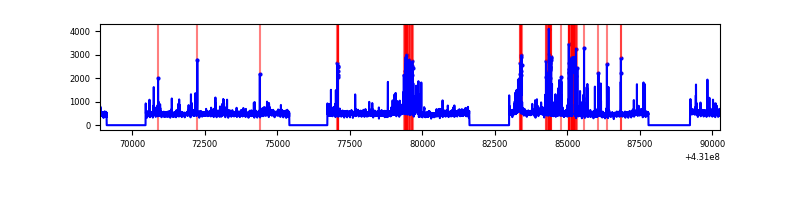 |
| D | 21387 | 15927 | 539 | 539 | 2.52% | 3.38% | 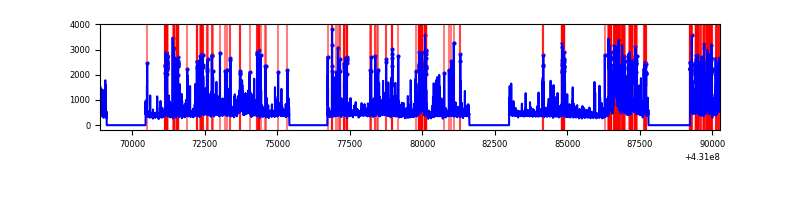 |
Top three noisy pixels from each quadrant. If the there are fewer than three noisy pixels in the level2.evt file, extra rows are filled as -1
| Pixel properties | Quadrant properties | ||||||
|---|---|---|---|---|---|---|---|
| Quadrant | DetID | PixID | Counts | Sigma | Mean | Median | Sigma |
| A | 10 | 83 | 1633832 | 4590.05 | 1734 | 1697 | 355.6 |
| A | 15 | 222 | 1218902 | 3423.14 | 1734 | 1697 | 355.6 |
| A | 12 | 189 | 185760 | 517.64 | 1734 | 1697 | 355.6 |
| B | 5 | 255 | 399231 | 1188.6 | 1741 | 1693 | 334.5 |
| B | 3 | 112 | 88145 | 258.48 | 1741 | 1693 | 334.5 |
| B | 0 | 245 | 88078 | 258.28 | 1741 | 1693 | 334.5 |
| C | 14 | 254 | 945660 | 2335.41 | 1722 | 1736 | 404.2 |
| C | 15 | 214 | 646183 | 1594.46 | 1722 | 1736 | 404.2 |
| C | 3 | 233 | 369250 | 909.29 | 1722 | 1736 | 404.2 |
| D | 1 | 52 | 942404 | 2249.93 | 1704 | 1658 | 418.1 |
| D | 12 | 17 | 749393 | 1788.31 | 1704 | 1658 | 418.1 |
| D | 12 | 233 | 431864 | 1028.9 | 1704 | 1658 | 418.1 |
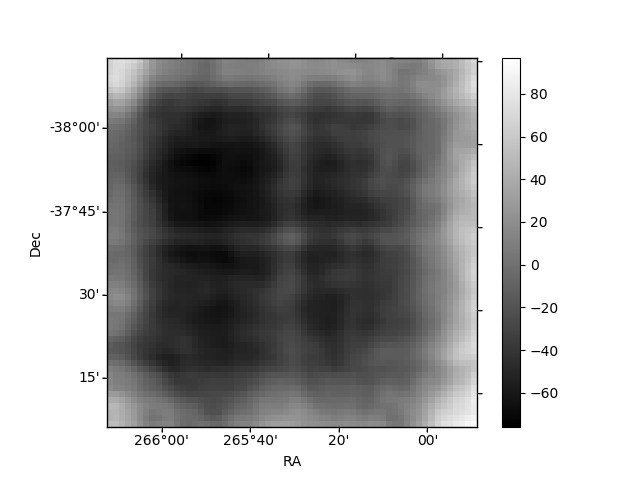
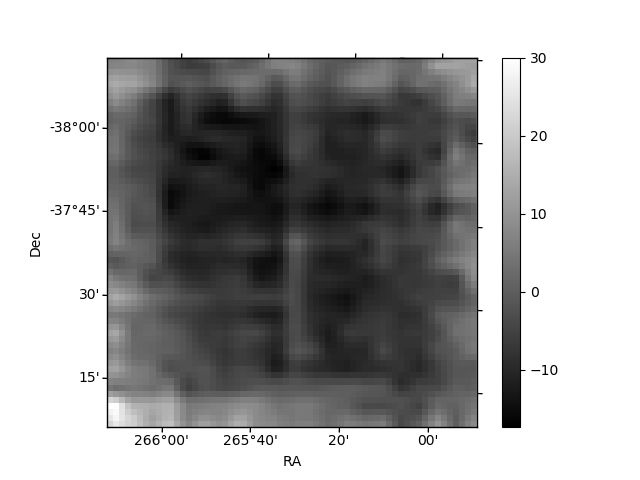
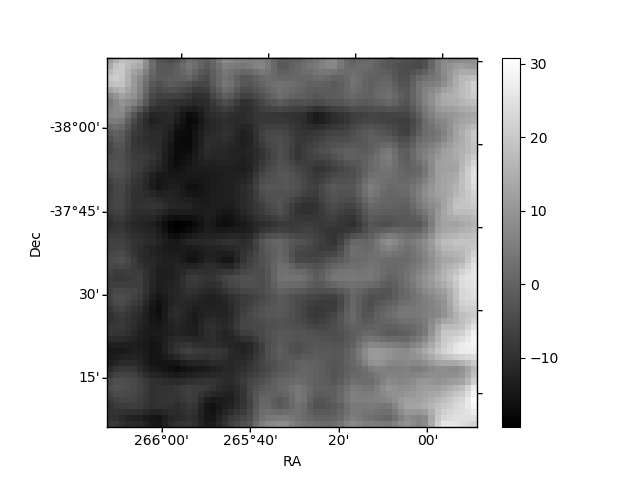
Histogram calculated using DETX and DETY for each event in the final _common_clean file
| Quadrant A | 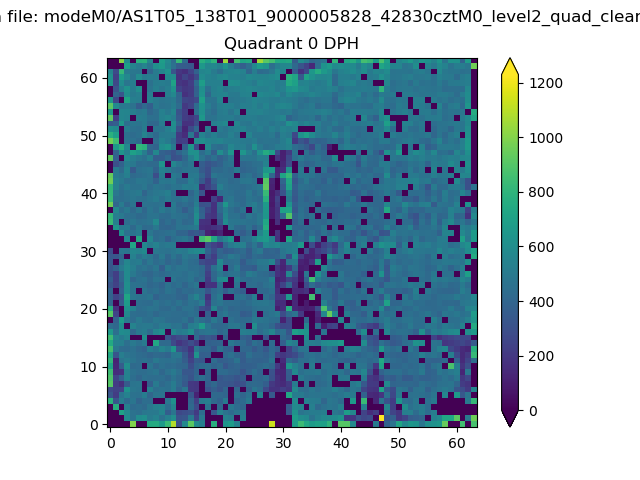 |
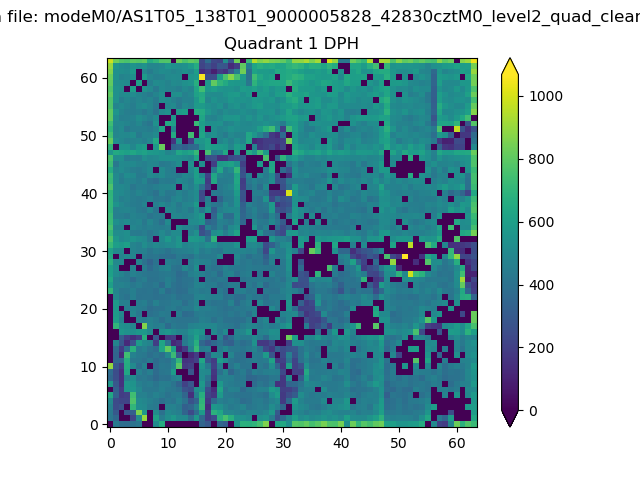 |
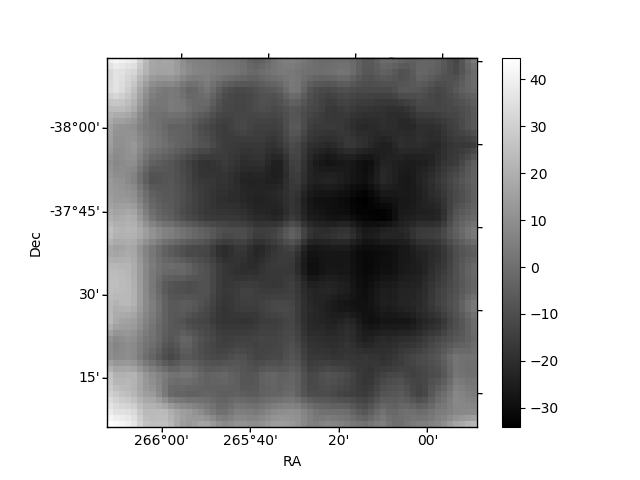
Quadrant B |
|---|---|---|---|
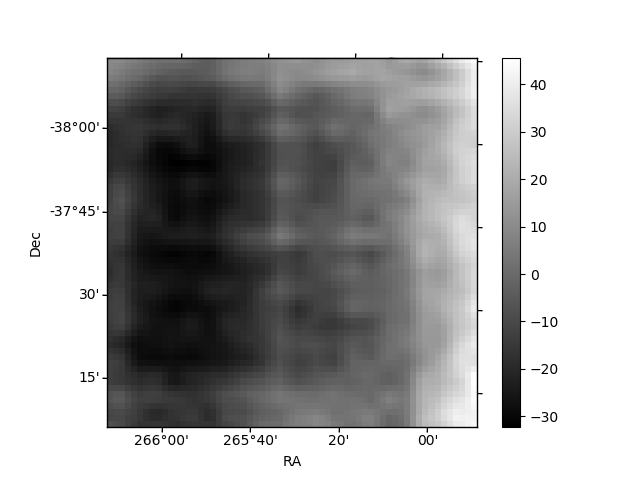
| Quadrant D | 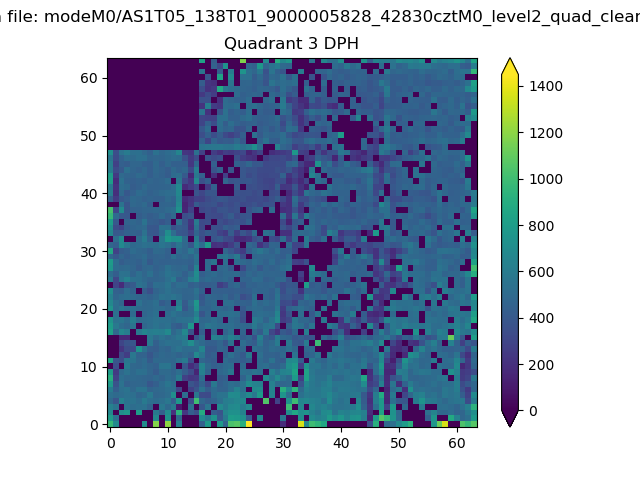 |
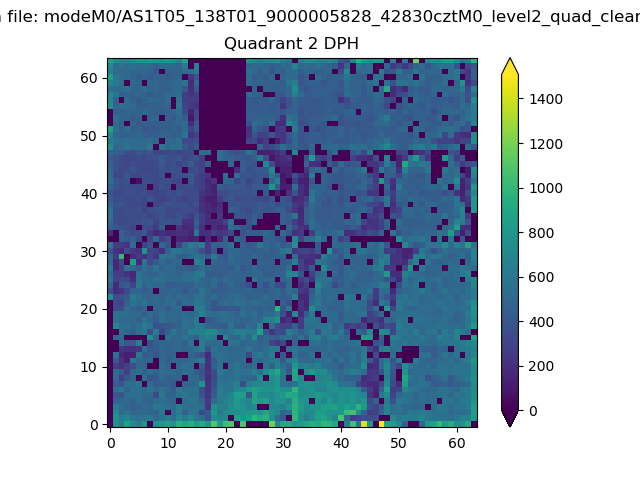 |
Quadrant C |
| Plot type | Count rate plots | Images |
|---|---|---|
| Comparison with Poisson distribution Blue bars denote a histogram of data divided into 1 sec bins. Red curve is a Poisson curve with rate = median count rate of data. |
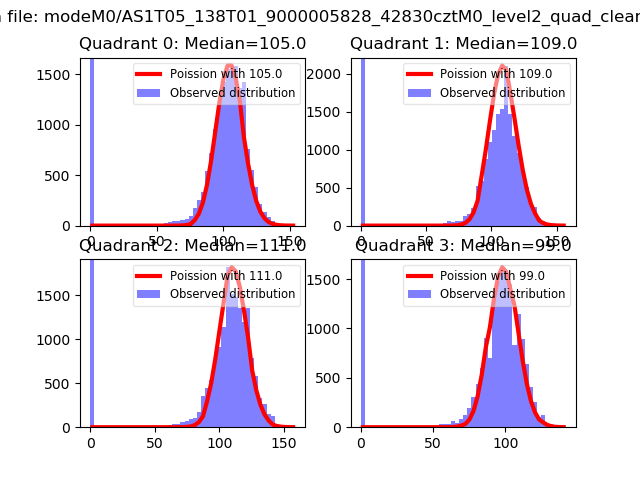 |
 |
| Quadrant-wise count rates Data is divided into 100 sec bins |
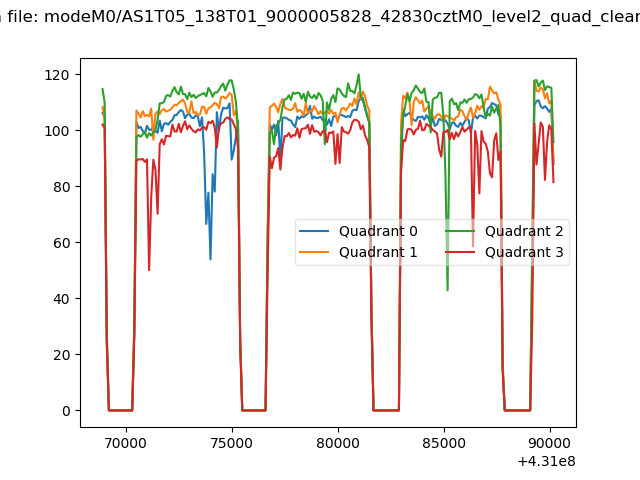 |
|
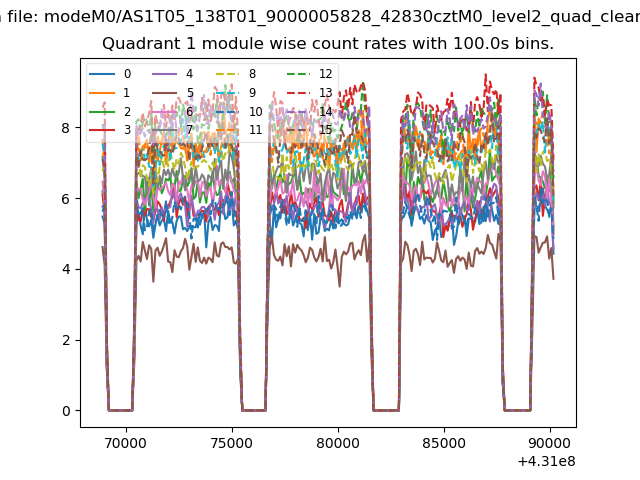
| Module-wise count rates for Quadrant A Data is divided into 100 sec bins |
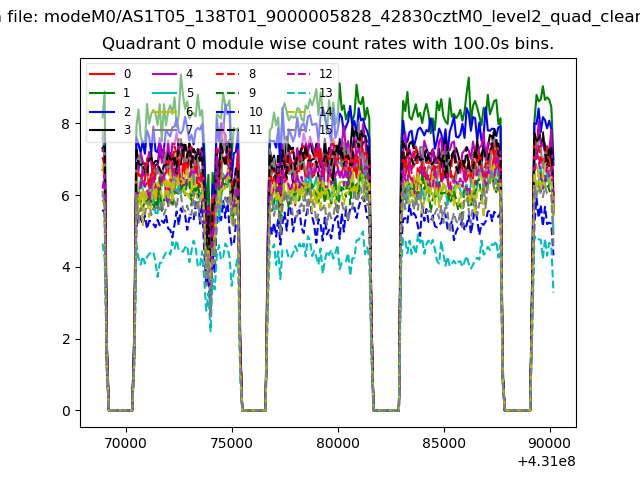 |
 |
| Module-wise count rates for Quadrant B Data is divided into 100 sec bins |
 |
 |
| Module-wise count rates for Quadrant C Data is divided into 100 sec bins |
 |
 |
| Module-wise count rates for Quadrant D Data is divided into 100 sec bins |
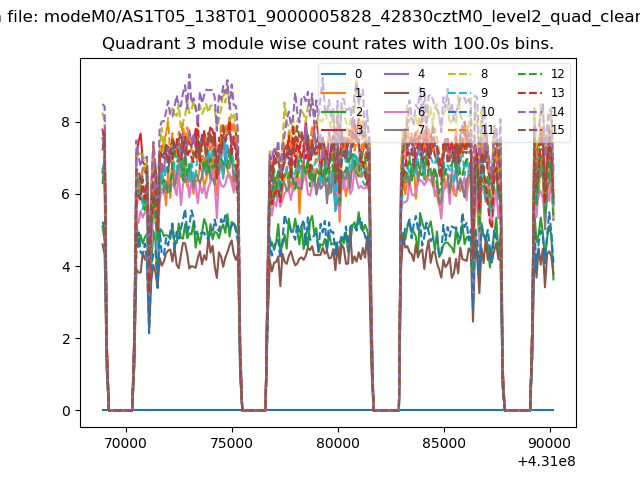 |
 |
| Parameter | Plot |
|---|---|
| CZT HV Monitor | 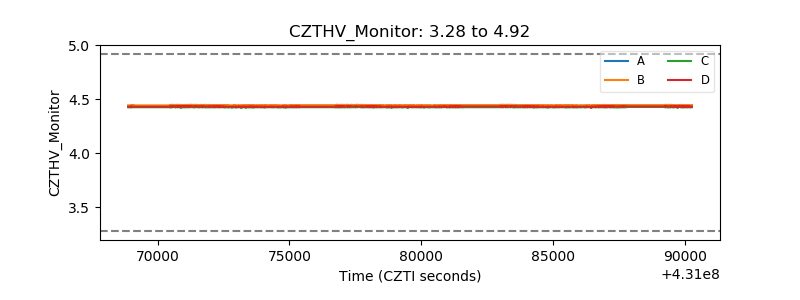 |
| D_VDD | 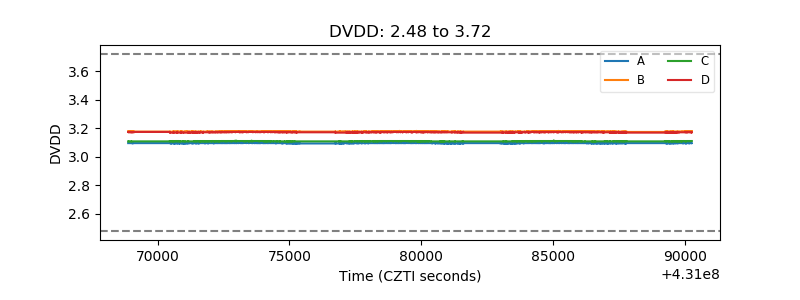 |
| Temperature 1 | 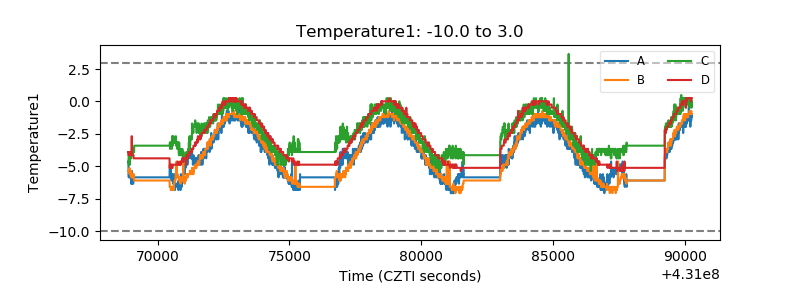 |
| Veto HV Monitor | 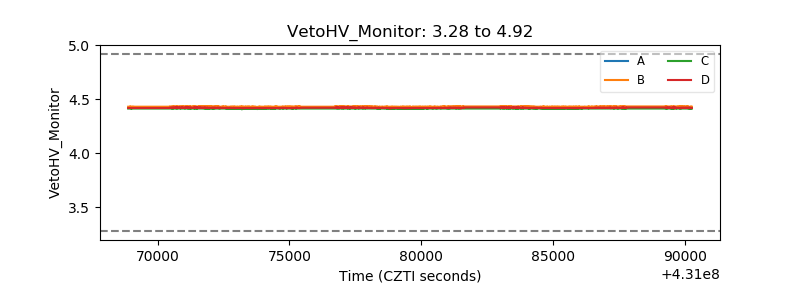 |
| Veto LLD | 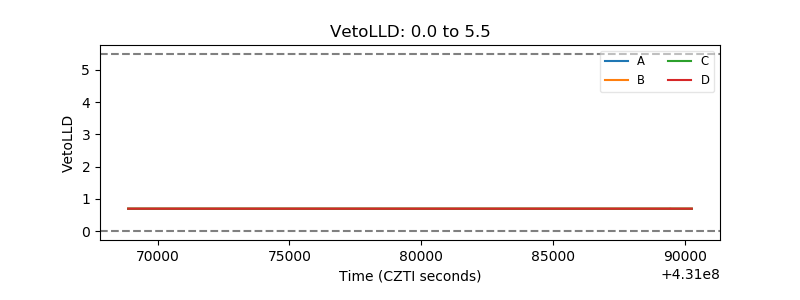 |
| Alpha Counter | 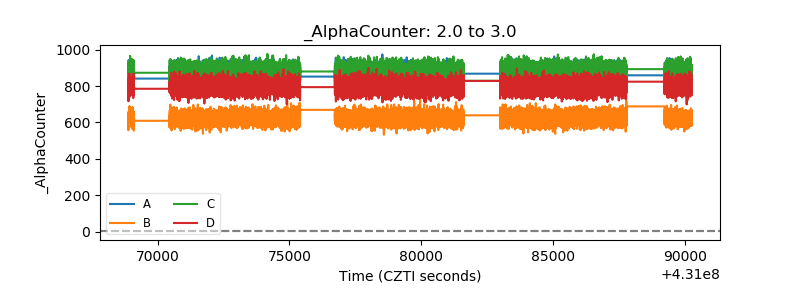 |
| _CPM_Rate | 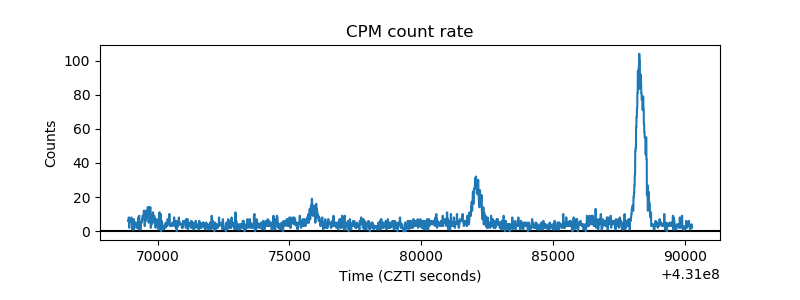 |
| CZT Counter | 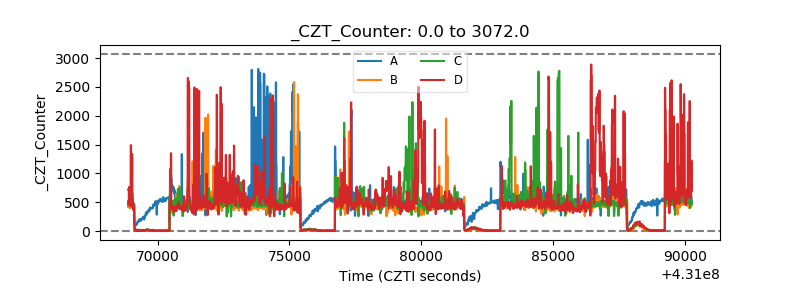 |
| +2.5 Volts monitor | 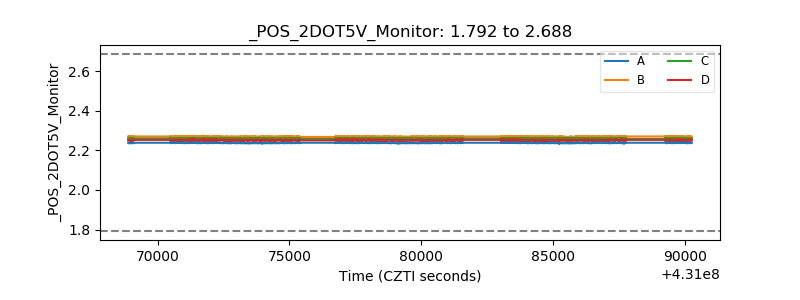 |
| +5 Volts monitor |  |
| _ROLL_ROT | 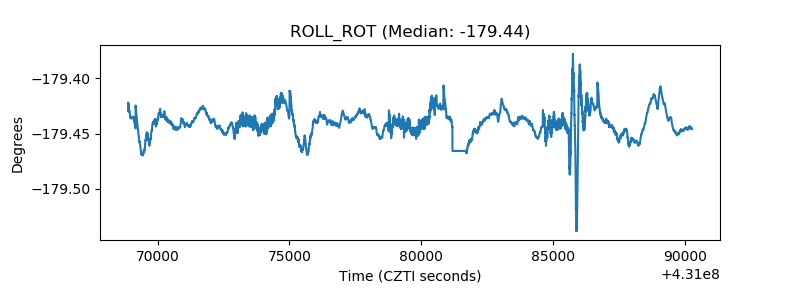 |
| _Roll_DEC | 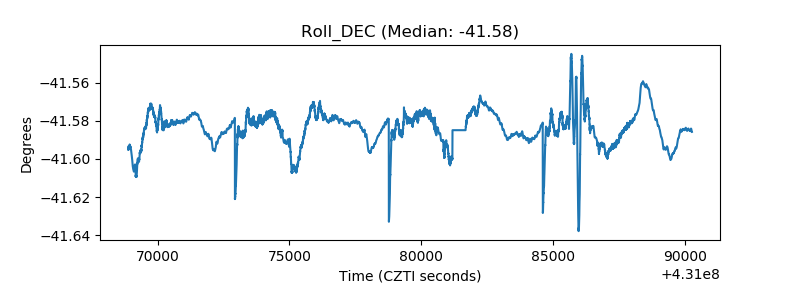 |
| _Roll_RA | 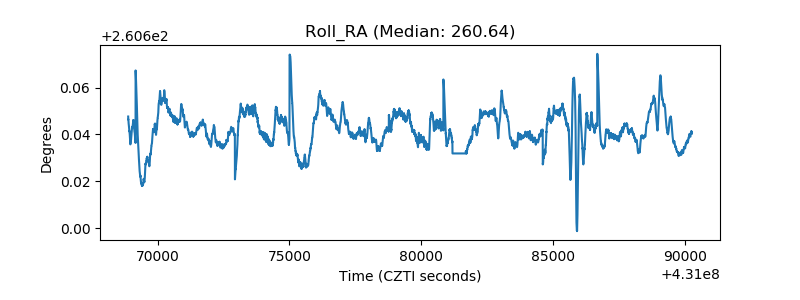 |
| Veto Counter | 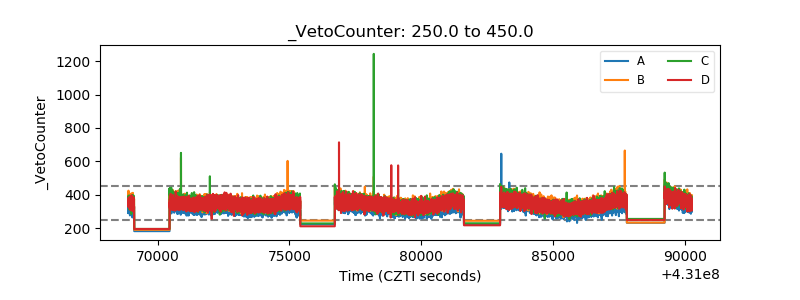 |