| Param | Original file | Final file |
|---|---|---|
| Filename | modeM0/AS1T05_138T01_9000005828_42831cztM0_level2.fits | modeM0/AS1T05_138T01_9000005828_42831cztM0_level2_quad_clean.evt |
| Size (bytes) | 357,609,600 | 91,578,240 |
| Size | 341.0 MB | 87.3 MB |
| Events in quadrant A | 3,178,165 | 599,427 |
| Events in quadrant B | 2,510,473 | 615,615 |
| Events in quadrant C | 2,854,873 | 622,904 |
| Events in quadrant D | 4,266,104 | 549,696 |
| Mode M0 | |||
|---|---|---|---|
| Quadrant | BADHDUFLAG | Total packets | Discarded packets |
| A | 0 | 12752 | 1 |
| B | 0 | 11276 | 1 |
| C | 0 | 11876 | 1 |
| D | 0 | 16498 | 1 |
| Mode M9 | |||
|---|---|---|---|
| Quadrant | BADHDUFLAG | Total packets | Discarded packets |
| A | 0 | 15 | 0 |
| B | 0 | 15 | 0 |
| C | 0 | 15 | 0 |
| D | 0 | 15 | 0 |
| Mode SS | |||
|---|---|---|---|
| Quadrant | BADHDUFLAG | Total packets | Discarded packets |
| A | 0 | 114 | 0 |
| B | 0 | 114 | 0 |
| C | 0 | 114 | 0 |
| D | 0 | 114 | 0 |
| Quadrant | Total seconds | Saturated seconds | Saturation percentage |
|---|---|---|---|
| A | 5497 | 28 | 0.509369% |
| B | 5498 | 17 | 0.309203% |
| C | 5498 | 37 | 0.672972% |
| D | 5498 | 281 | 5.110949% |
Noise dominated data is calculated using 1-second bins in cleaned event files. If a bin has >2000 counts, and if more than 50% of those come from <1% of pixels, then it is considered to be noise-dominated and hence unusable.
| Quadrant | # 1 sec bins | Bins with >0 counts | Bins with >2000 counts | High rate bins dominated by noise | Noise dominated (total time) | Noise dominated (detector-on time) | Marked lightcurve |
|---|---|---|---|---|---|---|---|
| A | 7080 | 5498 | 3 | 3 | 0.04% | 0.05% | 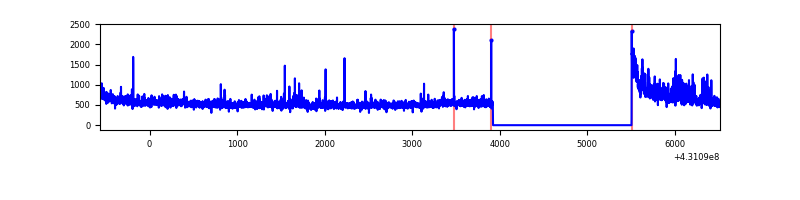 |
| B | 7081 | 5499 | 7 | 7 | 0.10% | 0.13% | 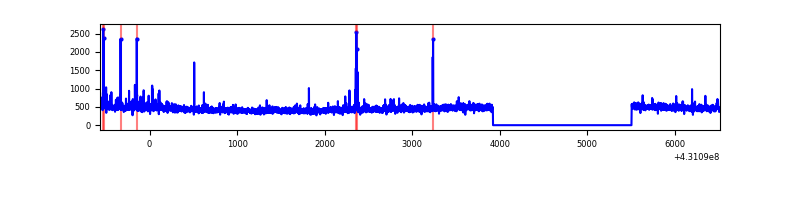 |
| C | 7081 | 5499 | 26 | 26 | 0.37% | 0.47% | 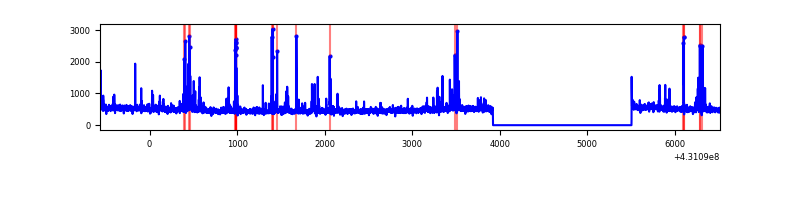 |
| D | 7081 | 5499 | 251 | 251 | 3.54% | 4.56% | 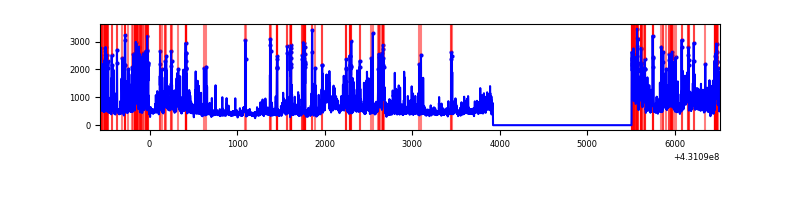 |
Top three noisy pixels from each quadrant. If the there are fewer than three noisy pixels in the level2.evt file, extra rows are filled as -1
| Pixel properties | Quadrant properties | ||||||
|---|---|---|---|---|---|---|---|
| Quadrant | DetID | PixID | Counts | Sigma | Mean | Median | Sigma |
| A | 10 | 83 | 568772 | 4534.96 | 606 | 594 | 125.3 |
| A | 12 | 189 | 162736 | 1294.15 | 606 | 594 | 125.3 |
| A | 15 | 222 | 50935 | 401.8 | 606 | 594 | 125.3 |
| B | 5 | 255 | 33835 | 283.46 | 603 | 586 | 117.3 |
| B | 3 | 112 | 27818 | 232.17 | 603 | 586 | 117.3 |
| B | 5 | 172 | 25411 | 211.64 | 603 | 586 | 117.3 |
| C | 14 | 254 | 240765 | 1688.73 | 598 | 601 | 142.2 |
| C | 15 | 214 | 224236 | 1572.51 | 598 | 601 | 142.2 |
| C | 3 | 233 | 26274 | 180.52 | 598 | 601 | 142.2 |
| D | 1 | 52 | 974721 | 6678.45 | 588 | 571 | 145.9 |
| D | 12 | 233 | 363620 | 2488.94 | 588 | 571 | 145.9 |
| D | 12 | 17 | 322589 | 2207.65 | 588 | 571 | 145.9 |
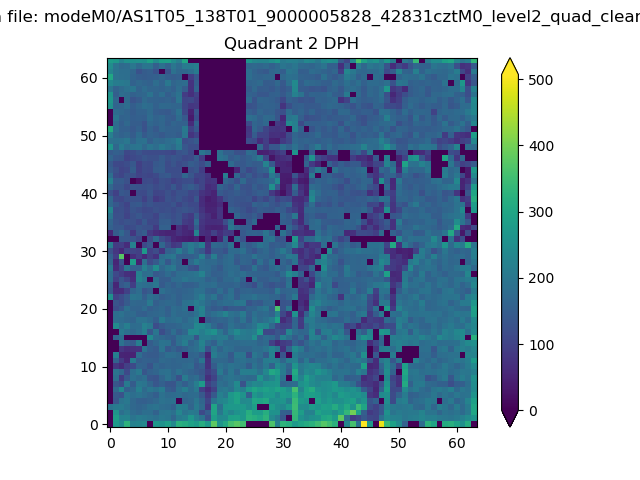
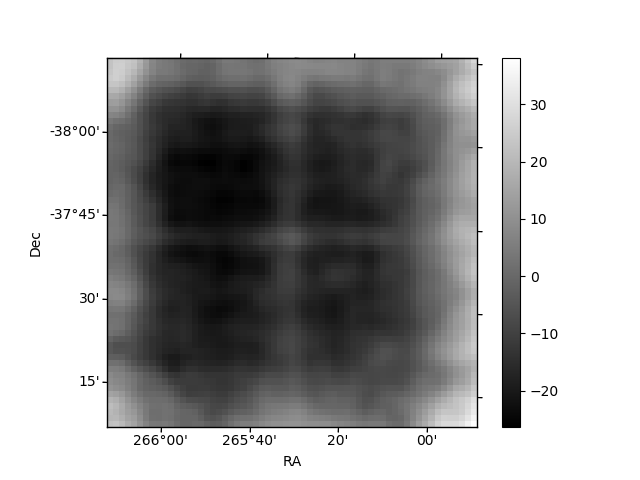
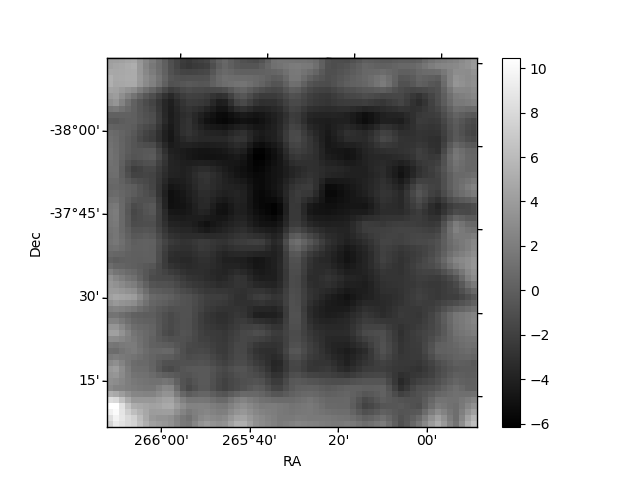
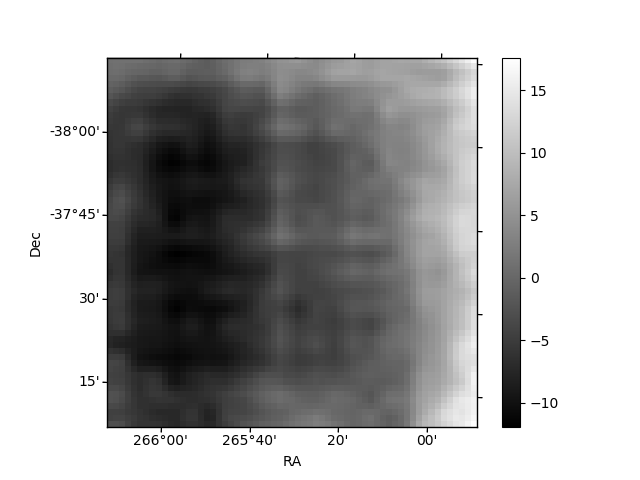
Histogram calculated using DETX and DETY for each event in the final _common_clean file
| Quadrant A | 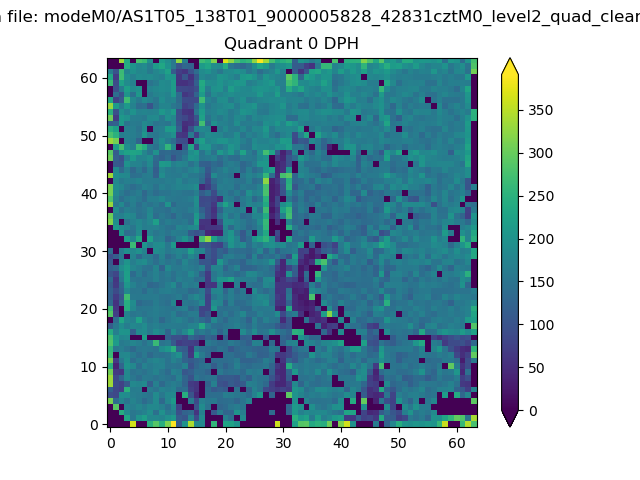 |
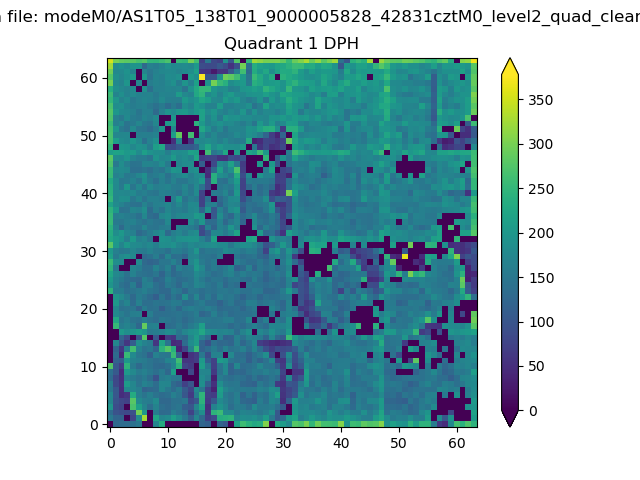 |
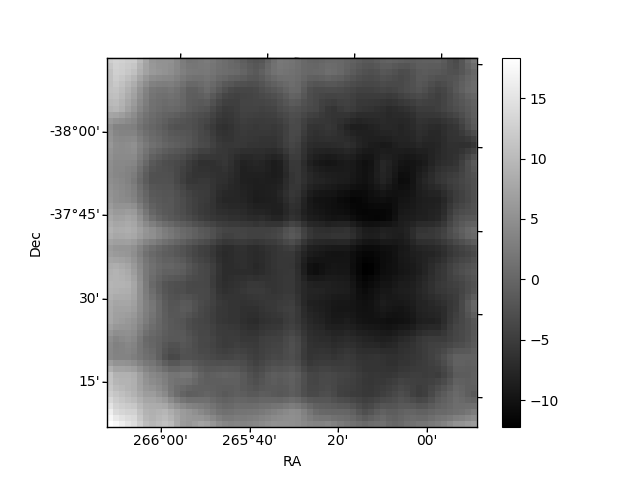
Quadrant B |
|---|---|---|---|
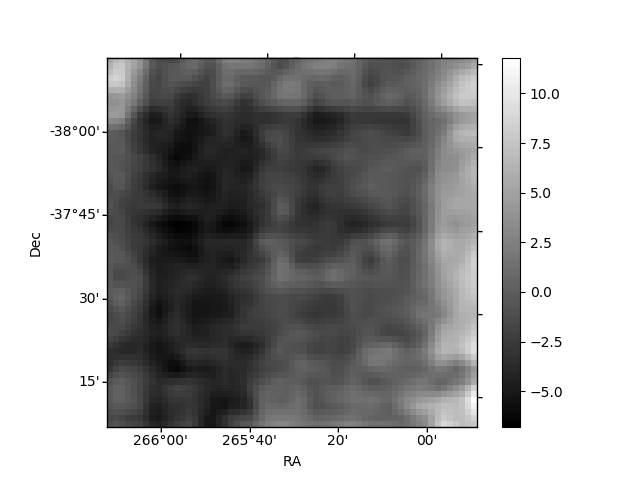
| Quadrant D | 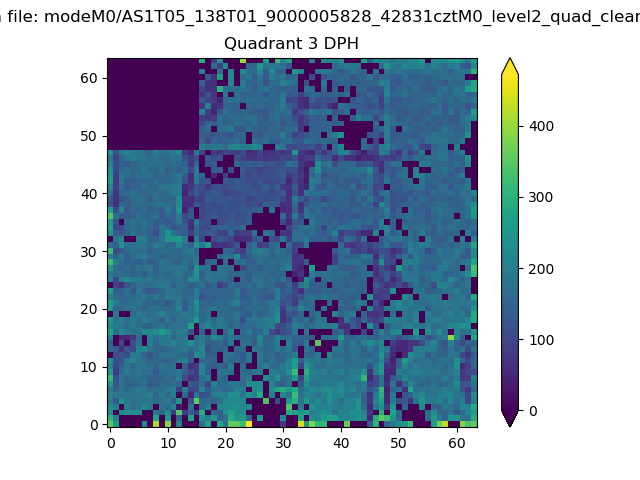 |
 |
Quadrant C |
| Plot type | Count rate plots | Images |
|---|---|---|
| Comparison with Poisson distribution Blue bars denote a histogram of data divided into 1 sec bins. Red curve is a Poisson curve with rate = median count rate of data. |
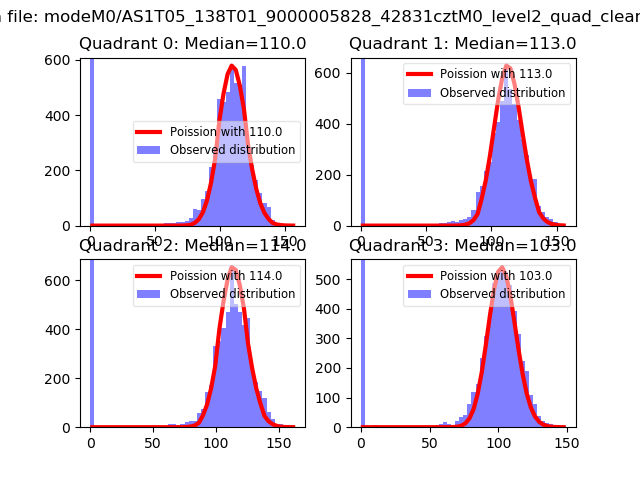 |
 |
| Quadrant-wise count rates Data is divided into 100 sec bins |
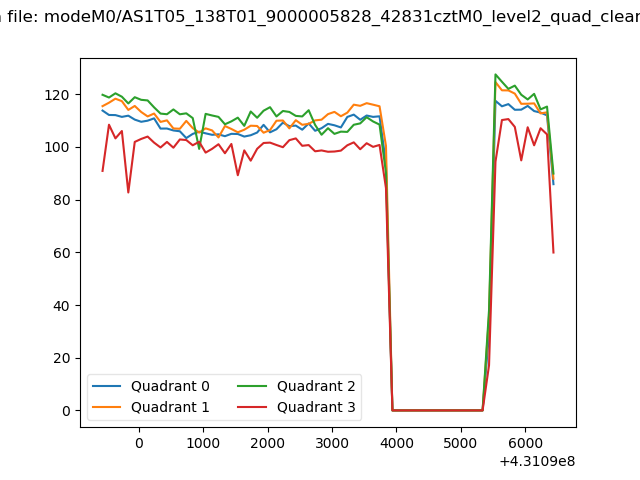 |
|
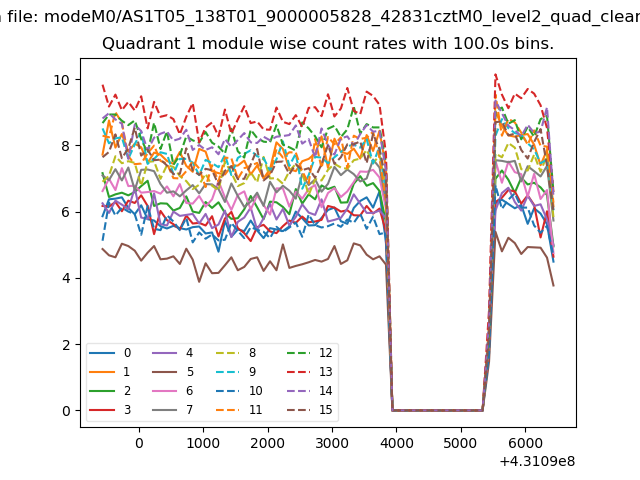
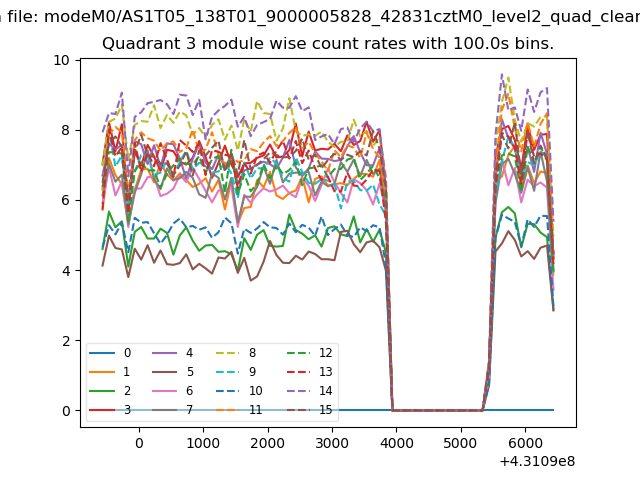
| Module-wise count rates for Quadrant A Data is divided into 100 sec bins |
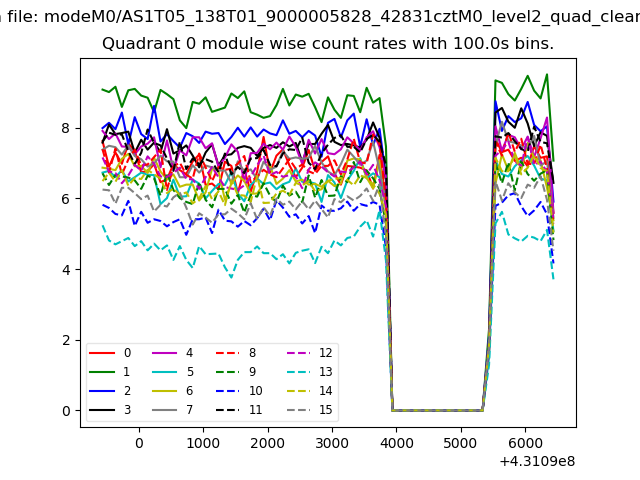 |
 |
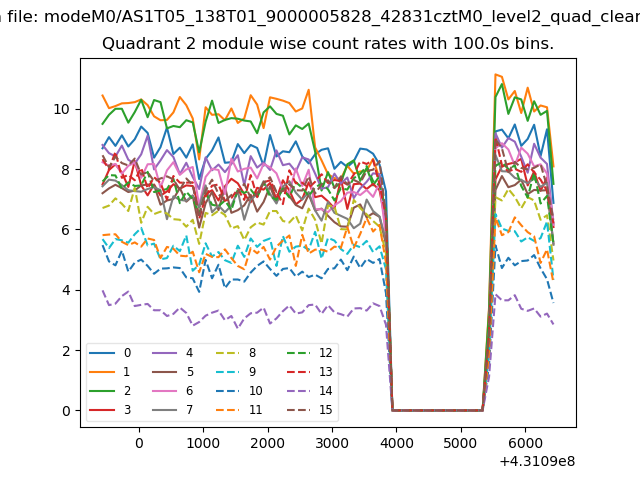
| Module-wise count rates for Quadrant B Data is divided into 100 sec bins |
 |
 |
| Module-wise count rates for Quadrant C Data is divided into 100 sec bins |
 |
 |
| Module-wise count rates for Quadrant D Data is divided into 100 sec bins |
 |
 |
| Parameter | Plot |
|---|---|
| CZT HV Monitor | 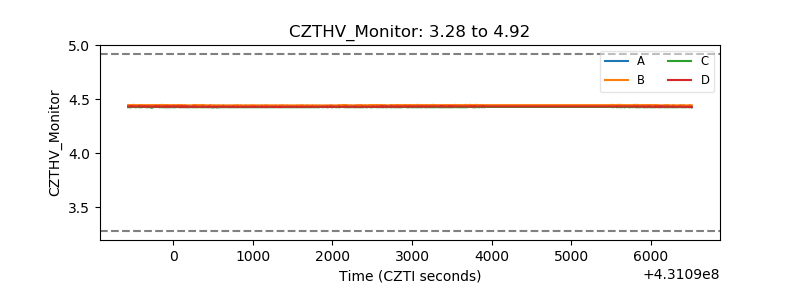 |
| D_VDD | 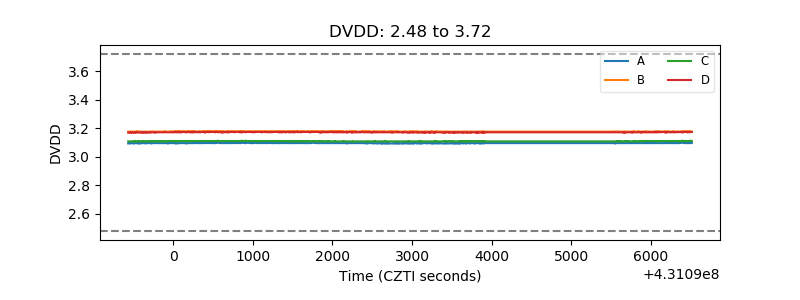 |
| Temperature 1 | 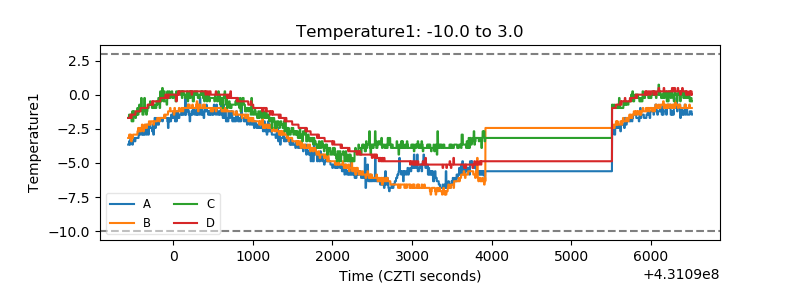 |
| Veto HV Monitor | 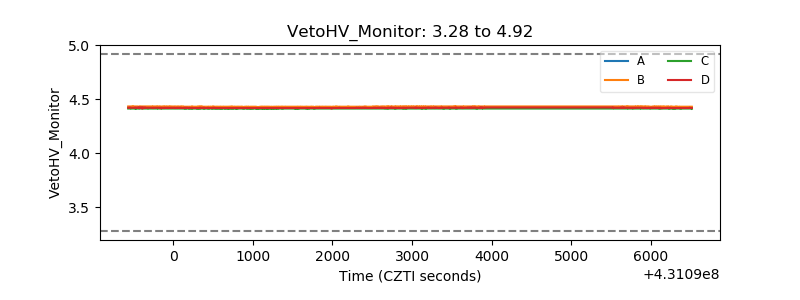 |
| Veto LLD | 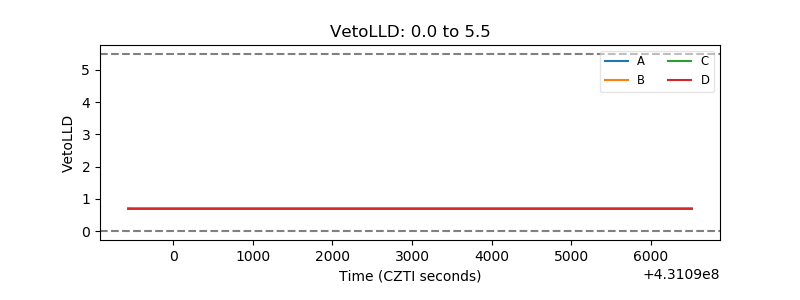 |
| Alpha Counter |  |
| _CPM_Rate | 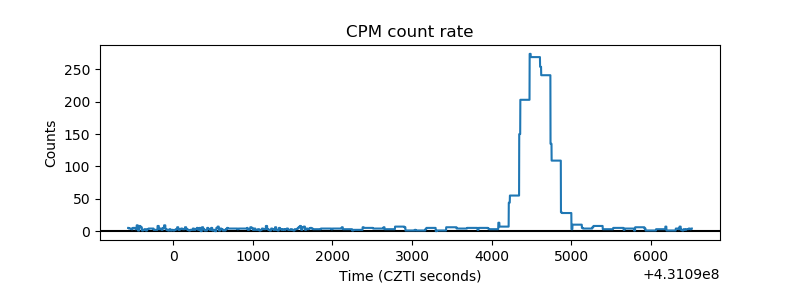 |
| CZT Counter | 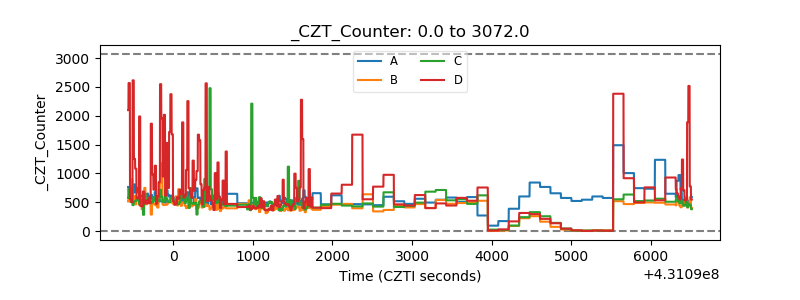 |
| +2.5 Volts monitor | 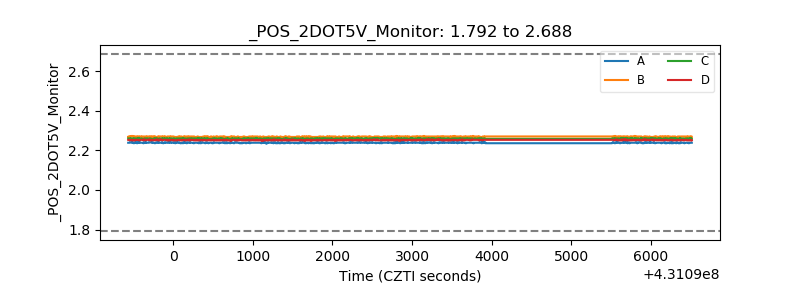 |
| +5 Volts monitor | 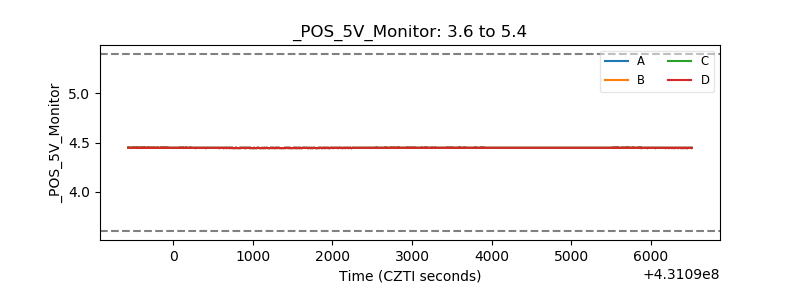 |
| _ROLL_ROT | 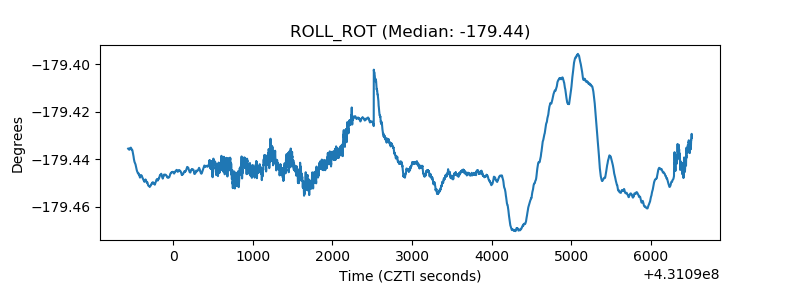 |
| _Roll_DEC | 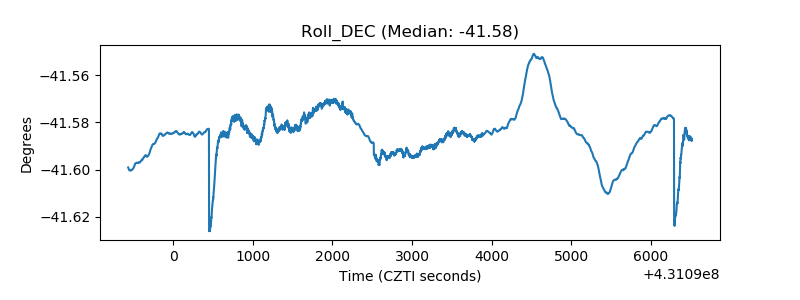 |
| _Roll_RA | 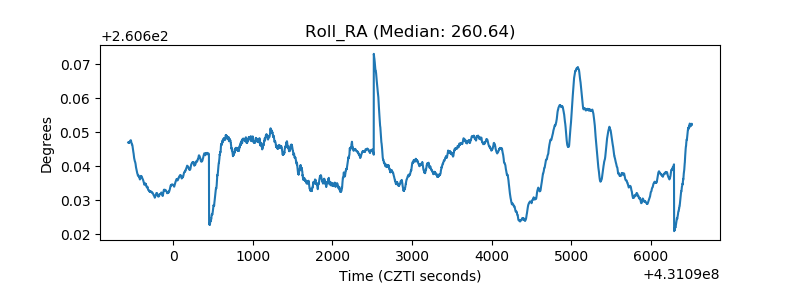 |
| Veto Counter | 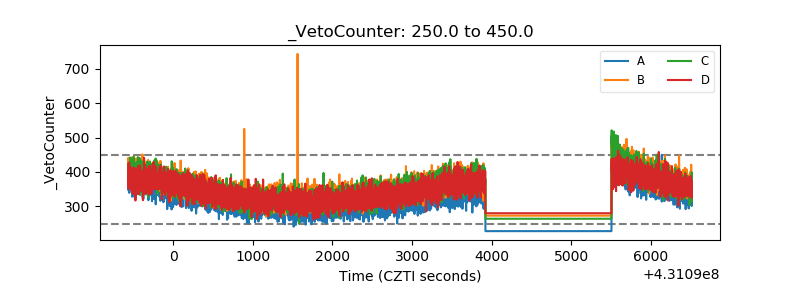 |