| Param | Original file | Final file |
|---|---|---|
| Filename | modeM0/AS1T05_138T01_9000005828_42832cztM0_level2.fits | modeM0/AS1T05_138T01_9000005828_42832cztM0_level2_quad_clean.evt |
| Size (bytes) | 380,456,640 | 92,208,960 |
| Size | 362.8 MB | 87.9 MB |
| Events in quadrant A | 3,653,089 | 609,318 |
| Events in quadrant B | 2,440,580 | 627,021 |
| Events in quadrant C | 2,977,333 | 627,700 |
| Events in quadrant D | 4,581,835 | 540,323 |
| Mode M0 | |||
|---|---|---|---|
| Quadrant | BADHDUFLAG | Total packets | Discarded packets |
| A | 0 | 14486 | 4 |
| B | 0 | 11157 | 2 |
| C | 0 | 12286 | 2 |
| D | 0 | 17484 | 2 |
| Mode M9 | |||
|---|---|---|---|
| Quadrant | BADHDUFLAG | Total packets | Discarded packets |
| A | 0 | 19 | 0 |
| B | 0 | 20 | 0 |
| C | 0 | 20 | 0 |
| D | 0 | 20 | 0 |
| Mode SS | |||
|---|---|---|---|
| Quadrant | BADHDUFLAG | Total packets | Discarded packets |
| A | 0 | 114 | 0 |
| B | 0 | 114 | 0 |
| C | 0 | 114 | 0 |
| D | 0 | 114 | 0 |
| Quadrant | Total seconds | Saturated seconds | Saturation percentage |
|---|---|---|---|
| A | 5533 | 70 | 1.265136% |
| B | 5533 | 7 | 0.126514% |
| C | 5533 | 46 | 0.831375% |
| D | 5533 | 427 | 7.717332% |
Noise dominated data is calculated using 1-second bins in cleaned event files. If a bin has >2000 counts, and if more than 50% of those come from <1% of pixels, then it is considered to be noise-dominated and hence unusable.
| Quadrant | # 1 sec bins | Bins with >0 counts | Bins with >2000 counts | High rate bins dominated by noise | Noise dominated (total time) | Noise dominated (detector-on time) | Marked lightcurve |
|---|---|---|---|---|---|---|---|
| A | 7236 | 5534 | 40 | 40 | 0.55% | 0.72% | 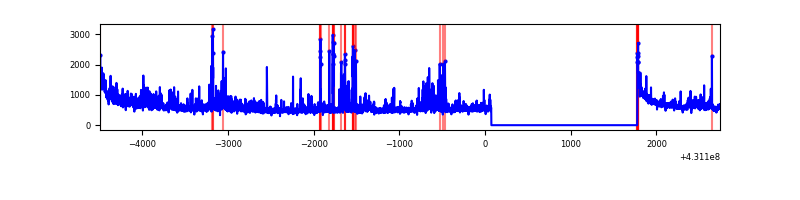 |
| B | 7236 | 5534 | 1 | 1 | 0.01% | 0.02% | 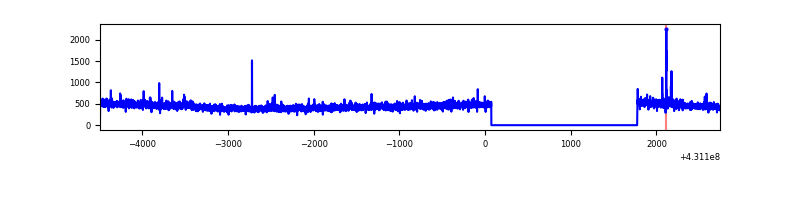 |
| C | 7236 | 5534 | 43 | 43 | 0.59% | 0.78% | 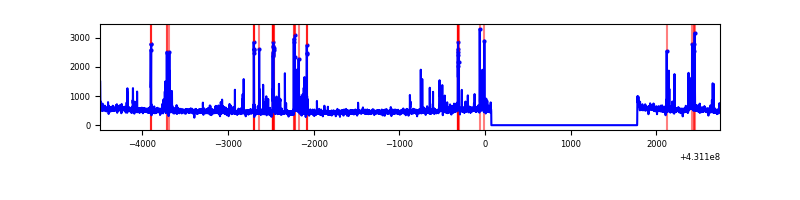 |
| D | 7236 | 5534 | 367 | 367 | 5.07% | 6.63% | 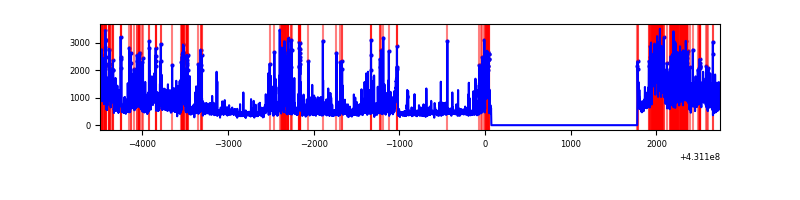 |
Top three noisy pixels from each quadrant. If the there are fewer than three noisy pixels in the level2.evt file, extra rows are filled as -1
| Pixel properties | Quadrant properties | ||||||
|---|---|---|---|---|---|---|---|
| Quadrant | DetID | PixID | Counts | Sigma | Mean | Median | Sigma |
| A | 10 | 83 | 651706 | 5134.29 | 611 | 598 | 126.8 |
| A | 15 | 222 | 361823 | 2848.43 | 611 | 598 | 126.8 |
| A | 12 | 189 | 240067 | 1888.32 | 611 | 598 | 126.8 |
| B | 0 | 245 | 16310 | 133.82 | 607 | 591 | 117.5 |
| B | 12 | 111 | 14712 | 120.21 | 607 | 591 | 117.5 |
| B | 11 | 111 | 13243 | 107.71 | 607 | 591 | 117.5 |
| C | 14 | 254 | 304326 | 2127.14 | 599 | 603 | 142.8 |
| C | 15 | 214 | 228610 | 1596.86 | 599 | 603 | 142.8 |
| C | 3 | 233 | 77986 | 541.96 | 599 | 603 | 142.8 |
| D | 1 | 52 | 1286793 | 8937.58 | 581 | 565 | 143.9 |
| D | 10 | 118 | 377423 | 2618.66 | 581 | 565 | 143.9 |
| D | 12 | 233 | 193219 | 1338.69 | 581 | 565 | 143.9 |
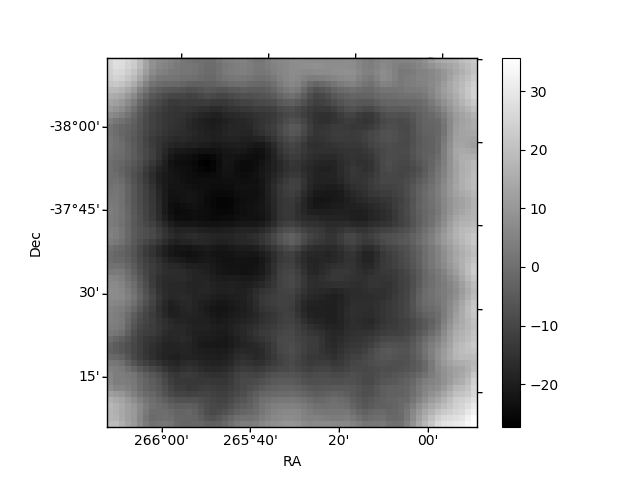
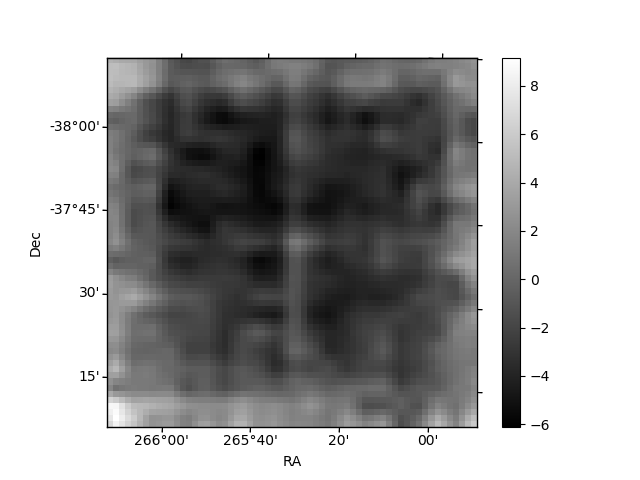
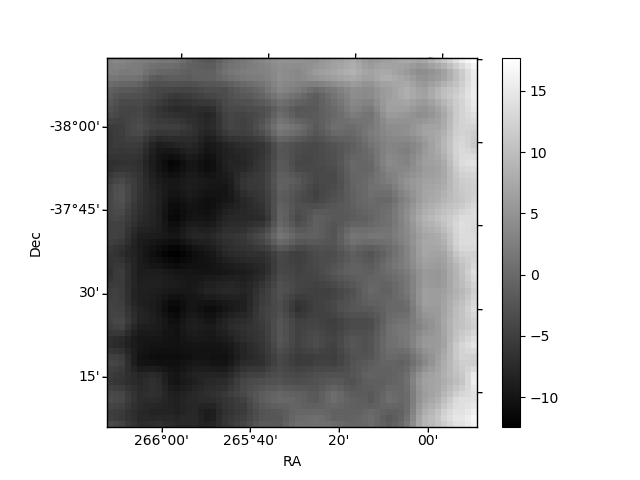
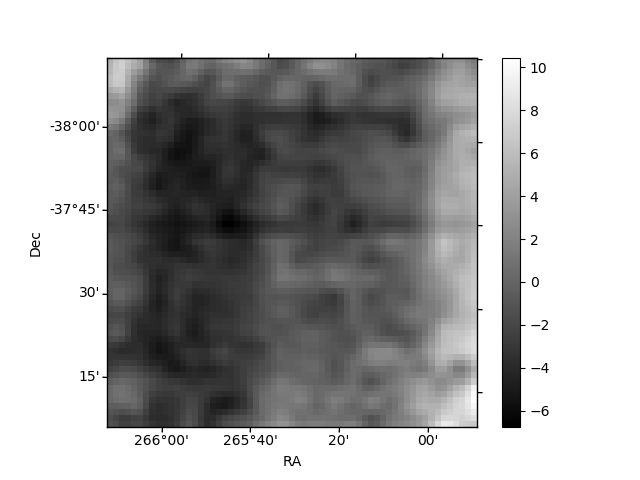
Histogram calculated using DETX and DETY for each event in the final _common_clean file
| Quadrant A | 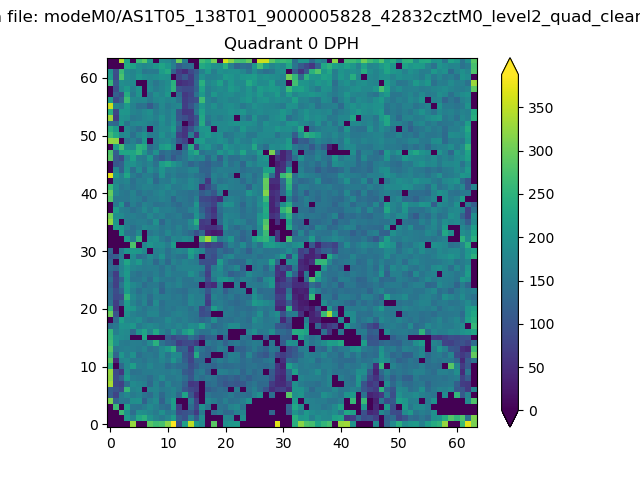 |
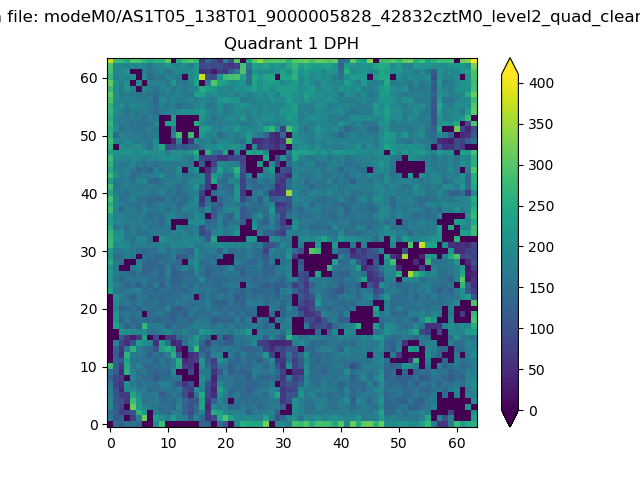 |
Quadrant B |
|---|---|---|---|
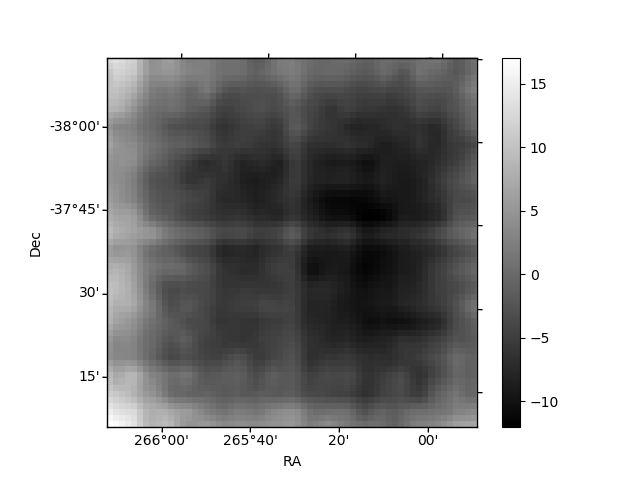
| Quadrant D | 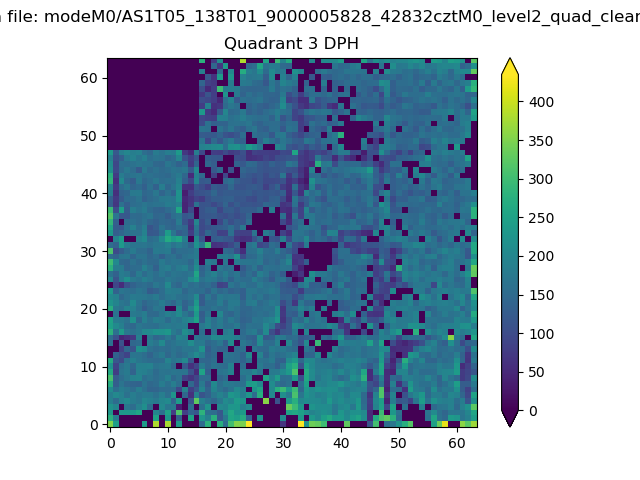 |
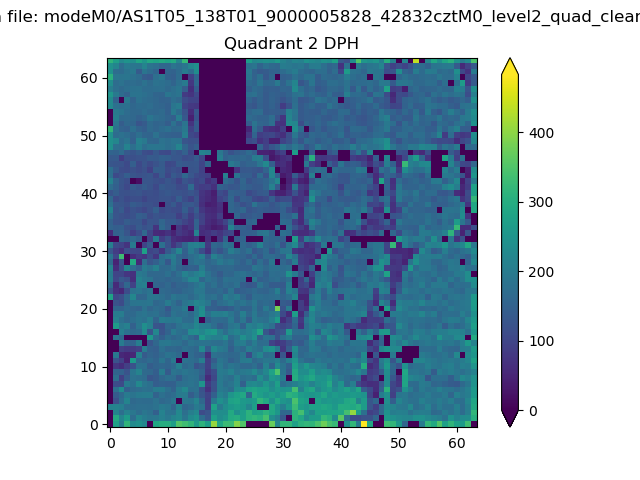 |
Quadrant C |
| Plot type | Count rate plots | Images |
|---|---|---|
| Comparison with Poisson distribution Blue bars denote a histogram of data divided into 1 sec bins. Red curve is a Poisson curve with rate = median count rate of data. |
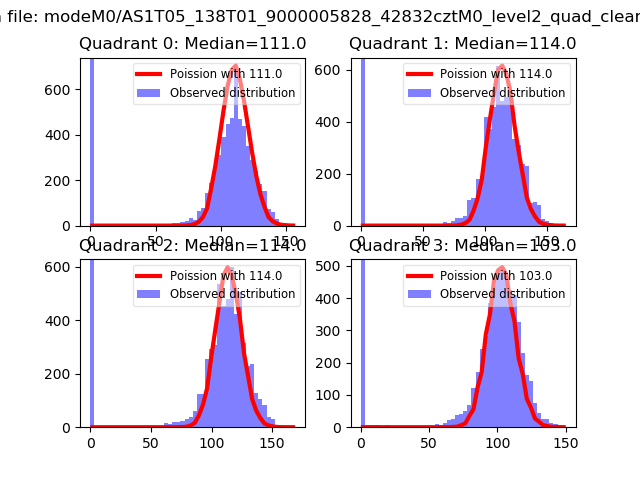 |
 |
| Quadrant-wise count rates Data is divided into 100 sec bins |
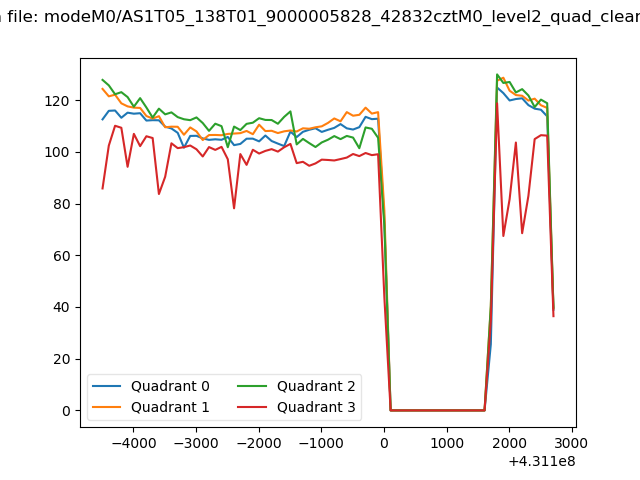 |
|
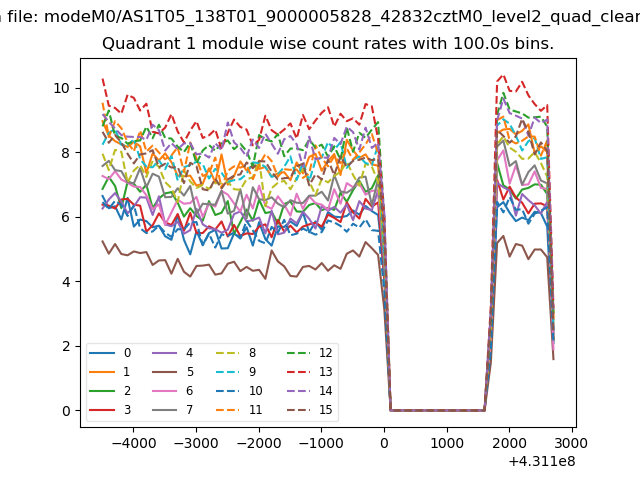
| Module-wise count rates for Quadrant A Data is divided into 100 sec bins |
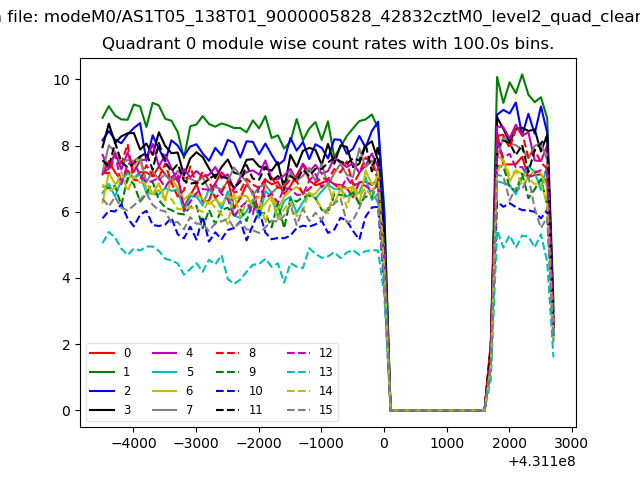 |
 |
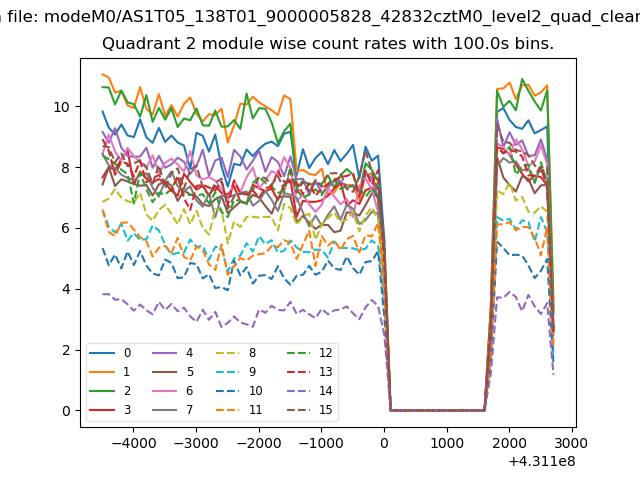
| Module-wise count rates for Quadrant B Data is divided into 100 sec bins |
 |
 |
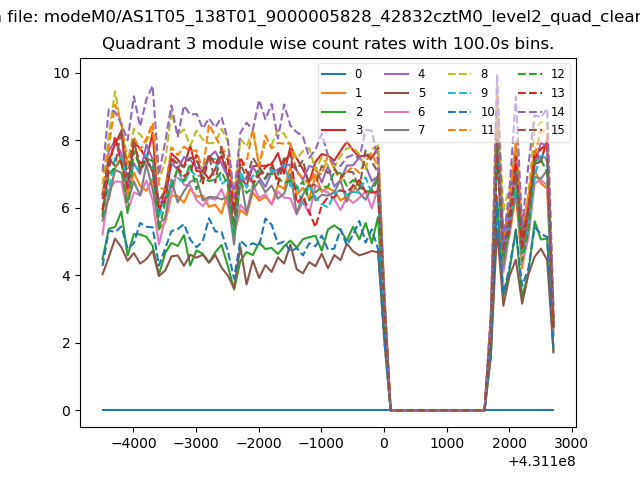
| Module-wise count rates for Quadrant C Data is divided into 100 sec bins |
 |
 |
| Module-wise count rates for Quadrant D Data is divided into 100 sec bins |
 |
 |
| Parameter | Plot |
|---|---|
| CZT HV Monitor | 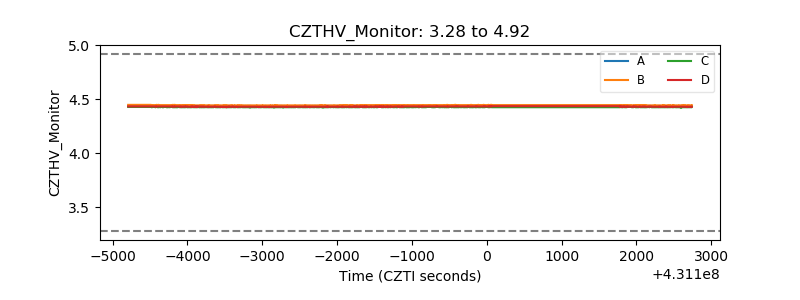 |
| D_VDD | 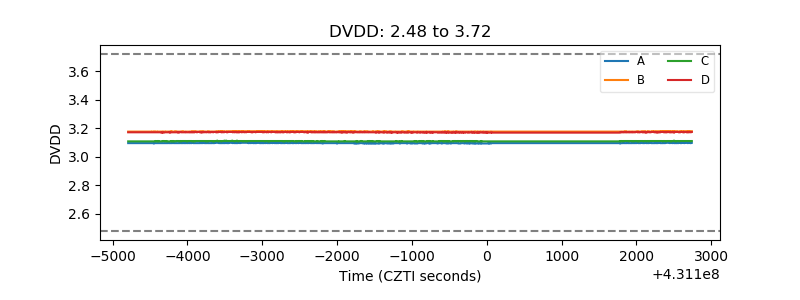 |
| Temperature 1 | 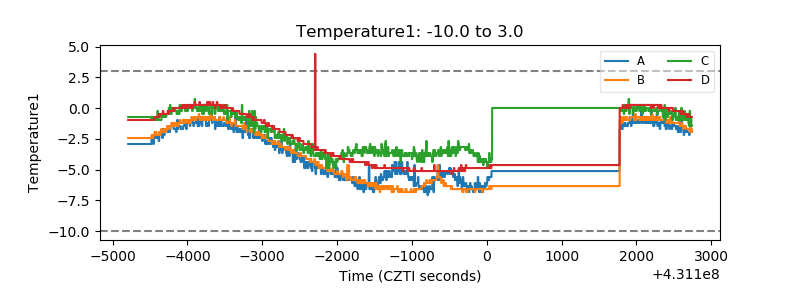 |
| Veto HV Monitor | 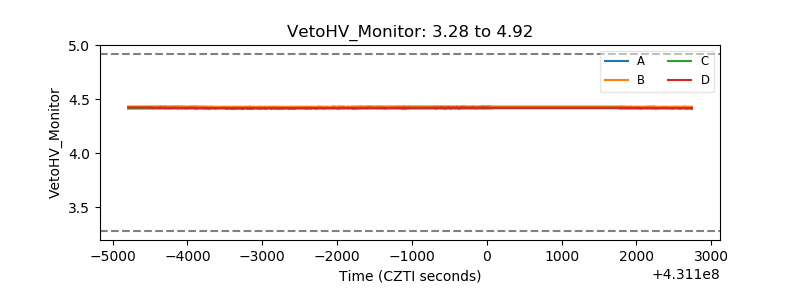 |
| Veto LLD | 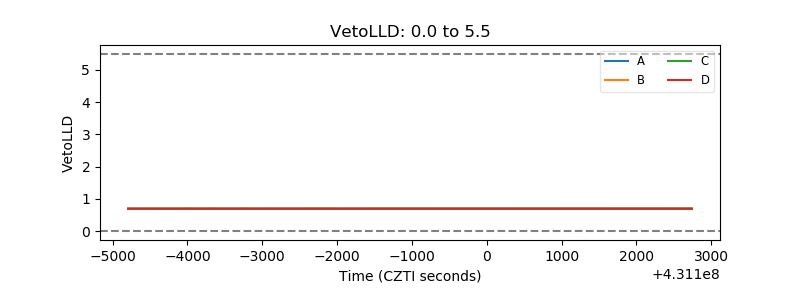 |
| Alpha Counter |  |
| _CPM_Rate | 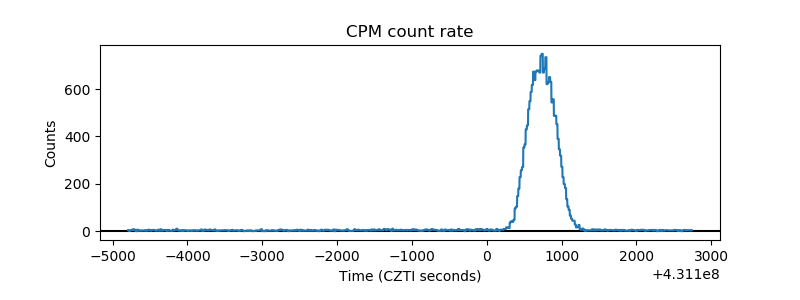 |
| CZT Counter | 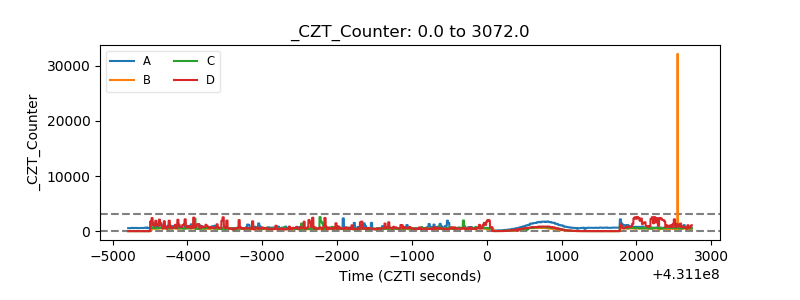 |
| +2.5 Volts monitor | 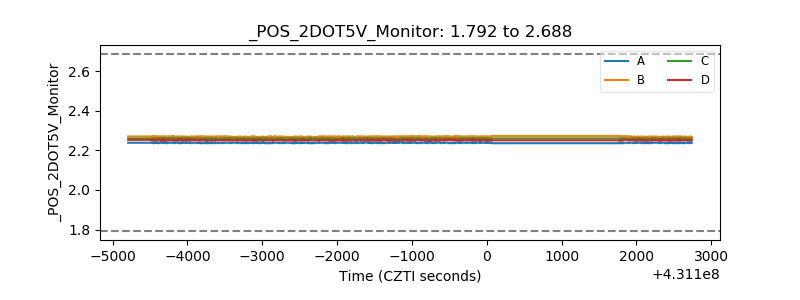 |
| +5 Volts monitor | 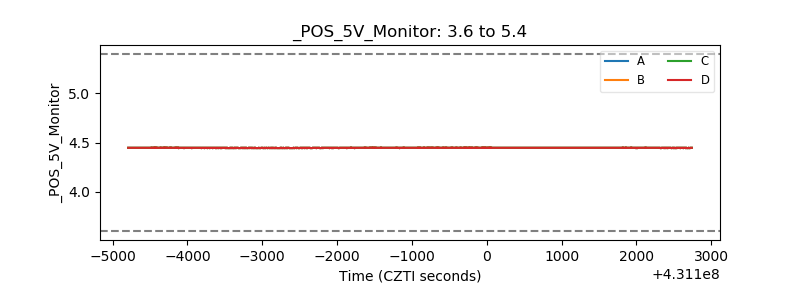 |
| _ROLL_ROT | 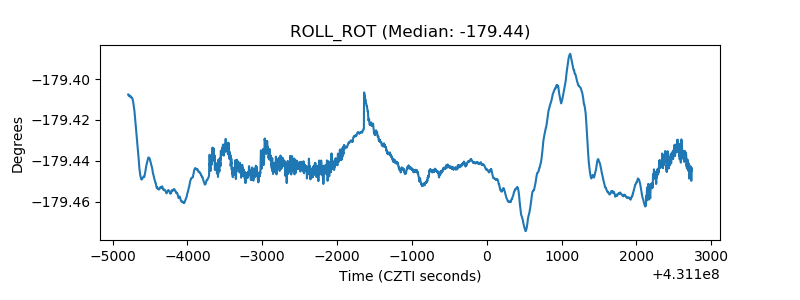 |
| _Roll_DEC | 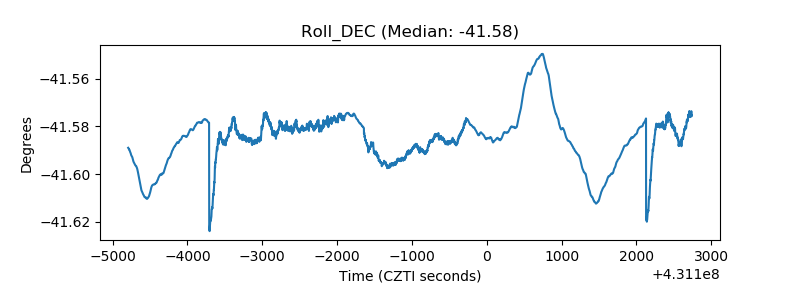 |
| _Roll_RA | 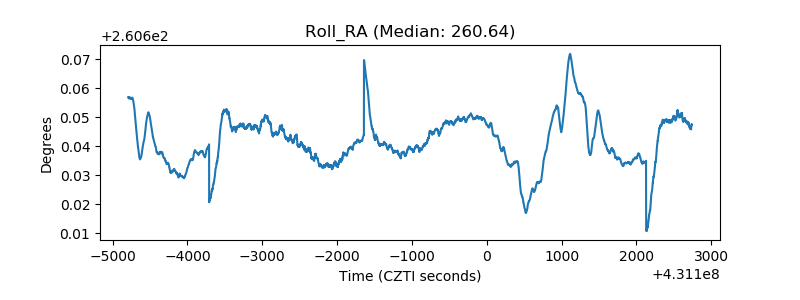 |
| Veto Counter | 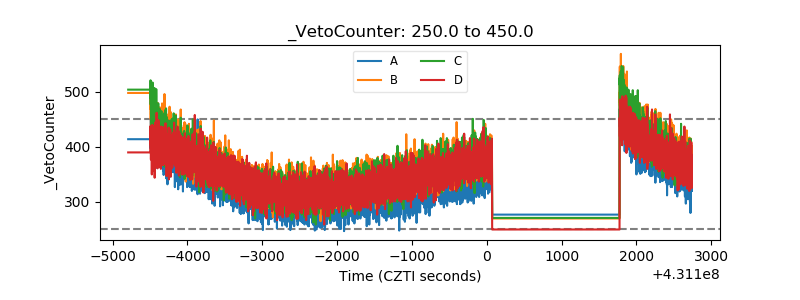 |