| Param | Original file | Final file |
|---|---|---|
| Filename | modeM0/AS1T05_138T01_9000005828_42834cztM0_level2.fits | modeM0/AS1T05_138T01_9000005828_42834cztM0_level2_quad_clean.evt |
| Size (bytes) | 372,971,520 | 90,293,760 |
| Size | 355.7 MB | 86.1 MB |
| Events in quadrant A | 3,805,642 | 592,132 |
| Events in quadrant B | 2,420,581 | 622,790 |
| Events in quadrant C | 2,956,273 | 611,222 |
| Events in quadrant D | 4,209,839 | 535,553 |
| Mode M0 | |||
|---|---|---|---|
| Quadrant | BADHDUFLAG | Total packets | Discarded packets |
| A | 0 | 14883 | 3 |
| B | 0 | 10897 | 2 |
| C | 0 | 12079 | 2 |
| D | 0 | 16206 | 2 |
| Mode M9 | |||
|---|---|---|---|
| Quadrant | BADHDUFLAG | Total packets | Discarded packets |
| A | 0 | 19 | 0 |
| B | 0 | 20 | 0 |
| C | 0 | 20 | 0 |
| D | 0 | 20 | 0 |
| Mode SS | |||
|---|---|---|---|
| Quadrant | BADHDUFLAG | Total packets | Discarded packets |
| A | 0 | 108 | 0 |
| B | 0 | 108 | 0 |
| C | 0 | 108 | 0 |
| D | 0 | 108 | 0 |
| Quadrant | Total seconds | Saturated seconds | Saturation percentage |
|---|---|---|---|
| A | 5319 | 182 | 3.421696% |
| B | 5319 | 10 | 0.188005% |
| C | 5319 | 60 | 1.128032% |
| D | 5319 | 317 | 5.959767% |
Noise dominated data is calculated using 1-second bins in cleaned event files. If a bin has >2000 counts, and if more than 50% of those come from <1% of pixels, then it is considered to be noise-dominated and hence unusable.
| Quadrant | # 1 sec bins | Bins with >0 counts | Bins with >2000 counts | High rate bins dominated by noise | Noise dominated (total time) | Noise dominated (detector-on time) | Marked lightcurve |
|---|---|---|---|---|---|---|---|
| A | 7142 | 5320 | 151 | 151 | 2.11% | 2.84% | 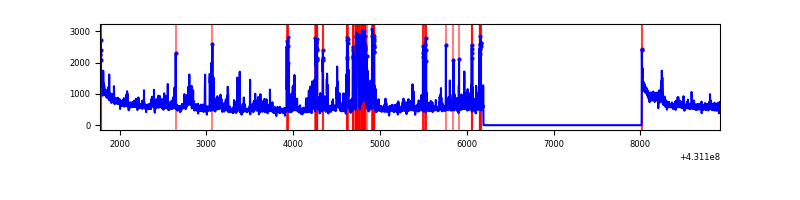 |
| B | 7142 | 5320 | 7 | 7 | 0.10% | 0.13% | 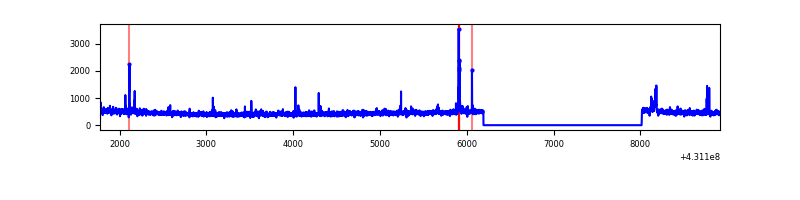 |
| C | 7142 | 5320 | 49 | 49 | 0.69% | 0.92% | 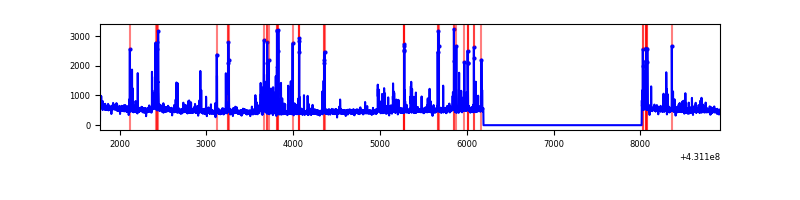 |
| D | 7142 | 5320 | 304 | 304 | 4.26% | 5.71% | 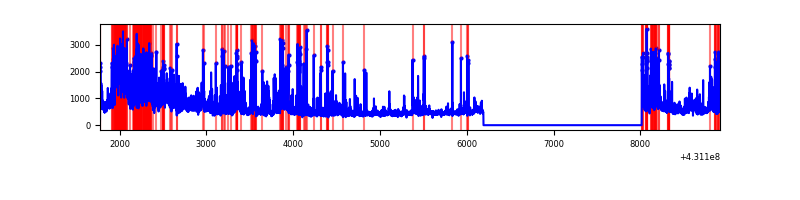 |
Top three noisy pixels from each quadrant. If the there are fewer than three noisy pixels in the level2.evt file, extra rows are filled as -1
| Pixel properties | Quadrant properties | ||||||
|---|---|---|---|---|---|---|---|
| Quadrant | DetID | PixID | Counts | Sigma | Mean | Median | Sigma |
| A | 10 | 83 | 629630 | 5237.17 | 583 | 571 | 120.1 |
| A | 12 | 189 | 612815 | 5097.18 | 583 | 571 | 120.1 |
| A | 15 | 222 | 192338 | 1596.54 | 583 | 571 | 120.1 |
| B | 0 | 190 | 34840 | 300.27 | 589 | 573 | 114.1 |
| B | 0 | 245 | 27847 | 239.0 | 589 | 573 | 114.1 |
| B | 0 | 156 | 21179 | 180.57 | 589 | 573 | 114.1 |
| C | 14 | 254 | 354585 | 2614.2 | 574 | 577 | 135.4 |
| C | 15 | 214 | 218437 | 1608.8 | 574 | 577 | 135.4 |
| C | 3 | 233 | 85652 | 628.24 | 574 | 577 | 135.4 |
| D | 1 | 52 | 1162750 | 8455.01 | 560 | 544 | 137.5 |
| D | 12 | 233 | 265679 | 1928.85 | 560 | 544 | 137.5 |
| D | 10 | 118 | 243527 | 1767.69 | 560 | 544 | 137.5 |
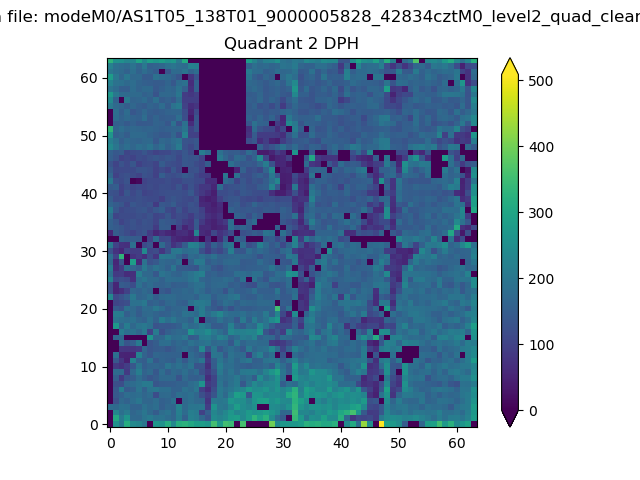
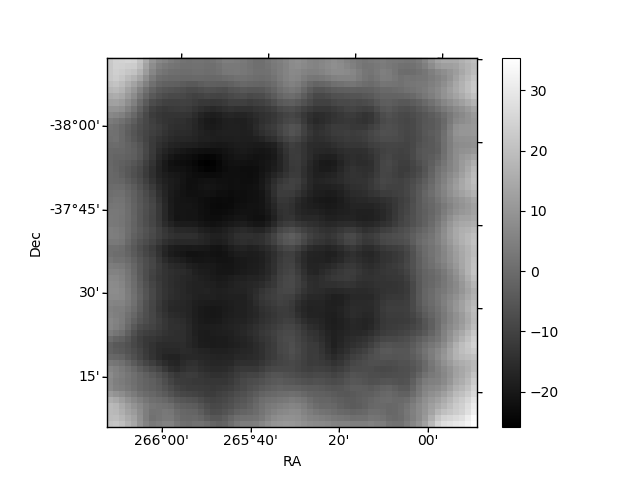
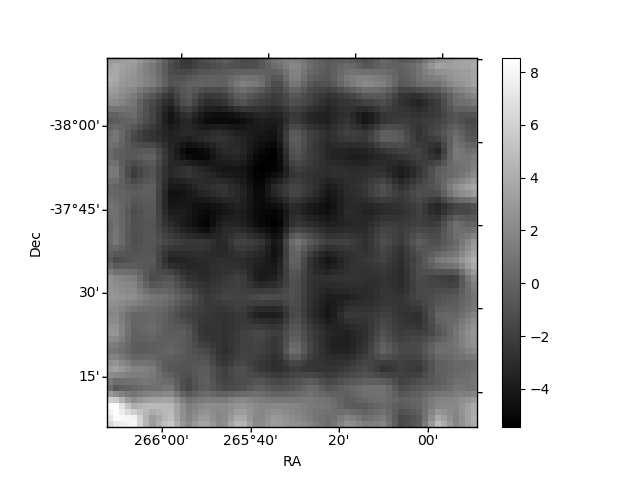
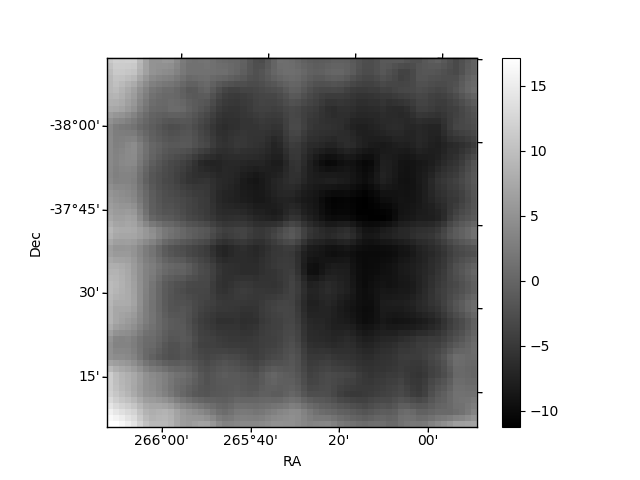
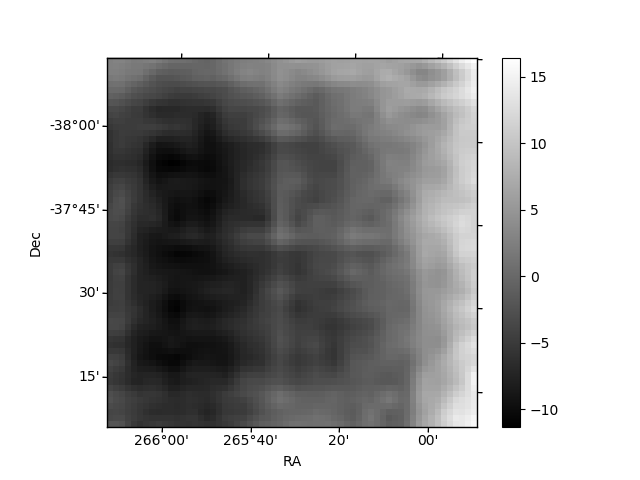
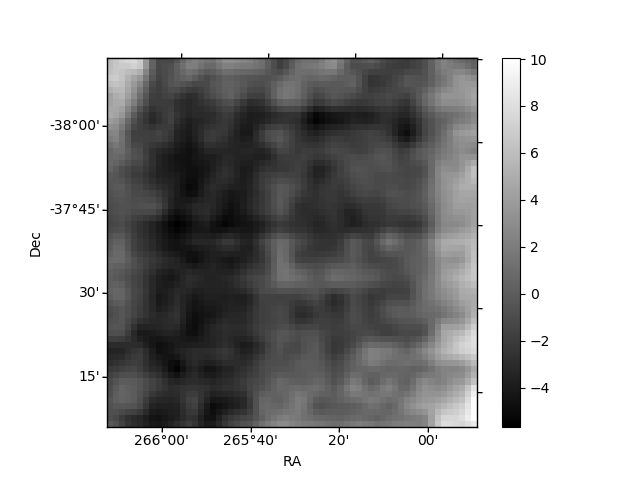
Histogram calculated using DETX and DETY for each event in the final _common_clean file
| Quadrant A | 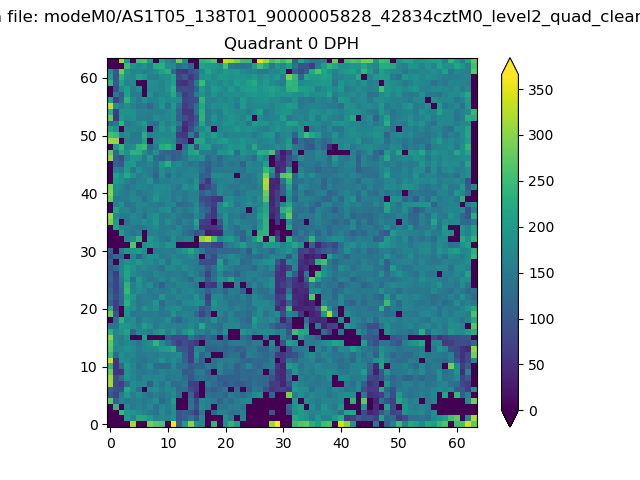 |
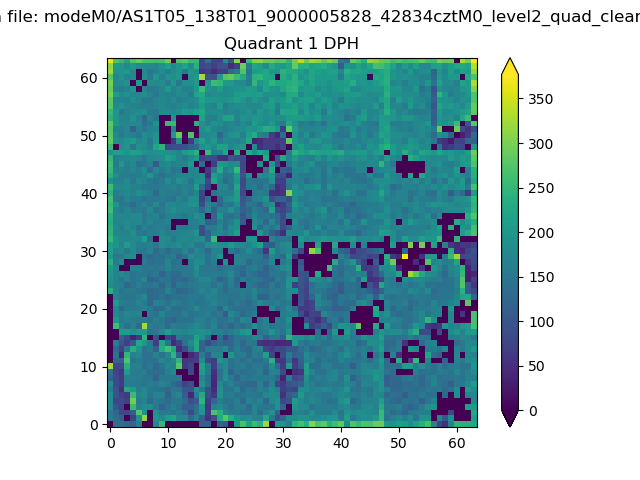 |
Quadrant B |
|---|---|---|---|
| Quadrant D | 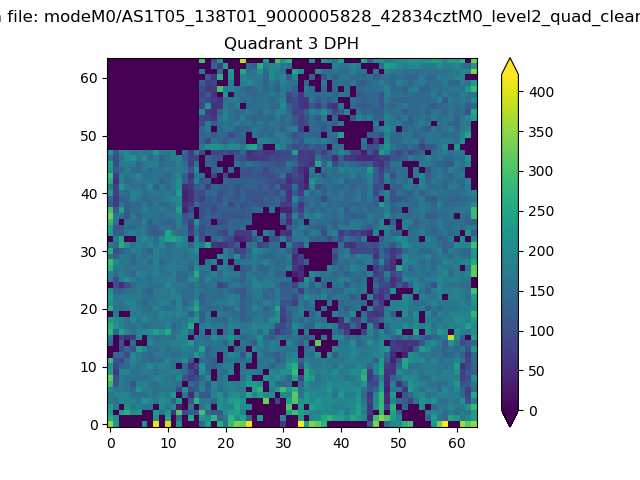 |
 |
Quadrant C |
| Plot type | Count rate plots | Images |
|---|---|---|
| Comparison with Poisson distribution Blue bars denote a histogram of data divided into 1 sec bins. Red curve is a Poisson curve with rate = median count rate of data. |
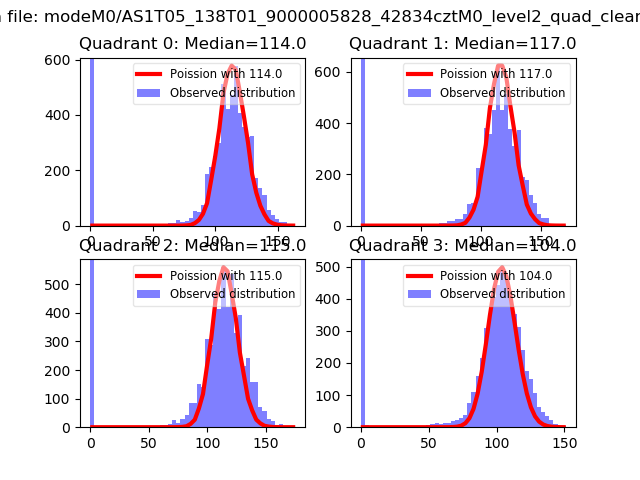 |
 |
| Quadrant-wise count rates Data is divided into 100 sec bins |
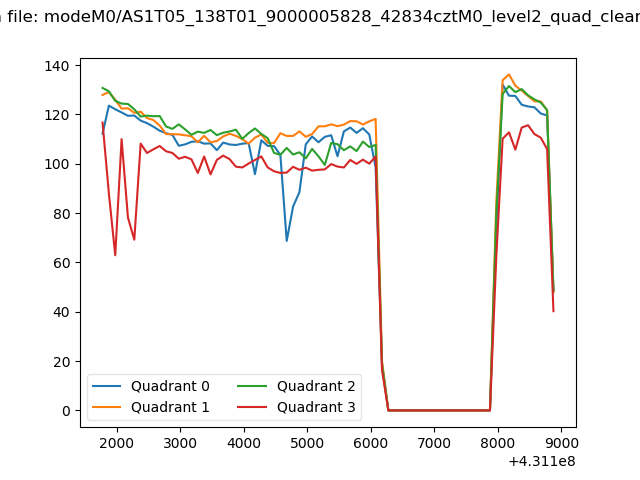 |
|
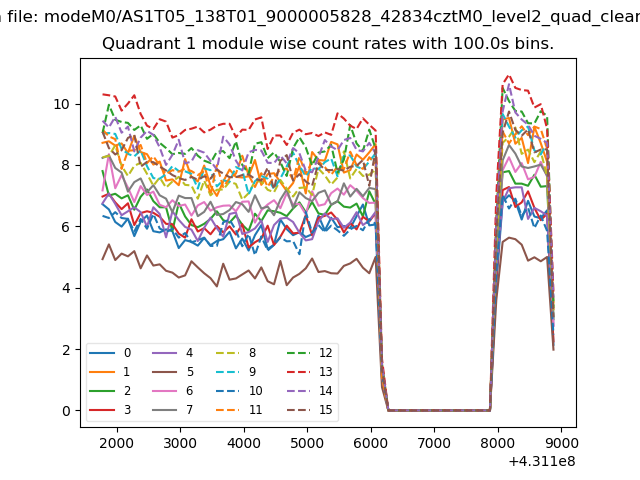
| Module-wise count rates for Quadrant A Data is divided into 100 sec bins |
 |
 |
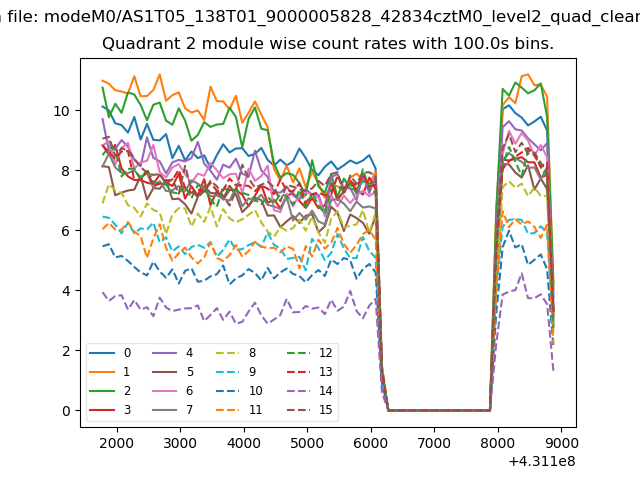
| Module-wise count rates for Quadrant B Data is divided into 100 sec bins |
 |
 |
| Module-wise count rates for Quadrant C Data is divided into 100 sec bins |
 |
 |
| Module-wise count rates for Quadrant D Data is divided into 100 sec bins |
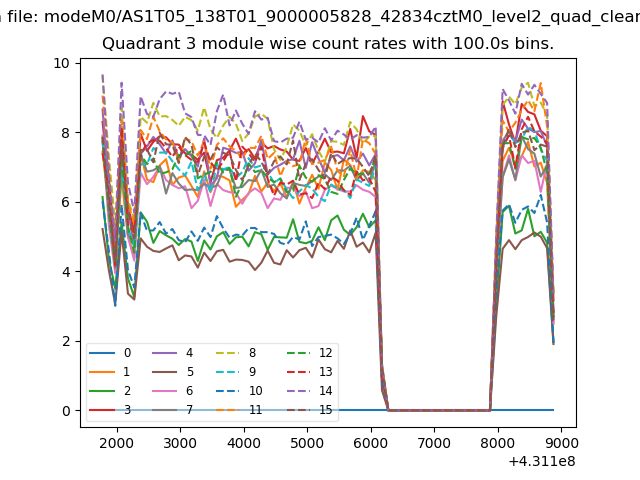 |
 |
| Parameter | Plot |
|---|---|
| CZT HV Monitor | 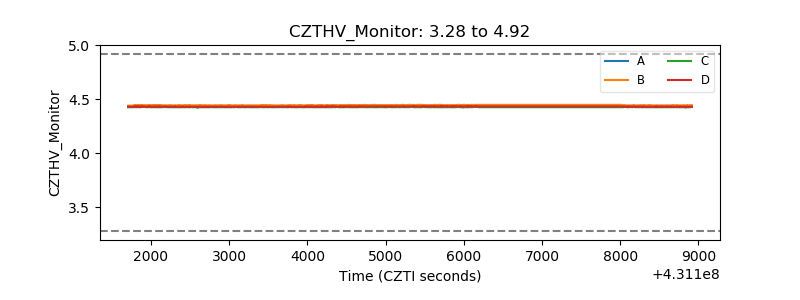 |
| D_VDD | 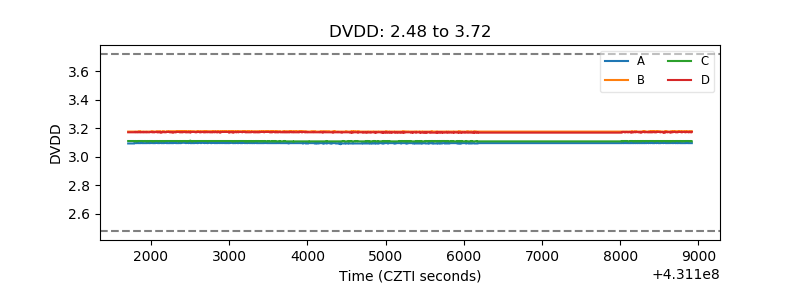 |
| Temperature 1 | 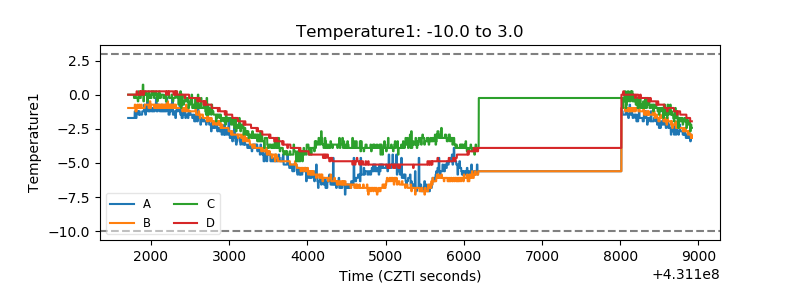 |
| Veto HV Monitor | 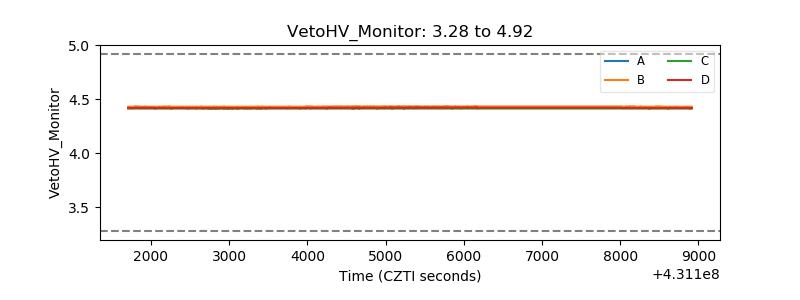 |
| Veto LLD | 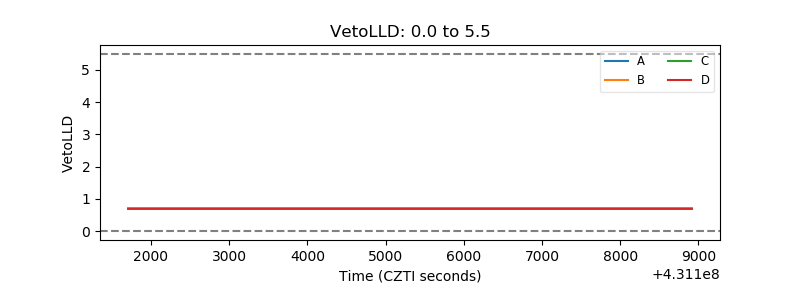 |
| Alpha Counter | 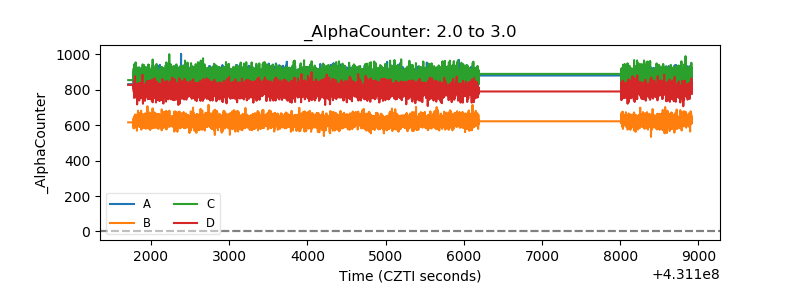 |
| _CPM_Rate |  |
| CZT Counter | 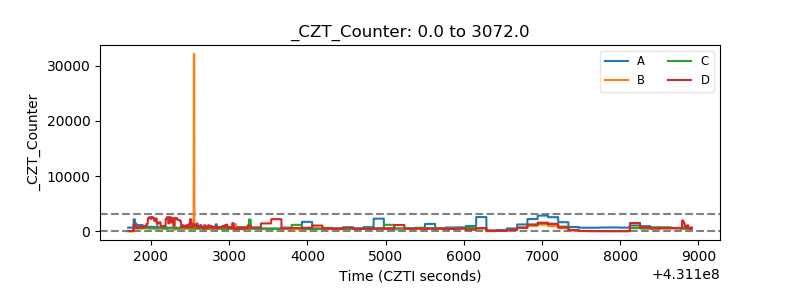 |
| +2.5 Volts monitor | 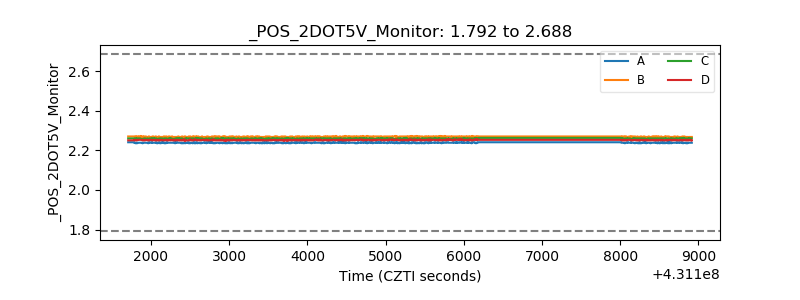 |
| +5 Volts monitor |  |
| _ROLL_ROT | 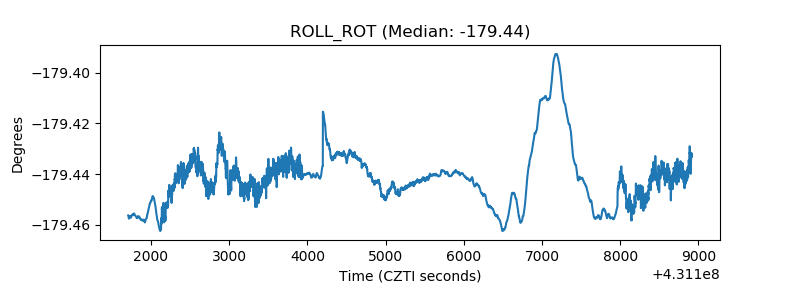 |
| _Roll_DEC | 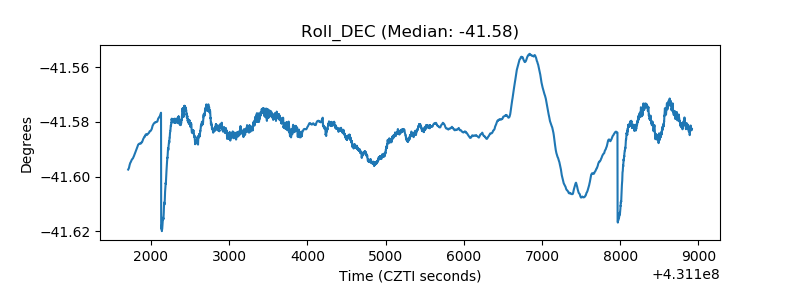 |
| _Roll_RA | 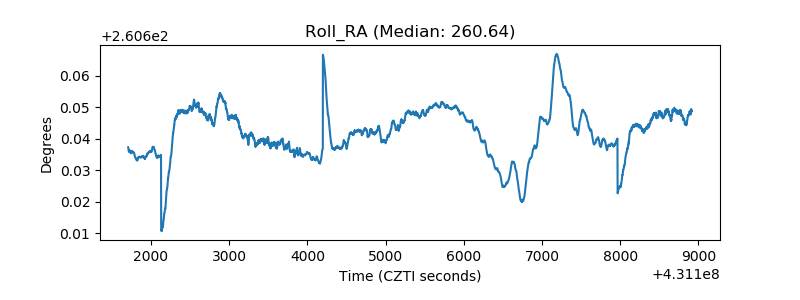 |
| Veto Counter | 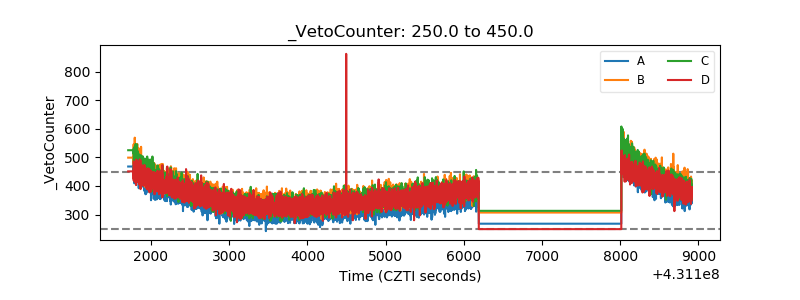 |