| Param | Original file | Final file |
|---|---|---|
| Filename | modeM0/AS1T05_138T01_9000005828_42835cztM0_level2.fits | modeM0/AS1T05_138T01_9000005828_42835cztM0_level2_quad_clean.evt |
| Size (bytes) | 335,473,920 | 90,996,480 |
| Size | 319.9 MB | 86.8 MB |
| Events in quadrant A | 3,135,883 | 606,238 |
| Events in quadrant B | 2,354,750 | 629,836 |
| Events in quadrant C | 2,900,996 | 611,233 |
| Events in quadrant D | 3,620,505 | 542,800 |
| Mode M0 | |||
|---|---|---|---|
| Quadrant | BADHDUFLAG | Total packets | Discarded packets |
| A | 0 | 12506 | 2 |
| B | 0 | 10556 | 2 |
| C | 0 | 11816 | 2 |
| D | 0 | 14309 | 2 |
| Mode M9 | |||
|---|---|---|---|
| Quadrant | BADHDUFLAG | Total packets | Discarded packets |
| A | 0 | 27 | 0 |
| B | 0 | 28 | 0 |
| C | 0 | 28 | 0 |
| D | 0 | 28 | 0 |
| Mode SS | |||
|---|---|---|---|
| Quadrant | BADHDUFLAG | Total packets | Discarded packets |
| A | 0 | 106 | 0 |
| B | 0 | 106 | 0 |
| C | 0 | 106 | 0 |
| D | 0 | 106 | 0 |
| Quadrant | Total seconds | Saturated seconds | Saturation percentage |
|---|---|---|---|
| A | 5215 | 33 | 0.632790% |
| B | 5215 | 6 | 0.115053% |
| C | 5215 | 37 | 0.709492% |
| D | 5215 | 177 | 3.394056% |
Noise dominated data is calculated using 1-second bins in cleaned event files. If a bin has >2000 counts, and if more than 50% of those come from <1% of pixels, then it is considered to be noise-dominated and hence unusable.
| Quadrant | # 1 sec bins | Bins with >0 counts | Bins with >2000 counts | High rate bins dominated by noise | Noise dominated (total time) | Noise dominated (detector-on time) | Marked lightcurve |
|---|---|---|---|---|---|---|---|
| A | 7158 | 5216 | 18 | 18 | 0.25% | 0.35% | 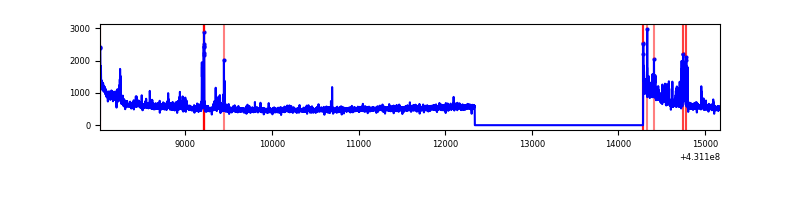 |
| B | 7158 | 5216 | 0 | 0 | 0.00% | 0.00% | 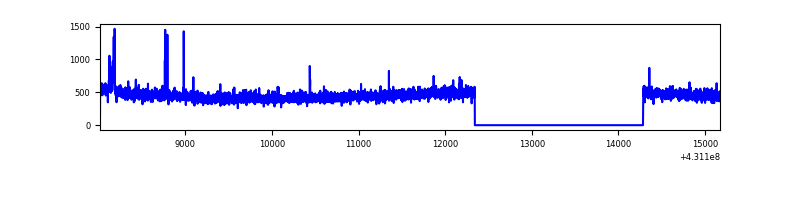 |
| C | 7158 | 5216 | 30 | 30 | 0.42% | 0.58% | 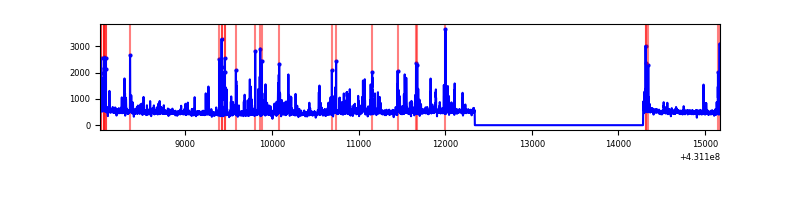 |
| D | 7158 | 5216 | 173 | 173 | 2.42% | 3.32% | 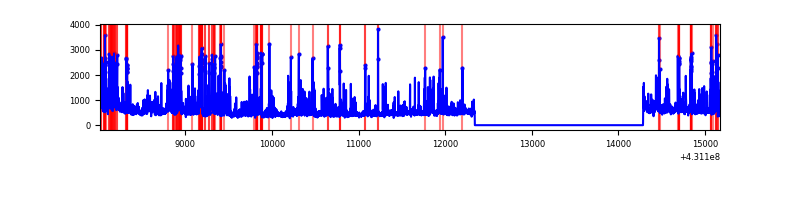 |
Top three noisy pixels from each quadrant. If the there are fewer than three noisy pixels in the level2.evt file, extra rows are filled as -1
| Pixel properties | Quadrant properties | ||||||
|---|---|---|---|---|---|---|---|
| Quadrant | DetID | PixID | Counts | Sigma | Mean | Median | Sigma |
| A | 10 | 83 | 614463 | 5085.45 | 583 | 572 | 120.7 |
| A | 15 | 222 | 181230 | 1496.56 | 583 | 572 | 120.7 |
| A | 12 | 189 | 56163 | 460.51 | 583 | 572 | 120.7 |
| B | 0 | 190 | 44511 | 392.13 | 585 | 569 | 112.1 |
| B | 12 | 111 | 13635 | 116.6 | 585 | 569 | 112.1 |
| B | 11 | 111 | 12459 | 106.11 | 585 | 569 | 112.1 |
| C | 14 | 254 | 343729 | 2573.34 | 569 | 575 | 133.3 |
| C | 15 | 214 | 213185 | 1594.38 | 569 | 575 | 133.3 |
| C | 7 | 220 | 81758 | 608.8 | 569 | 575 | 133.3 |
| D | 1 | 52 | 722625 | 5312.71 | 558 | 545 | 135.9 |
| D | 10 | 118 | 185564 | 1361.28 | 558 | 545 | 135.9 |
| D | 1 | 47 | 108595 | 794.98 | 558 | 545 | 135.9 |
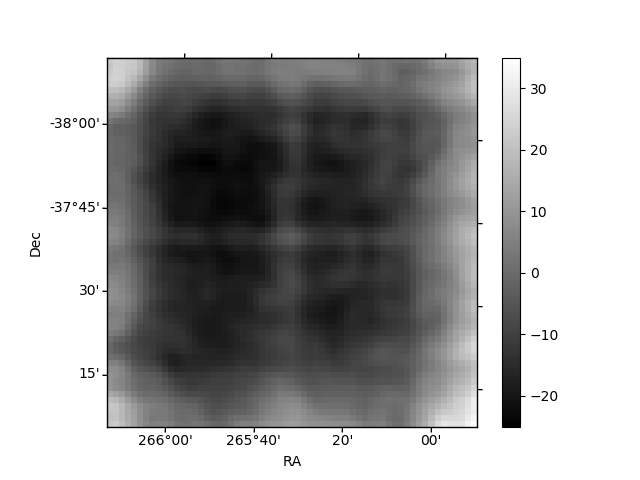
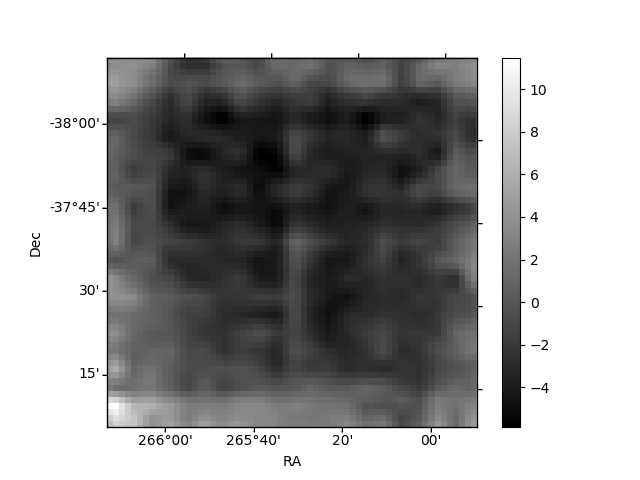
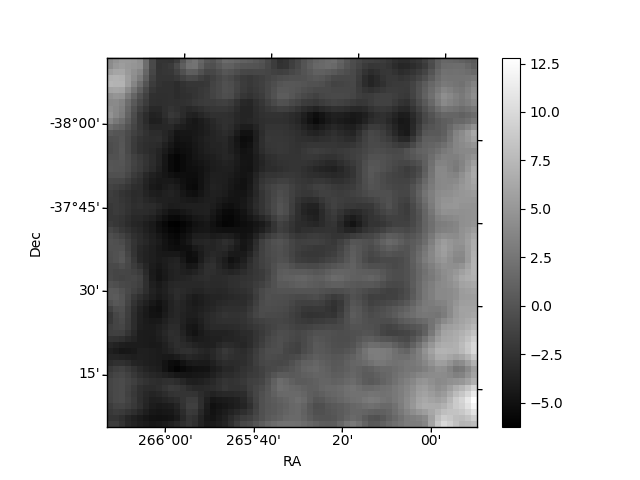
Histogram calculated using DETX and DETY for each event in the final _common_clean file
| Quadrant A | 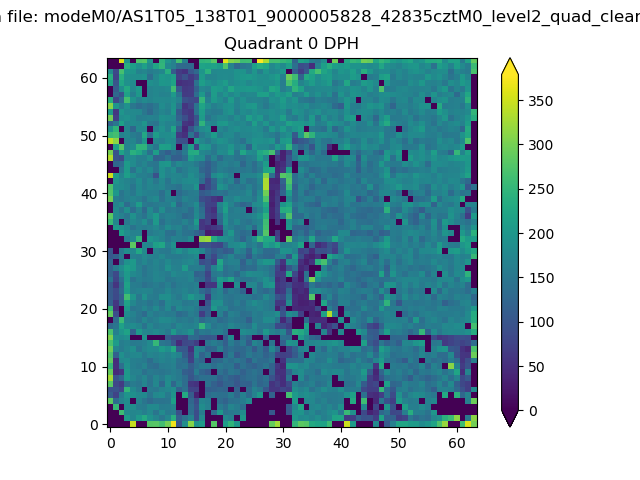 |
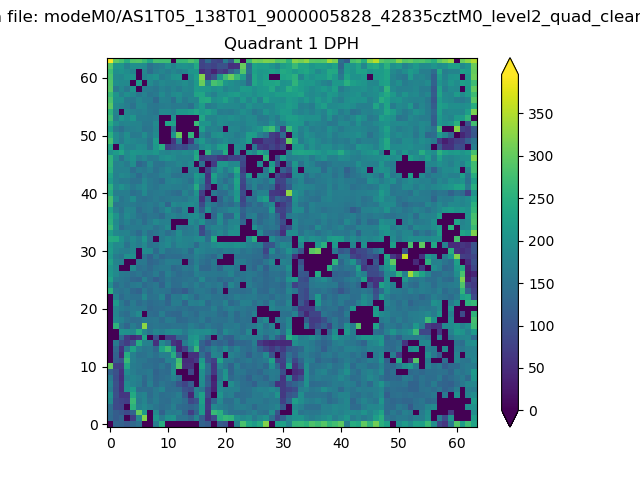 |
Quadrant B |
|---|---|---|---|
| Quadrant D | 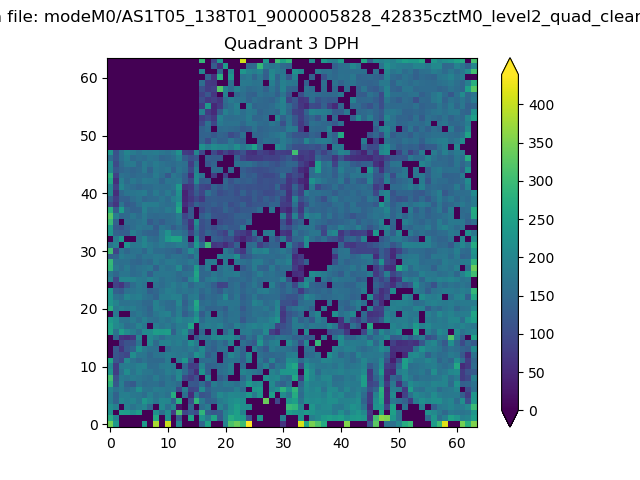 |
 |
Quadrant C |
| Plot type | Count rate plots | Images |
|---|---|---|
| Comparison with Poisson distribution Blue bars denote a histogram of data divided into 1 sec bins. Red curve is a Poisson curve with rate = median count rate of data. |
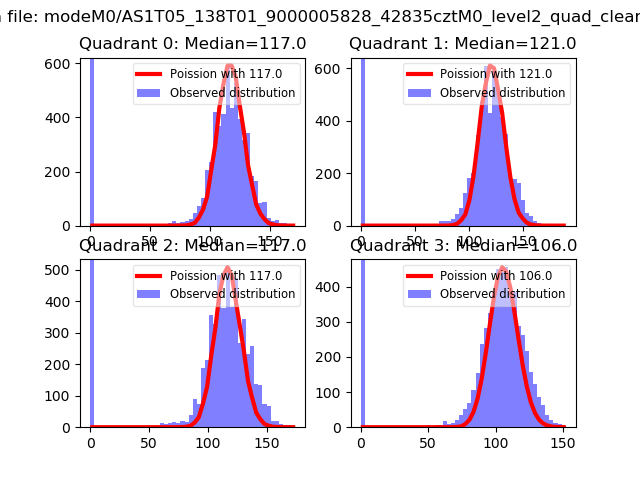 |
 |
| Quadrant-wise count rates Data is divided into 100 sec bins |
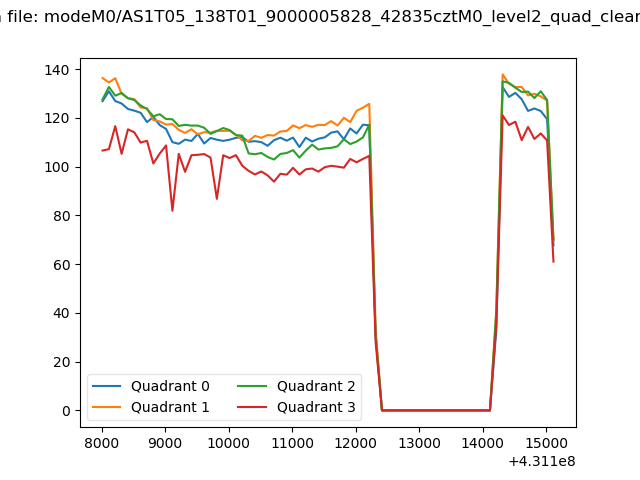 |
|
| Module-wise count rates for Quadrant A Data is divided into 100 sec bins |
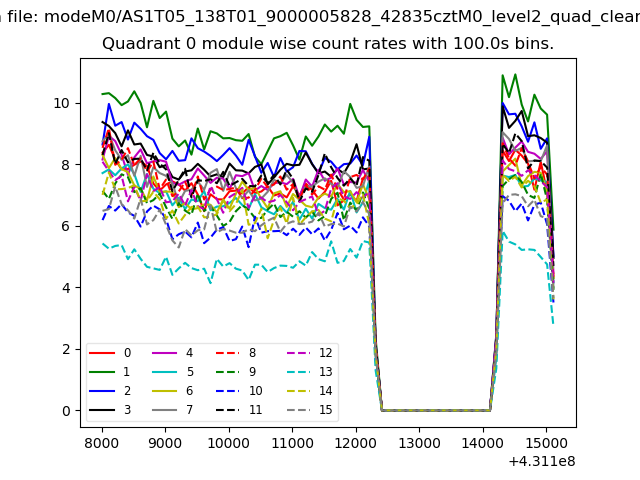 |
 |
| Module-wise count rates for Quadrant B Data is divided into 100 sec bins |
 |
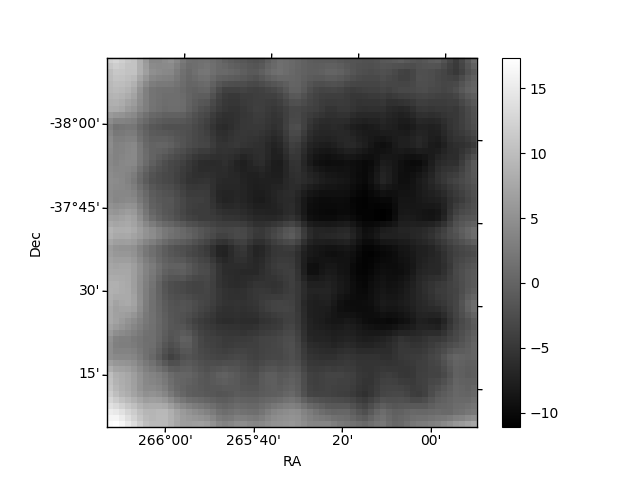 |
| Module-wise count rates for Quadrant C Data is divided into 100 sec bins |
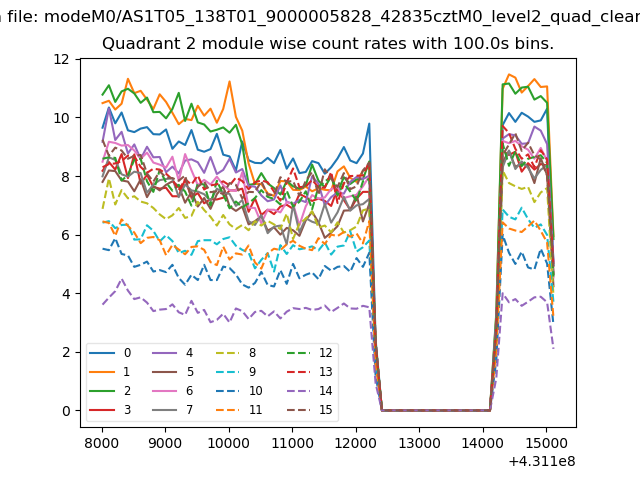 |
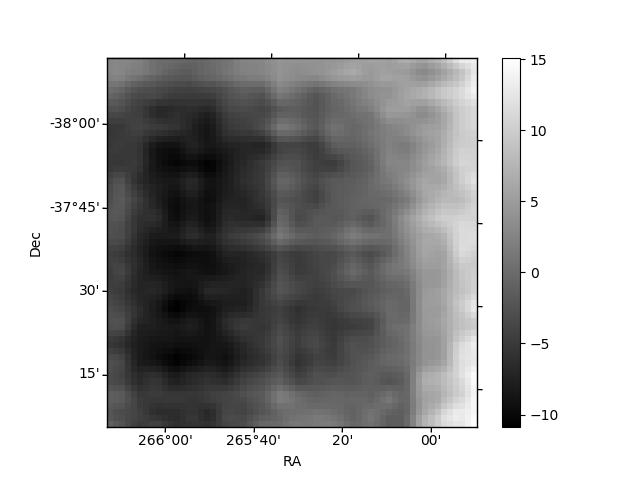 |
| Module-wise count rates for Quadrant D Data is divided into 100 sec bins |
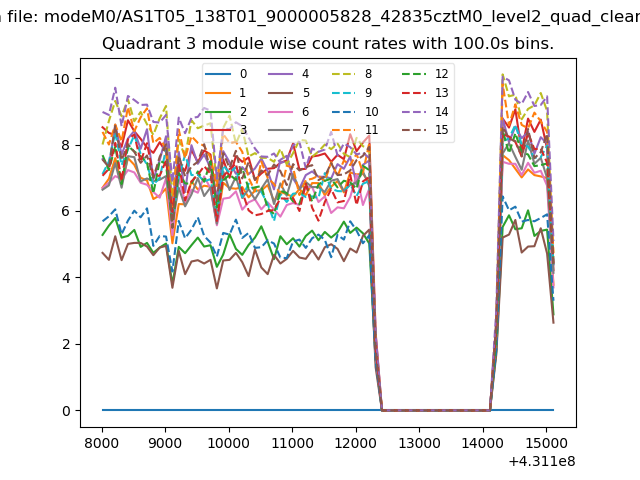 |
 |
| Parameter | Plot |
|---|---|
| CZT HV Monitor | 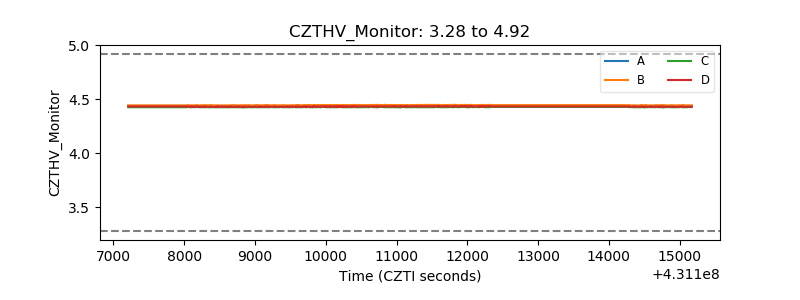 |
| D_VDD | 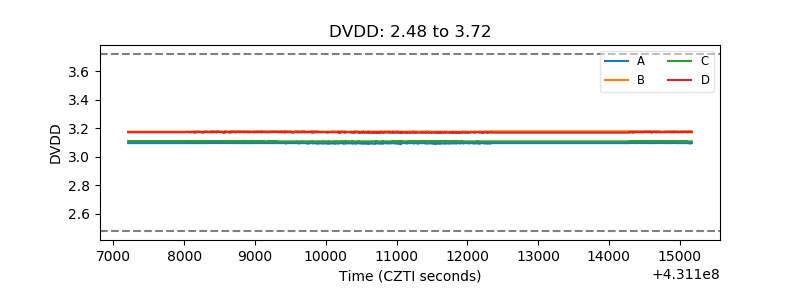 |
| Temperature 1 | 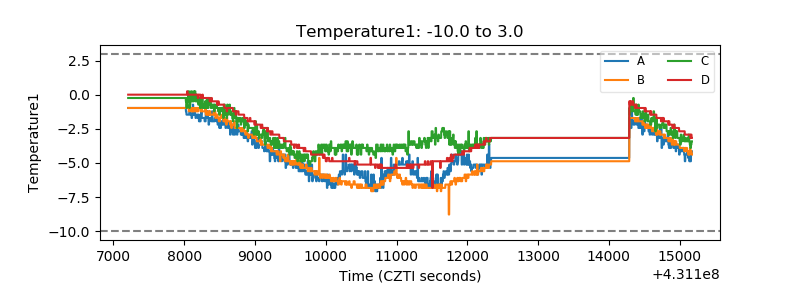 |
| Veto HV Monitor | 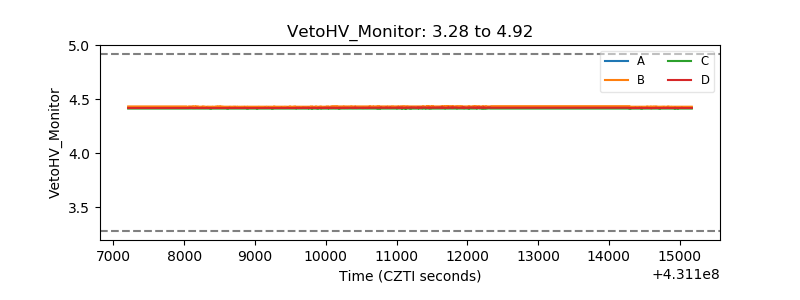 |
| Veto LLD | 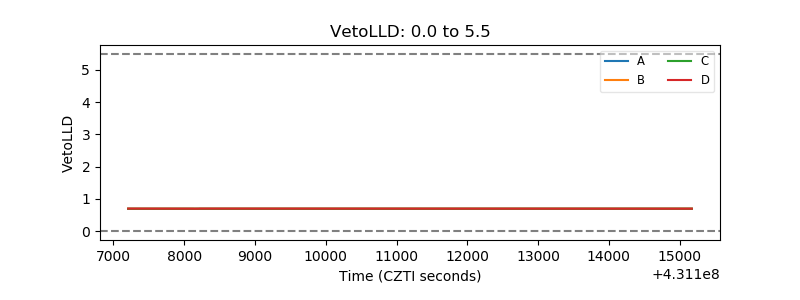 |
| Alpha Counter | 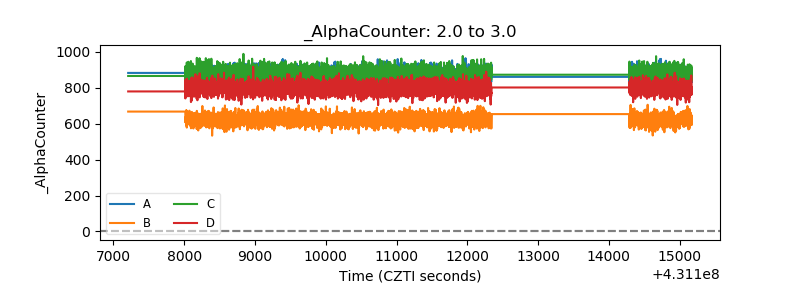 |
| _CPM_Rate | 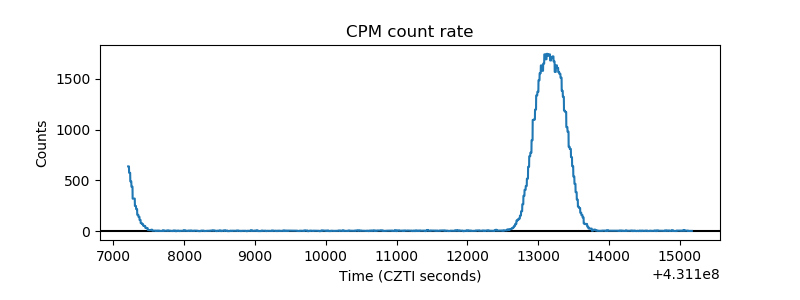 |
| CZT Counter | 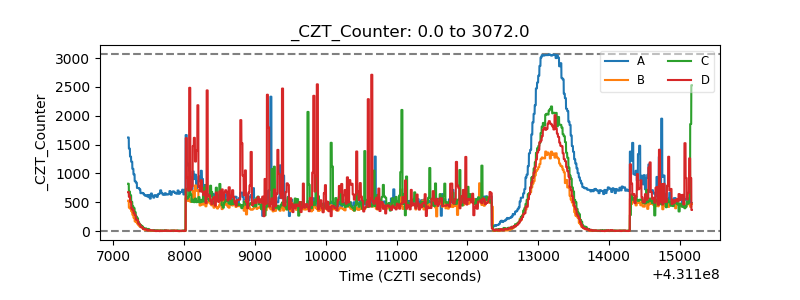 |
| +2.5 Volts monitor | 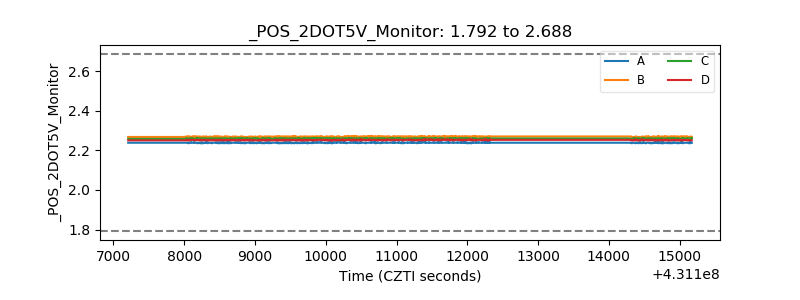 |
| +5 Volts monitor | 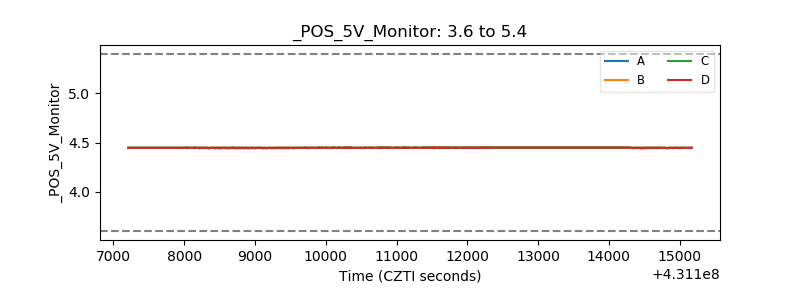 |
| _ROLL_ROT | 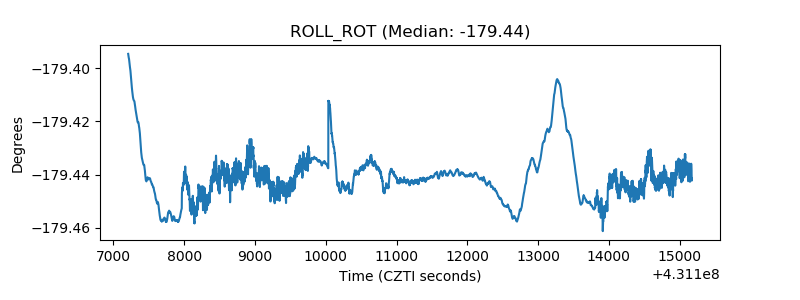 |
| _Roll_DEC | 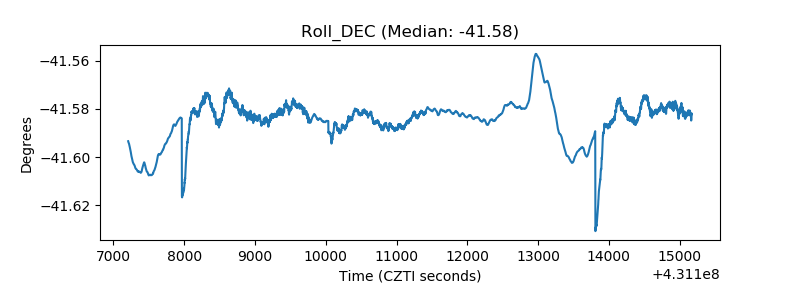 |
| _Roll_RA | 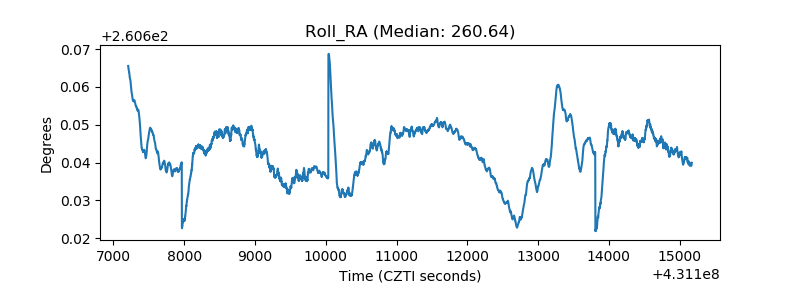 |
| Veto Counter | 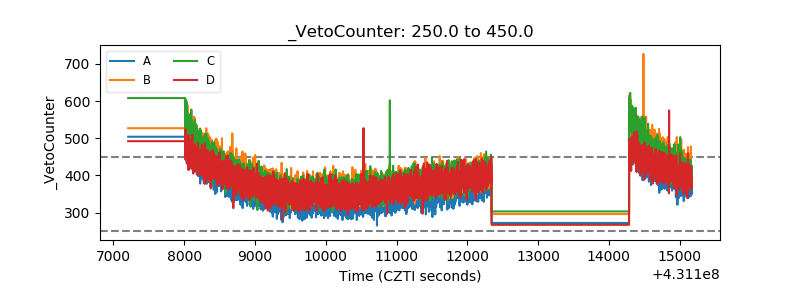 |