| Param | Original file | Final file |
|---|---|---|
| Filename | modeM0/AS1T05_138T01_9000005828_42836cztM0_level2.fits | modeM0/AS1T05_138T01_9000005828_42836cztM0_level2_quad_clean.evt |
| Size (bytes) | 329,495,040 | 88,182,720 |
| Size | 314.2 MB | 84.1 MB |
| Events in quadrant A | 3,197,866 | 591,058 |
| Events in quadrant B | 2,296,453 | 611,924 |
| Events in quadrant C | 2,997,690 | 589,423 |
| Events in quadrant D | 3,315,413 | 527,073 |
| Mode M0 | |||
|---|---|---|---|
| Quadrant | BADHDUFLAG | Total packets | Discarded packets |
| A | 0 | 12674 | 2 |
| B | 0 | 10212 | 2 |
| C | 0 | 11990 | 2 |
| D | 0 | 13216 | 14 |
| Mode M9 | |||
|---|---|---|---|
| Quadrant | BADHDUFLAG | Total packets | Discarded packets |
| A | 0 | 33 | 0 |
| B | 0 | 34 | 0 |
| C | 0 | 34 | 0 |
| D | 0 | 34 | 0 |
| Mode SS | |||
|---|---|---|---|
| Quadrant | BADHDUFLAG | Total packets | Discarded packets |
| A | 0 | 102 | 0 |
| B | 0 | 102 | 0 |
| C | 0 | 102 | 0 |
| D | 0 | 102 | 0 |
| Quadrant | Total seconds | Saturated seconds | Saturation percentage |
|---|---|---|---|
| A | 5004 | 27 | 0.539568% |
| B | 5004 | 22 | 0.439648% |
| C | 5003 | 78 | 1.559065% |
| D | 5001 | 128 | 2.559488% |
Noise dominated data is calculated using 1-second bins in cleaned event files. If a bin has >2000 counts, and if more than 50% of those come from <1% of pixels, then it is considered to be noise-dominated and hence unusable.
| Quadrant | # 1 sec bins | Bins with >0 counts | Bins with >2000 counts | High rate bins dominated by noise | Noise dominated (total time) | Noise dominated (detector-on time) | Marked lightcurve |
|---|---|---|---|---|---|---|---|
| A | 7067 | 5005 | 12 | 12 | 0.17% | 0.24% | 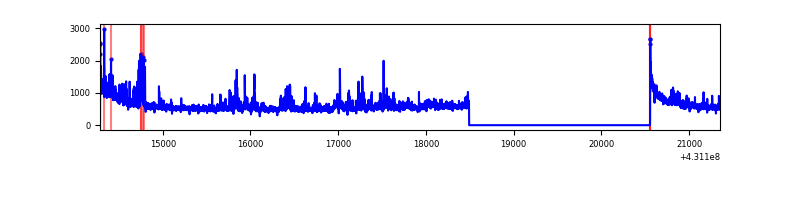 |
| B | 7067 | 5005 | 13 | 13 | 0.18% | 0.26% | 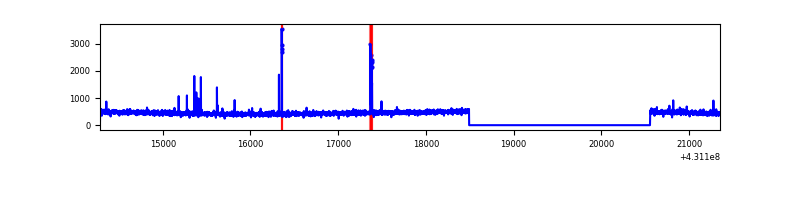 |
| C | 7066 | 5004 | 69 | 69 | 0.98% | 1.38% | 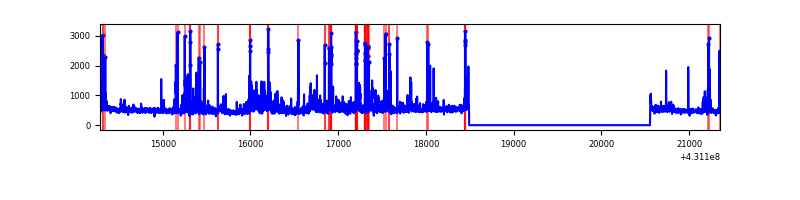 |
| D | 7066 | 5003 | 142 | 142 | 2.01% | 2.84% | 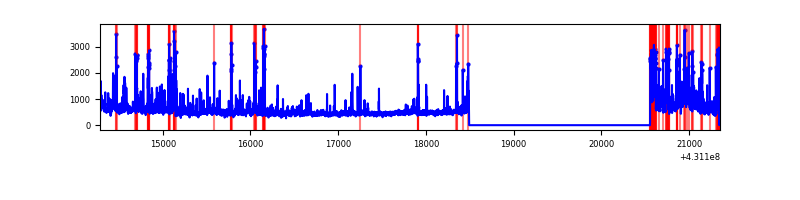 |
Top three noisy pixels from each quadrant. If the there are fewer than three noisy pixels in the level2.evt file, extra rows are filled as -1
| Pixel properties | Quadrant properties | ||||||
|---|---|---|---|---|---|---|---|
| Quadrant | DetID | PixID | Counts | Sigma | Mean | Median | Sigma |
| A | 10 | 83 | 581020 | 5001.36 | 564 | 554 | 116.1 |
| A | 15 | 222 | 259655 | 2232.44 | 564 | 554 | 116.1 |
| A | 12 | 189 | 142771 | 1225.36 | 564 | 554 | 116.1 |
| B | 3 | 112 | 35721 | 322.78 | 565 | 552 | 109.0 |
| B | 5 | 207 | 14530 | 128.29 | 565 | 552 | 109.0 |
| B | 5 | 172 | 13732 | 120.97 | 565 | 552 | 109.0 |
| C | 14 | 254 | 374311 | 2899.34 | 548 | 552 | 128.9 |
| C | 7 | 220 | 233343 | 1805.82 | 548 | 552 | 128.9 |
| C | 15 | 214 | 203036 | 1570.72 | 548 | 552 | 128.9 |
| D | 1 | 52 | 511915 | 3942.96 | 537 | 523 | 129.7 |
| D | 14 | 49 | 231792 | 1783.14 | 537 | 523 | 129.7 |
| D | 13 | 249 | 183648 | 1411.94 | 537 | 523 | 129.7 |
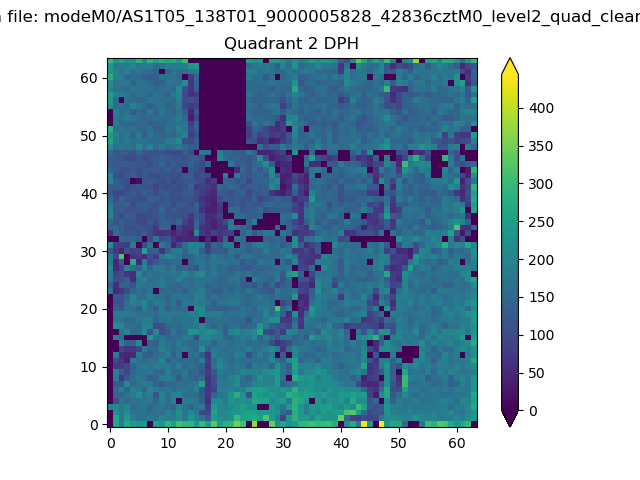
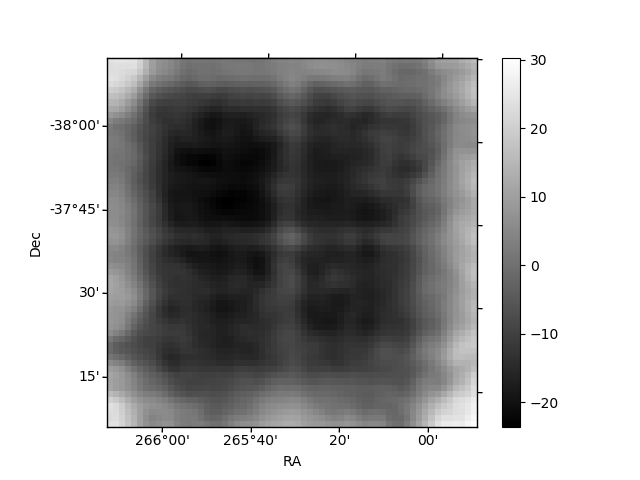
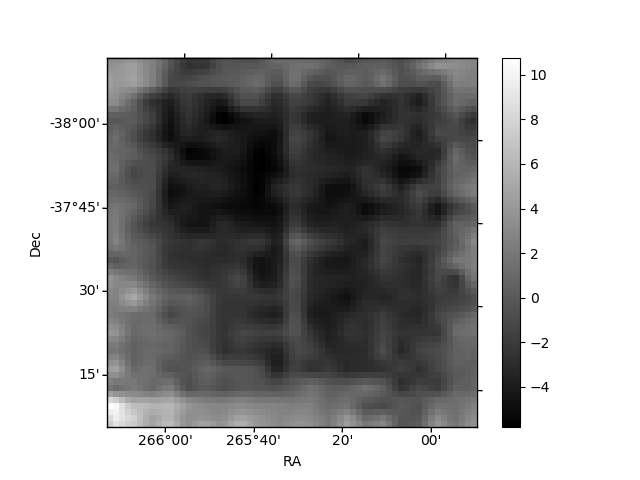
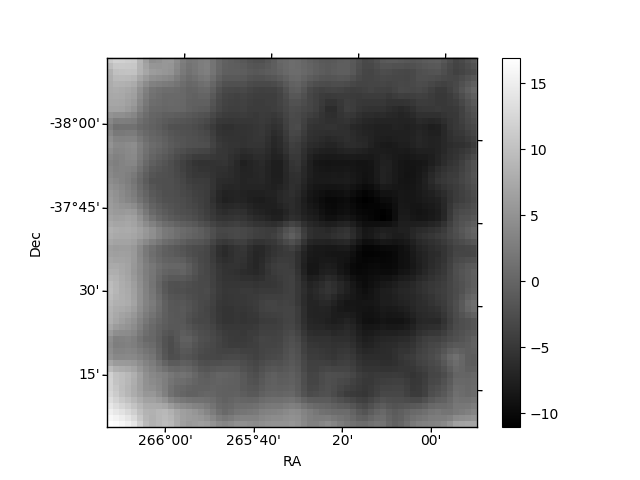
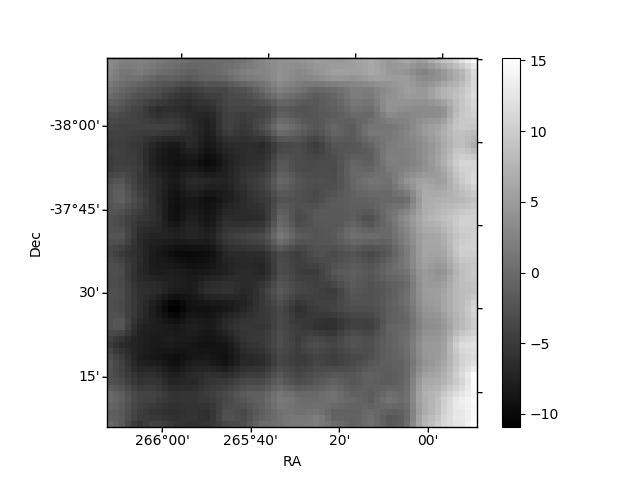
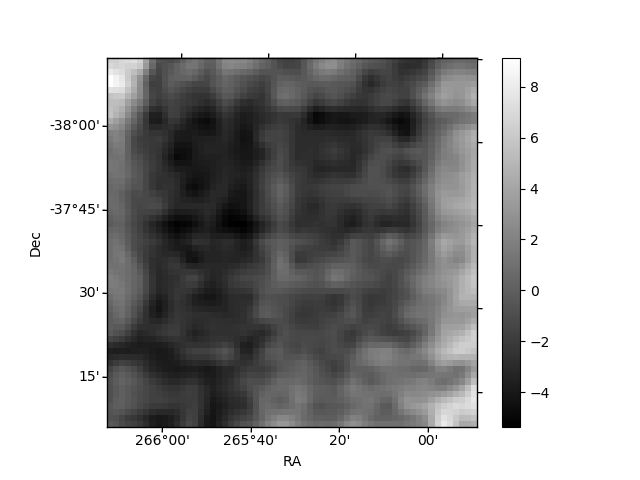
Histogram calculated using DETX and DETY for each event in the final _common_clean file
| Quadrant A | 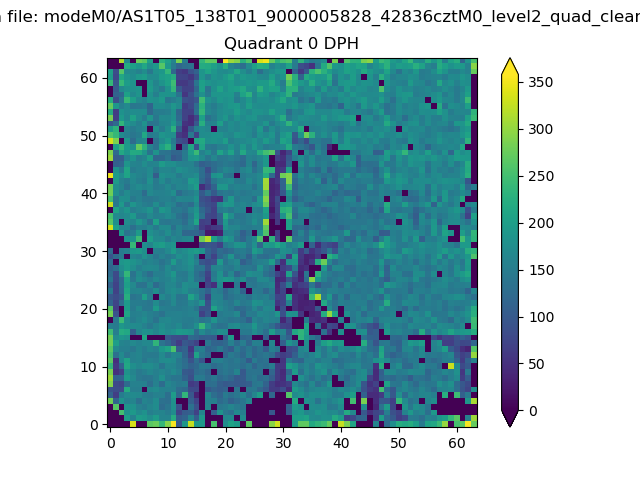 |
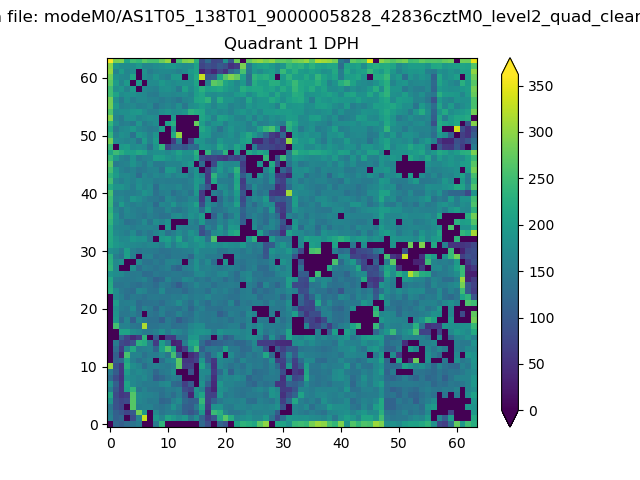 |
Quadrant B |
|---|---|---|---|
| Quadrant D | 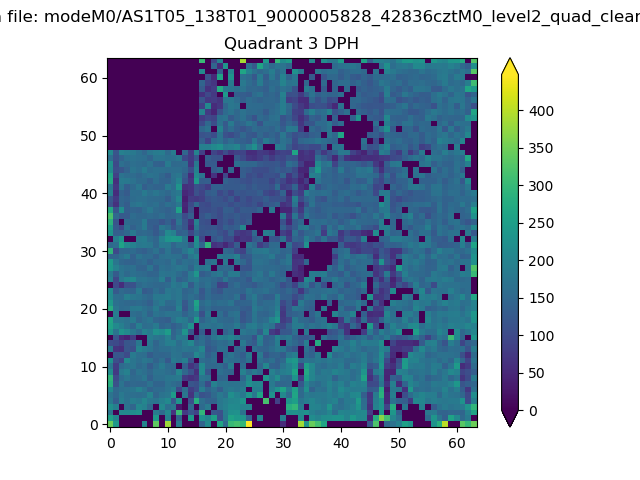 |
 |
Quadrant C |
| Plot type | Count rate plots | Images |
|---|---|---|
| Comparison with Poisson distribution Blue bars denote a histogram of data divided into 1 sec bins. Red curve is a Poisson curve with rate = median count rate of data. |
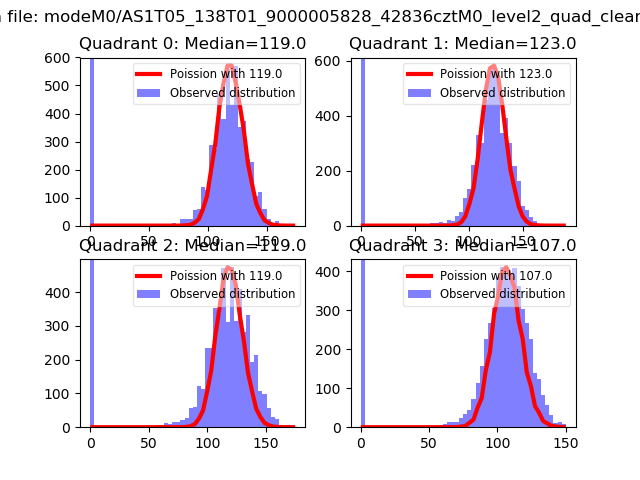 |
 |
| Quadrant-wise count rates Data is divided into 100 sec bins |
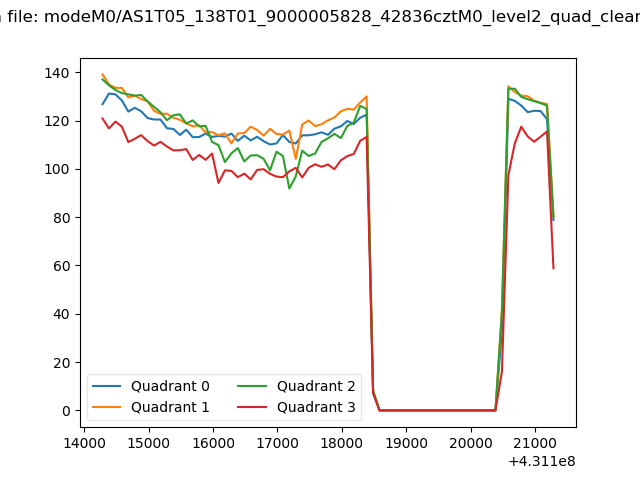 |
|
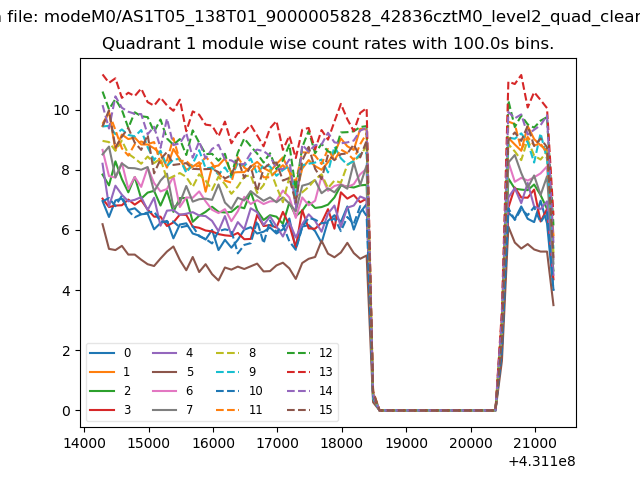
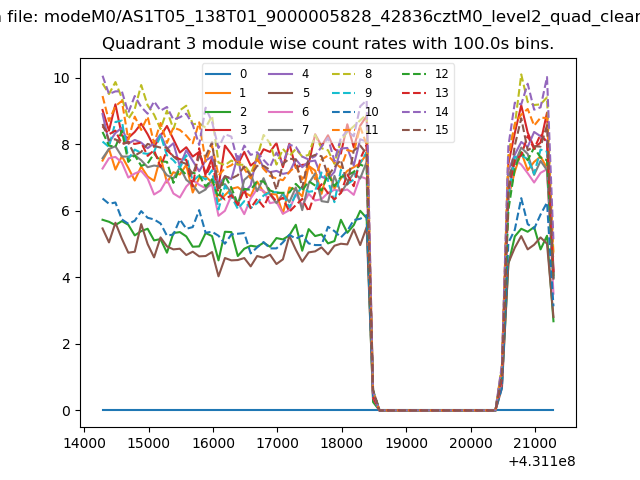
| Module-wise count rates for Quadrant A Data is divided into 100 sec bins |
 |
 |
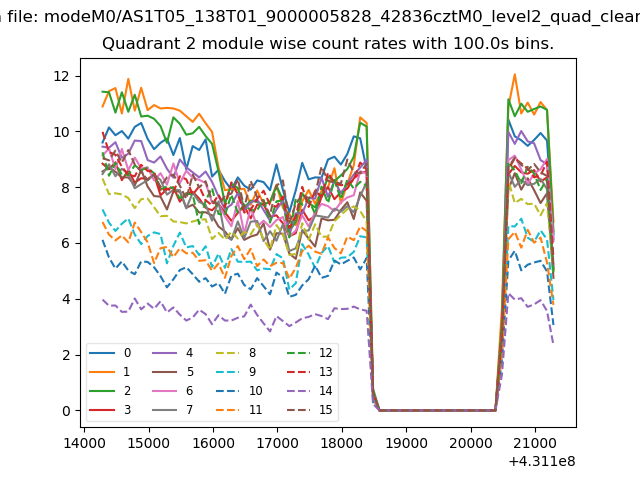
| Module-wise count rates for Quadrant B Data is divided into 100 sec bins |
 |
 |
| Module-wise count rates for Quadrant C Data is divided into 100 sec bins |
 |
 |
| Module-wise count rates for Quadrant D Data is divided into 100 sec bins |
 |
 |
| Parameter | Plot |
|---|---|
| CZT HV Monitor | 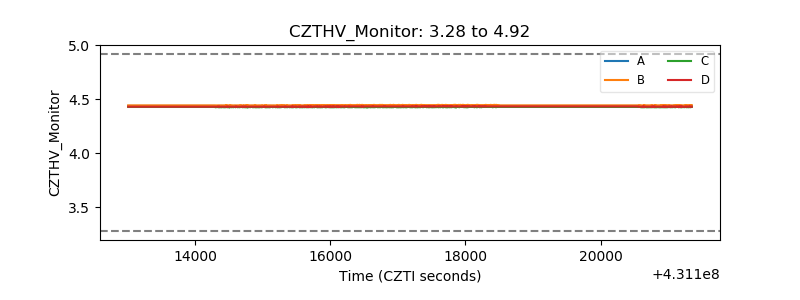 |
| D_VDD | 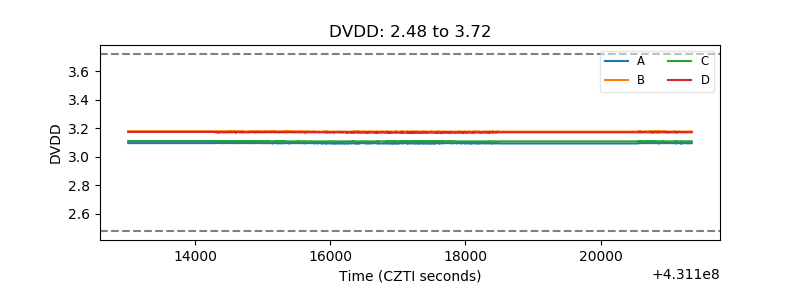 |
| Temperature 1 | 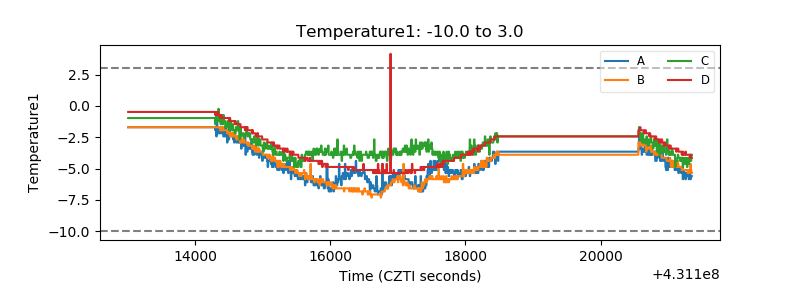 |
| Veto HV Monitor | 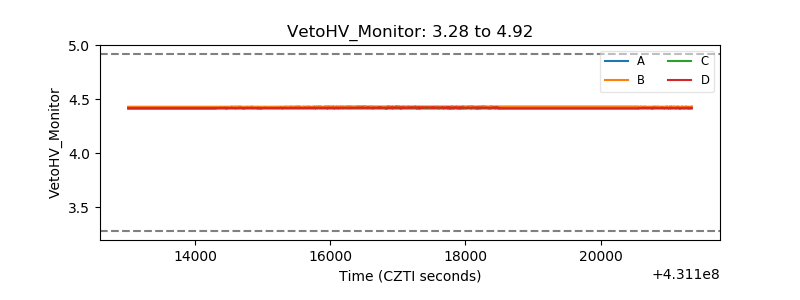 |
| Veto LLD | 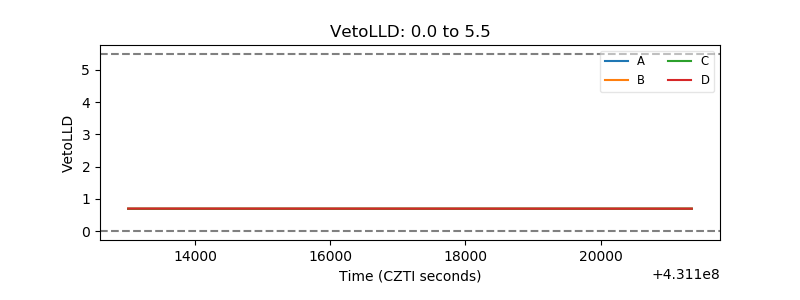 |
| Alpha Counter | 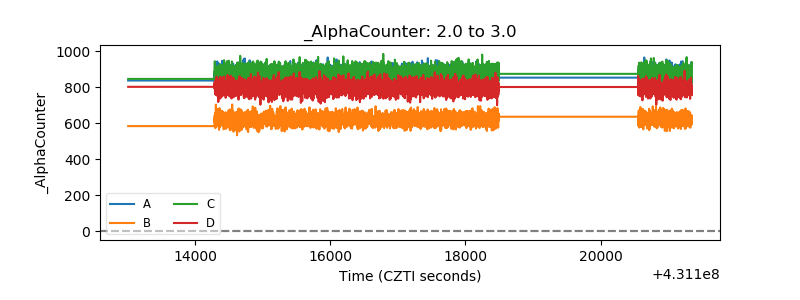 |
| _CPM_Rate | 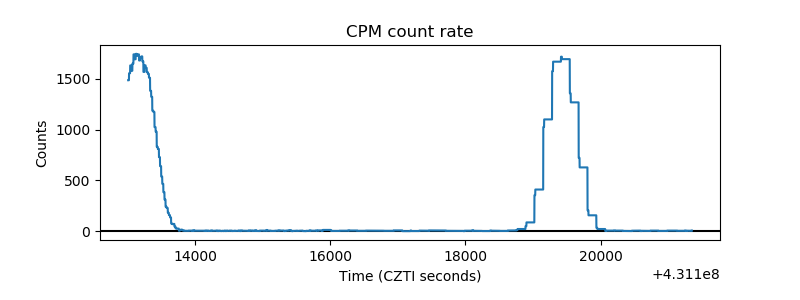 |
| CZT Counter | 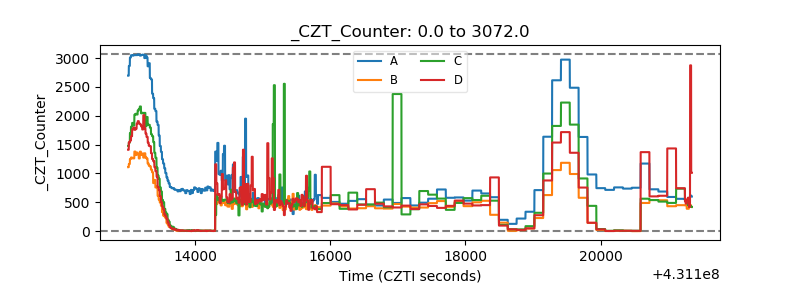 |
| +2.5 Volts monitor | 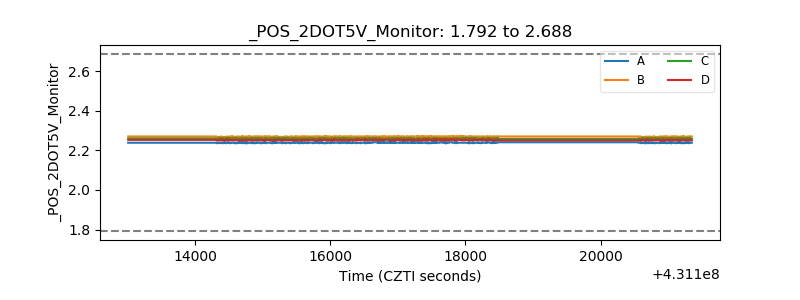 |
| +5 Volts monitor | 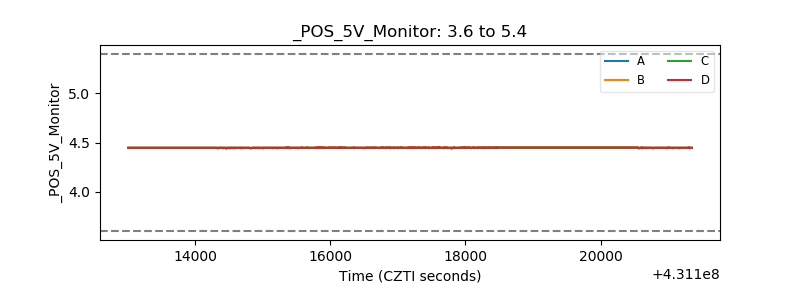 |
| _ROLL_ROT |  |
| _Roll_DEC | 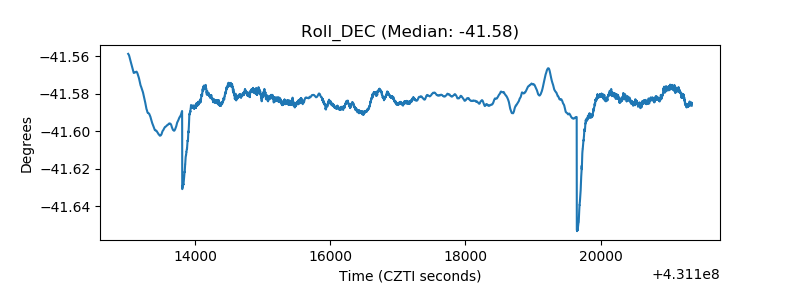 |
| _Roll_RA | 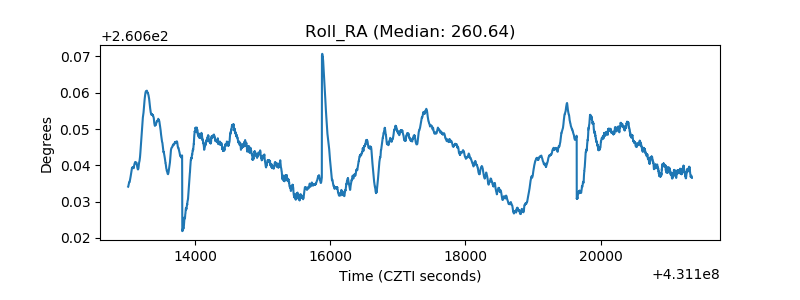 |
| Veto Counter | 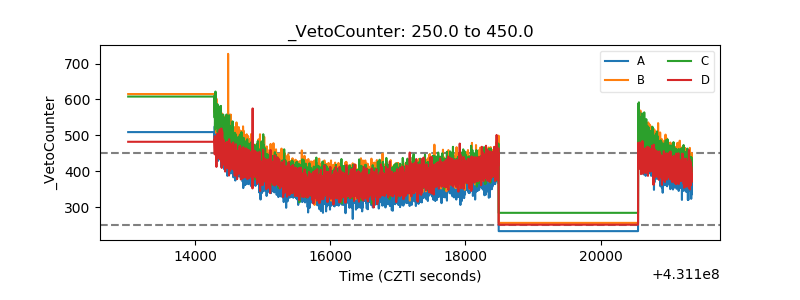 |