| Param | Original file | Final file |
|---|---|---|
| Filename | modeM0/AS1T05_138T01_9000005828_42837cztM0_level2.fits | modeM0/AS1T05_138T01_9000005828_42837cztM0_level2_quad_clean.evt |
| Size (bytes) | 310,760,640 | 84,640,320 |
| Size | 296.4 MB | 80.7 MB |
| Events in quadrant A | 2,941,564 | 565,386 |
| Events in quadrant B | 2,168,951 | 588,574 |
| Events in quadrant C | 2,533,592 | 568,977 |
| Events in quadrant D | 3,481,019 | 499,724 |
| Mode M0 | |||
|---|---|---|---|
| Quadrant | BADHDUFLAG | Total packets | Discarded packets |
| A | 0 | 11772 | 2 |
| B | 0 | 9773 | 2 |
| C | 0 | 10543 | 2 |
| D | 0 | 13703 | 2 |
| Mode M9 | |||
|---|---|---|---|
| Quadrant | BADHDUFLAG | Total packets | Discarded packets |
| A | 0 | 30 | 0 |
| B | 0 | 31 | 0 |
| C | 0 | 31 | 0 |
| D | 0 | 31 | 0 |
| Mode SS | |||
|---|---|---|---|
| Quadrant | BADHDUFLAG | Total packets | Discarded packets |
| A | 0 | 98 | 0 |
| B | 0 | 98 | 0 |
| C | 0 | 98 | 0 |
| D | 0 | 98 | 0 |
| Quadrant | Total seconds | Saturated seconds | Saturation percentage |
|---|---|---|---|
| A | 4853 | 34 | 0.700598% |
| B | 4853 | 7 | 0.144241% |
| C | 4853 | 20 | 0.412116% |
| D | 4853 | 176 | 3.626623% |
Noise dominated data is calculated using 1-second bins in cleaned event files. If a bin has >2000 counts, and if more than 50% of those come from <1% of pixels, then it is considered to be noise-dominated and hence unusable.
| Quadrant | # 1 sec bins | Bins with >0 counts | Bins with >2000 counts | High rate bins dominated by noise | Noise dominated (total time) | Noise dominated (detector-on time) | Marked lightcurve |
|---|---|---|---|---|---|---|---|
| A | 6975 | 4854 | 21 | 21 | 0.30% | 0.43% | 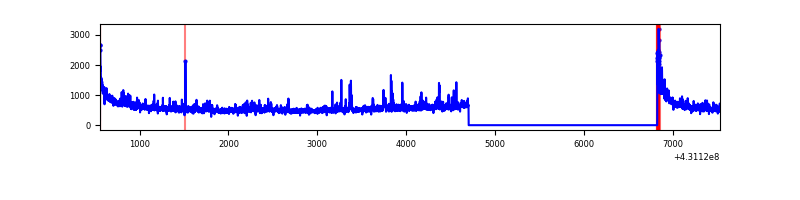 |
| B | 6975 | 4854 | 0 | 0 | 0.00% | 0.00% | 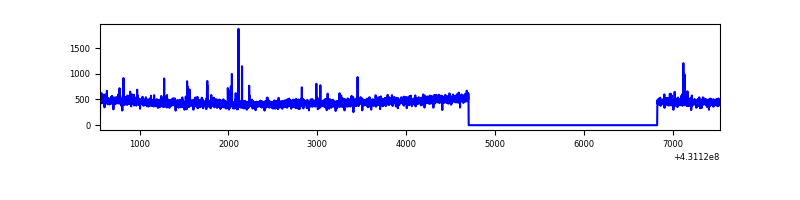 |
| C | 6975 | 4854 | 19 | 19 | 0.27% | 0.39% | 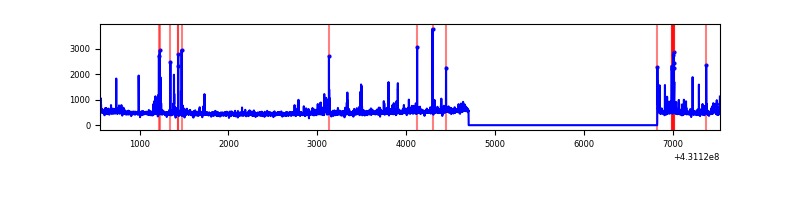 |
| D | 6975 | 4854 | 189 | 189 | 2.71% | 3.89% | 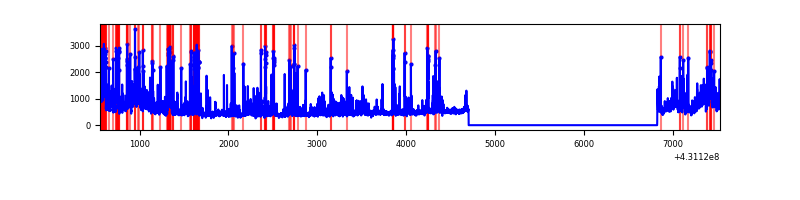 |
Top three noisy pixels from each quadrant. If the there are fewer than three noisy pixels in the level2.evt file, extra rows are filled as -1
| Pixel properties | Quadrant properties | ||||||
|---|---|---|---|---|---|---|---|
| Quadrant | DetID | PixID | Counts | Sigma | Mean | Median | Sigma |
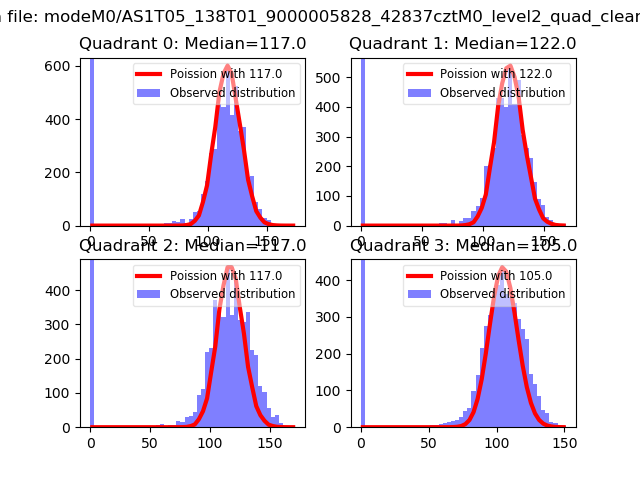
| A | 10 | 83 | 535172 | 4766.73 | 540 | 530 | 112.2 |
| A | 15 | 222 | 180615 | 1605.59 | 540 | 530 | 112.2 |
| A | 12 | 189 | 109588 | 972.33 | 540 | 530 | 112.2 |
| B | 5 | 255 | 15131 | 138.34 | 544 | 529 | 105.5 |
| B | 12 | 111 | 13182 | 119.88 | 544 | 529 | 105.5 |
| B | 11 | 111 | 11777 | 106.57 | 544 | 529 | 105.5 |
| C | 15 | 214 | 199872 | 1602.91 | 533 | 537 | 124.4 |
| C | 14 | 254 | 155113 | 1242.99 | 533 | 537 | 124.4 |
| C | 7 | 220 | 54922 | 437.33 | 533 | 537 | 124.4 |
| D | 1 | 52 | 684120 | 5376.75 | 517 | 503 | 127.1 |
| D | 14 | 49 | 181768 | 1425.68 | 517 | 503 | 127.1 |
| D | 13 | 249 | 178375 | 1398.99 | 517 | 503 | 127.1 |
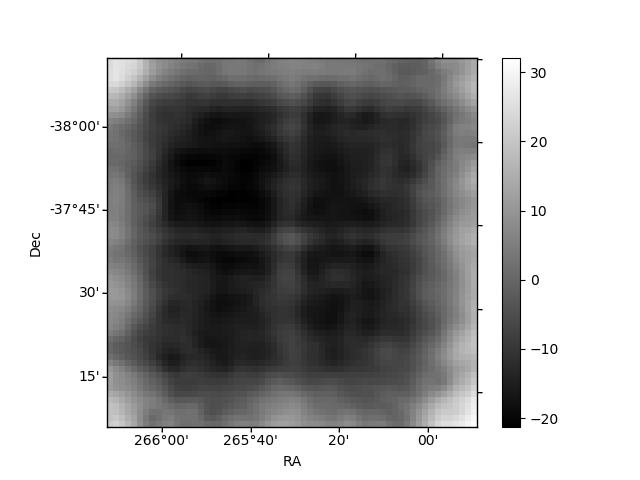
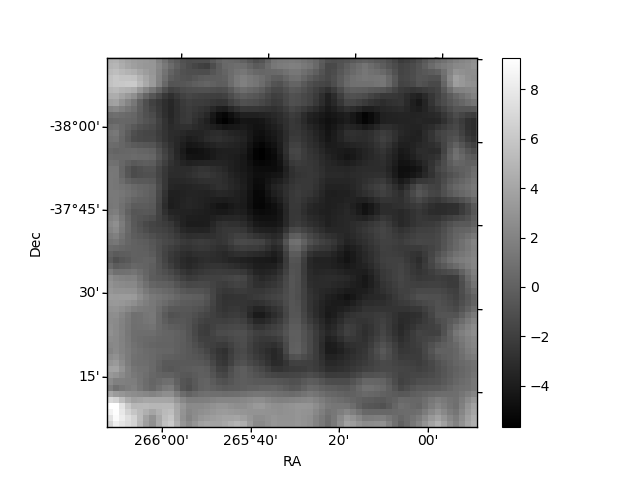
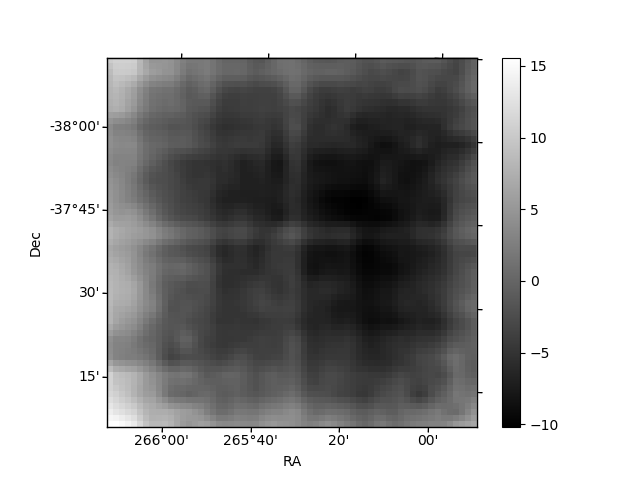
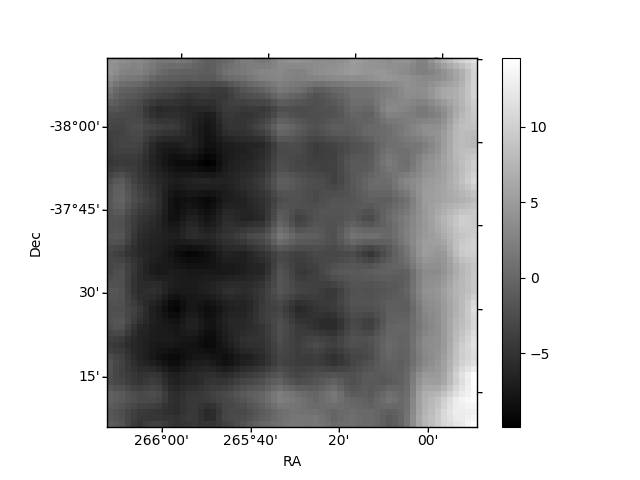
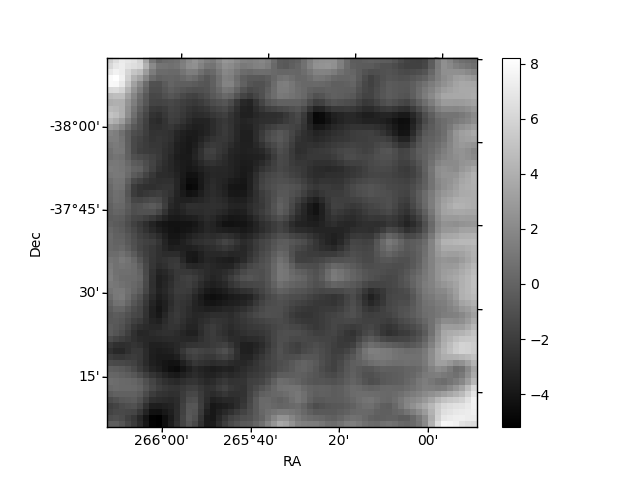
Histogram calculated using DETX and DETY for each event in the final _common_clean file
| Quadrant A | 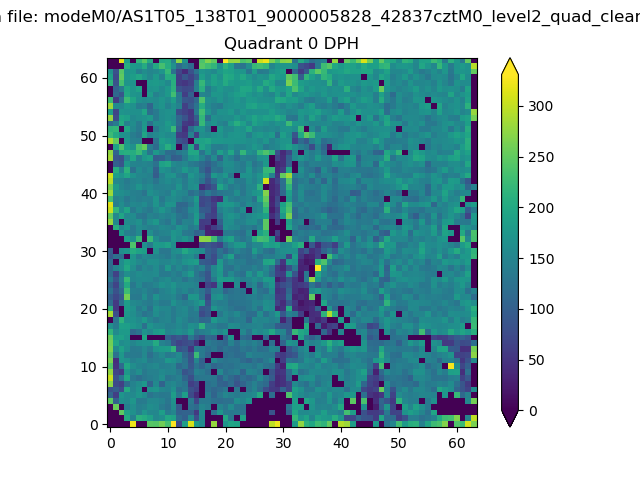 |
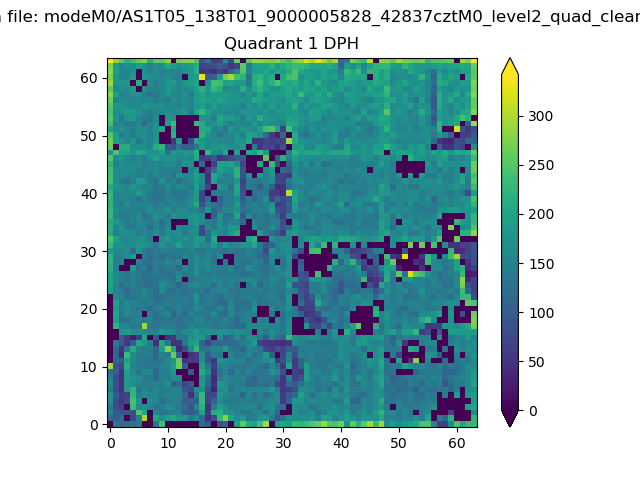 |
Quadrant B |
|---|---|---|---|
| Quadrant D | 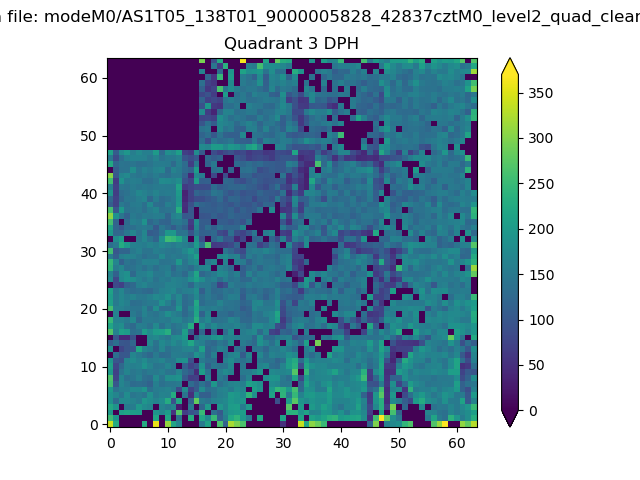 |
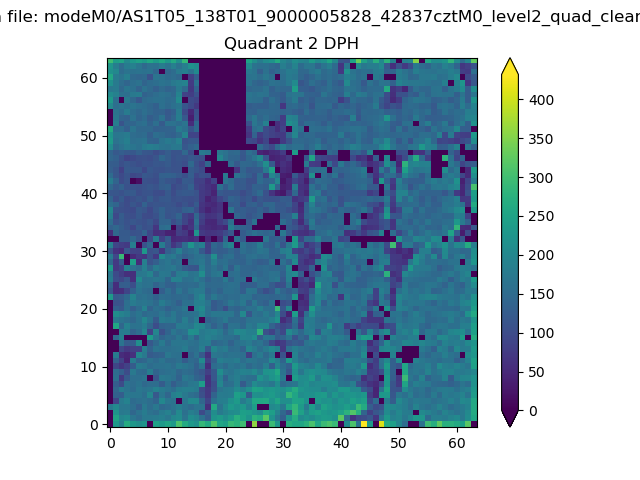 |
Quadrant C |
| Plot type | Count rate plots | Images |
|---|---|---|
| Comparison with Poisson distribution Blue bars denote a histogram of data divided into 1 sec bins. Red curve is a Poisson curve with rate = median count rate of data. |
 |
 |
| Quadrant-wise count rates Data is divided into 100 sec bins |
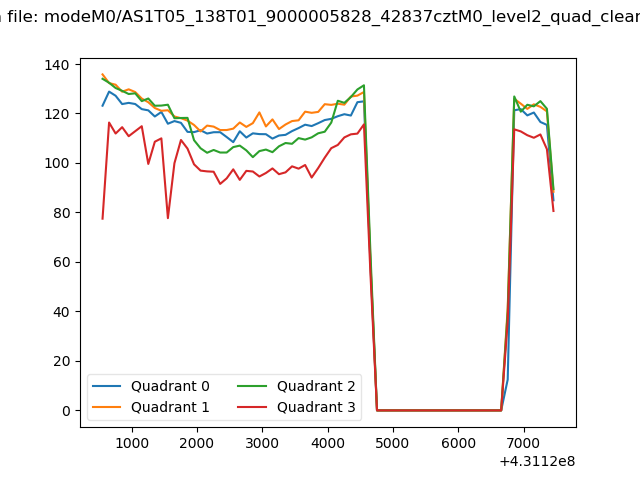 |
|
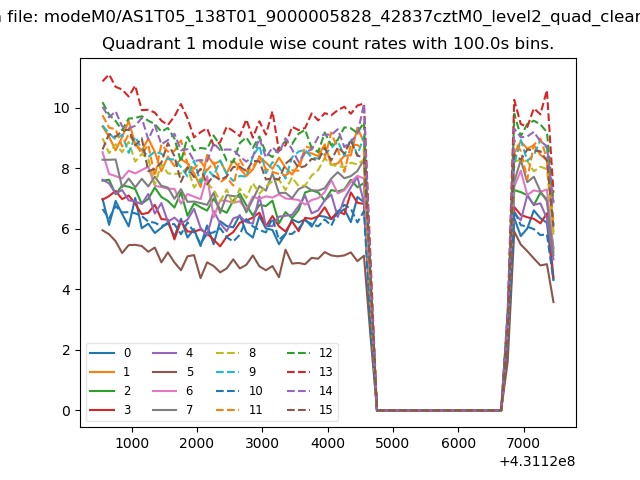
| Module-wise count rates for Quadrant A Data is divided into 100 sec bins |
 |
 |
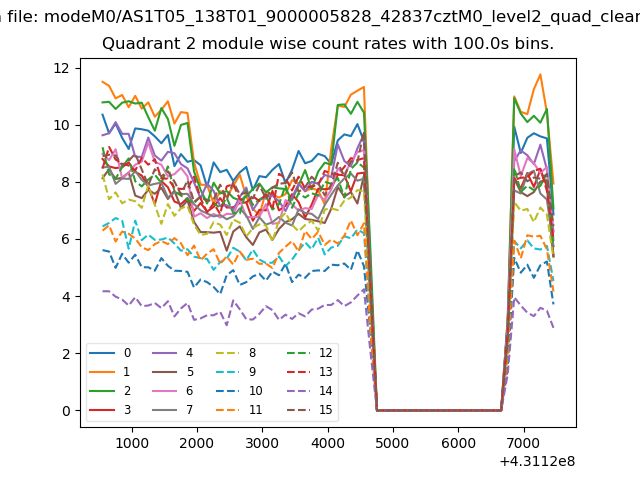
| Module-wise count rates for Quadrant B Data is divided into 100 sec bins |
 |
 |
| Module-wise count rates for Quadrant C Data is divided into 100 sec bins |
 |
 |
| Module-wise count rates for Quadrant D Data is divided into 100 sec bins |
 |
 |
| Parameter | Plot |
|---|---|
| CZT HV Monitor | 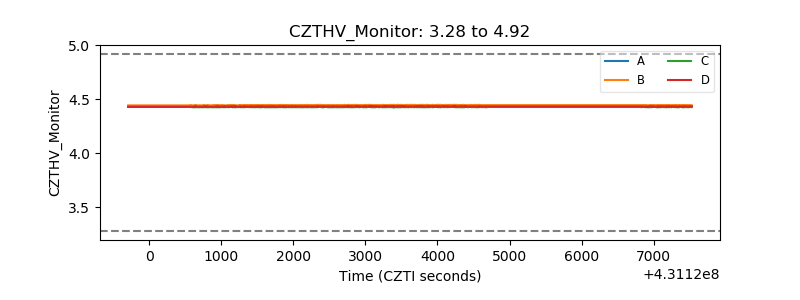 |
| D_VDD | 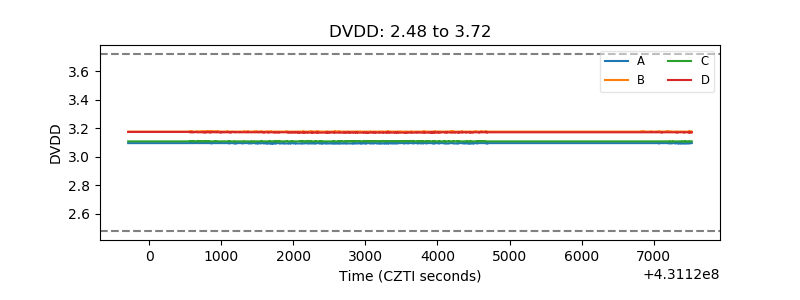 |
| Temperature 1 | 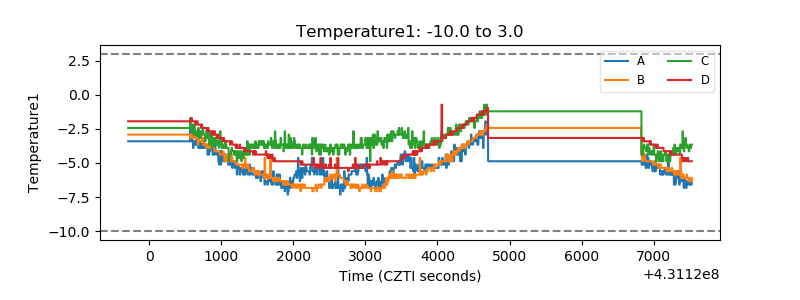 |
| Veto HV Monitor | 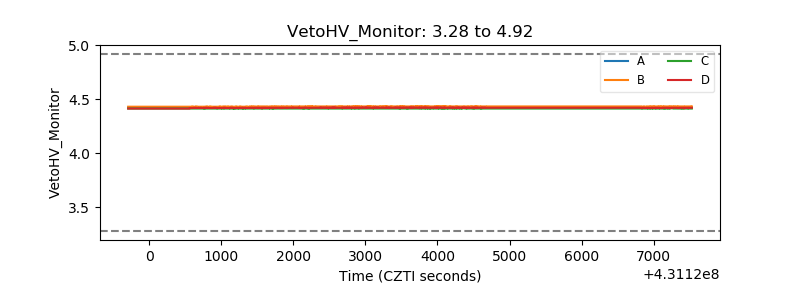 |
| Veto LLD | 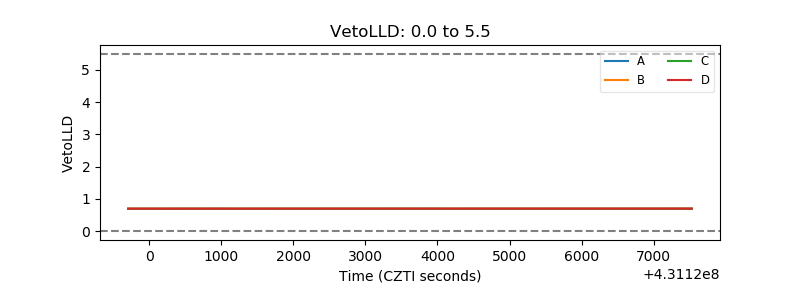 |
| Alpha Counter | 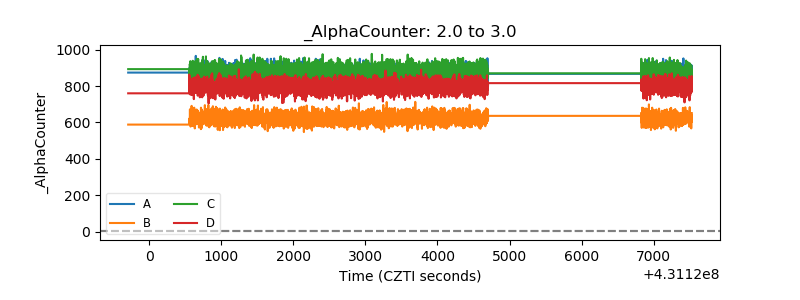 |
| _CPM_Rate | 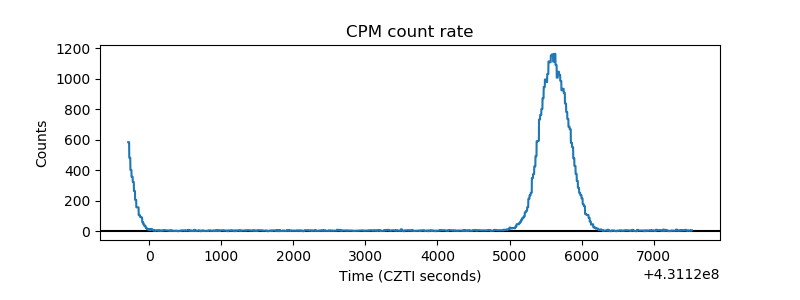 |
| CZT Counter | 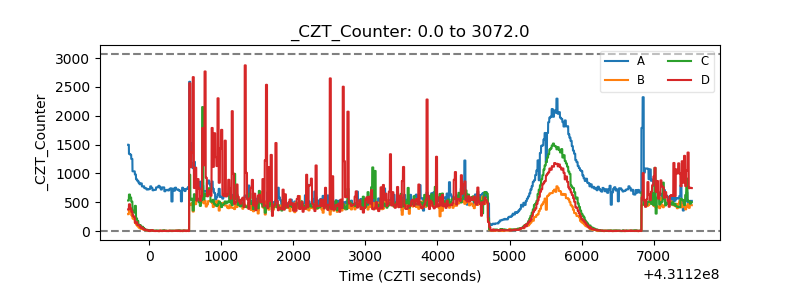 |
| +2.5 Volts monitor | 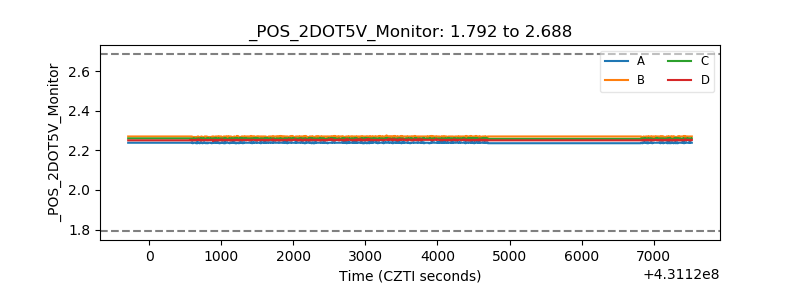 |
| +5 Volts monitor |  |
| _ROLL_ROT | 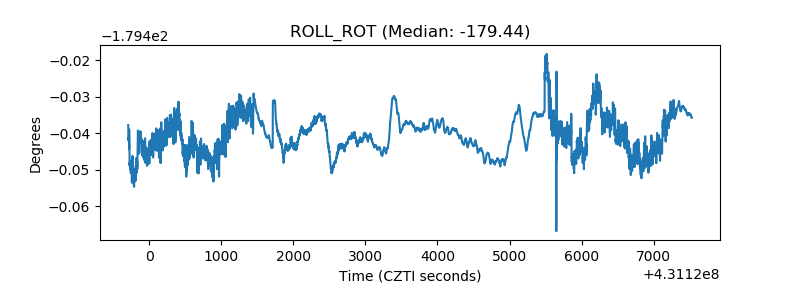 |
| _Roll_DEC | 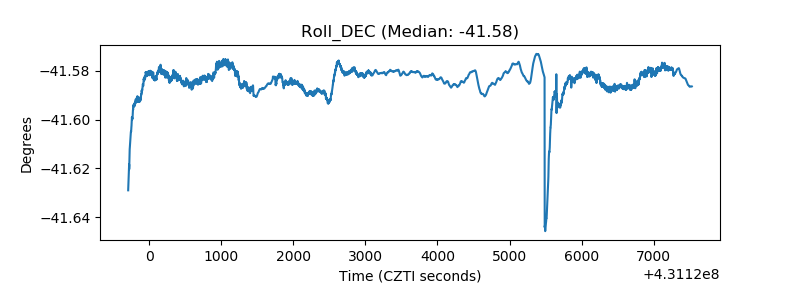 |
| _Roll_RA | 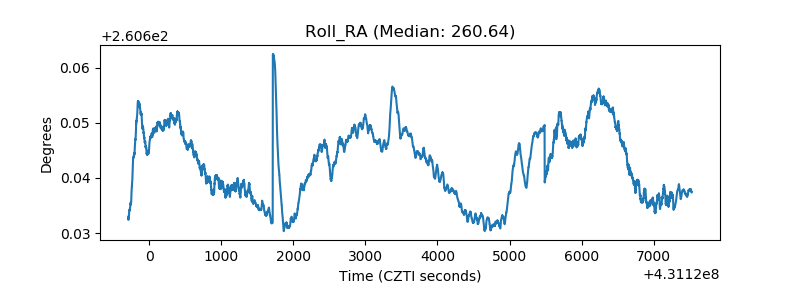 |
| Veto Counter | 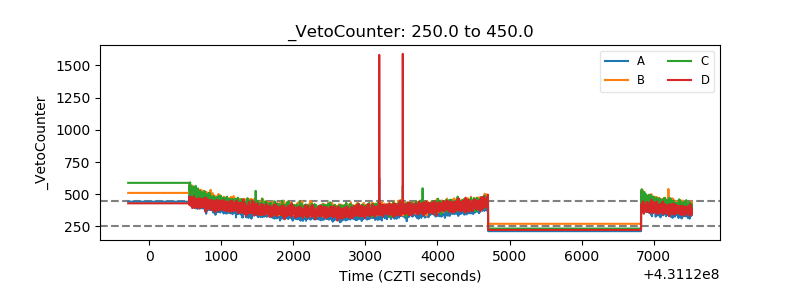 |