| Param | Original file | Final file |
|---|---|---|
| Filename | modeM0/AS1T05_138T01_9000005828_42838cztM0_level2.fits | modeM0/AS1T05_138T01_9000005828_42838cztM0_level2_quad_clean.evt |
| Size (bytes) | 303,618,240 | 83,802,240 |
| Size | 289.6 MB | 79.9 MB |
| Events in quadrant A | 2,980,834 | 554,500 |
| Events in quadrant B | 2,367,574 | 575,042 |
| Events in quadrant C | 2,712,098 | 556,470 |
| Events in quadrant D | 2,794,036 | 505,869 |
| Mode M0 | |||
|---|---|---|---|
| Quadrant | BADHDUFLAG | Total packets | Discarded packets |
| A | 0 | 11917 | 2 |
| B | 0 | 10515 | 2 |
| C | 0 | 11177 | 2 |
| D | 0 | 11848 | 2 |
| Mode M9 | |||
|---|---|---|---|
| Quadrant | BADHDUFLAG | Total packets | Discarded packets |
| A | 0 | 35 | 0 |
| B | 0 | 36 | 0 |
| C | 0 | 36 | 0 |
| D | 0 | 36 | 0 |
| Mode SS | |||
|---|---|---|---|
| Quadrant | BADHDUFLAG | Total packets | Discarded packets |
| A | 0 | 100 | 0 |
| B | 0 | 100 | 0 |
| C | 0 | 100 | 0 |
| D | 0 | 100 | 0 |
| Quadrant | Total seconds | Saturated seconds | Saturation percentage |
|---|---|---|---|
| A | 4930 | 55 | 1.115619% |
| B | 4930 | 57 | 1.156187% |
| C | 4930 | 55 | 1.115619% |
| D | 4930 | 48 | 0.973631% |
Noise dominated data is calculated using 1-second bins in cleaned event files. If a bin has >2000 counts, and if more than 50% of those come from <1% of pixels, then it is considered to be noise-dominated and hence unusable.
| Quadrant | # 1 sec bins | Bins with >0 counts | Bins with >2000 counts | High rate bins dominated by noise | Noise dominated (total time) | Noise dominated (detector-on time) | Marked lightcurve |
|---|---|---|---|---|---|---|---|
| A | 7053 | 4931 | 38 | 38 | 0.54% | 0.77% | 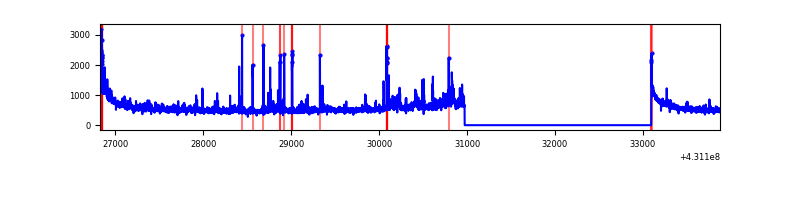 |
| B | 7053 | 4931 | 25 | 25 | 0.35% | 0.51% | 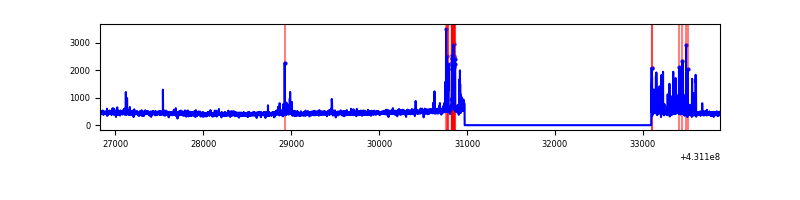 |
| C | 7053 | 4931 | 56 | 56 | 0.79% | 1.14% | 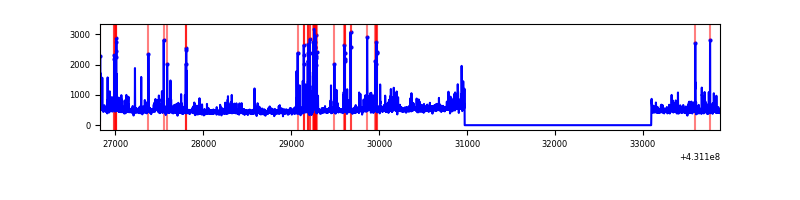 |
| D | 7053 | 4931 | 50 | 50 | 0.71% | 1.01% | 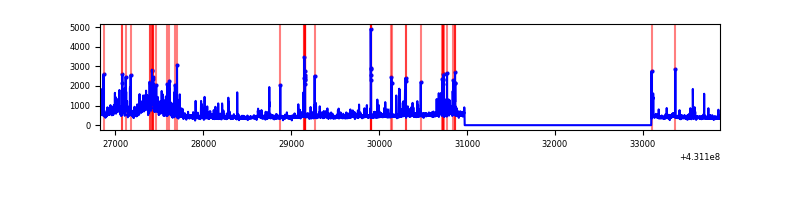 |
Top three noisy pixels from each quadrant. If the there are fewer than three noisy pixels in the level2.evt file, extra rows are filled as -1
| Pixel properties | Quadrant properties | ||||||
|---|---|---|---|---|---|---|---|
| Quadrant | DetID | PixID | Counts | Sigma | Mean | Median | Sigma |
| A | 10 | 83 | 527739 | 4737.1 | 538 | 527 | 111.3 |
| A | 15 | 222 | 226305 | 2028.66 | 538 | 527 | 111.3 |
| A | 15 | 237 | 57068 | 508.03 | 538 | 527 | 111.3 |
| B | 4 | 171 | 156709 | 1486.91 | 542 | 529 | 105.0 |
| B | 5 | 172 | 67455 | 637.17 | 542 | 529 | 105.0 |
| B | 12 | 111 | 13000 | 118.73 | 542 | 529 | 105.0 |
| C | 14 | 254 | 245236 | 1945.59 | 534 | 539 | 125.8 |
| C | 15 | 214 | 201087 | 1594.56 | 534 | 539 | 125.8 |
| C | 7 | 220 | 99179 | 784.29 | 534 | 539 | 125.8 |
| D | 1 | 52 | 436506 | 3381.51 | 525 | 510 | 128.9 |
| D | 13 | 249 | 106384 | 821.14 | 525 | 510 | 128.9 |
| D | 1 | 47 | 91365 | 704.65 | 525 | 510 | 128.9 |
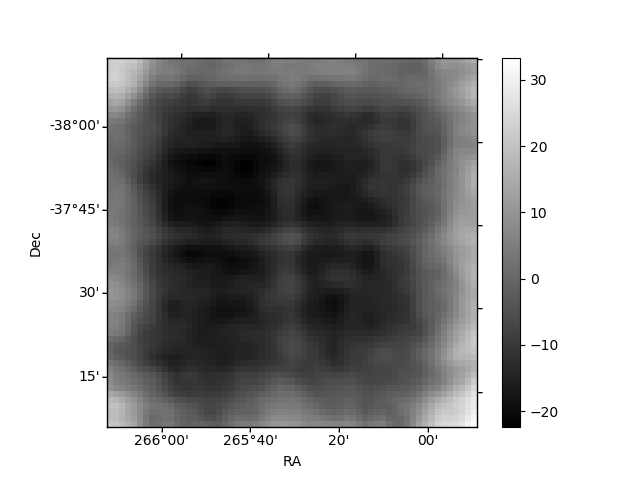
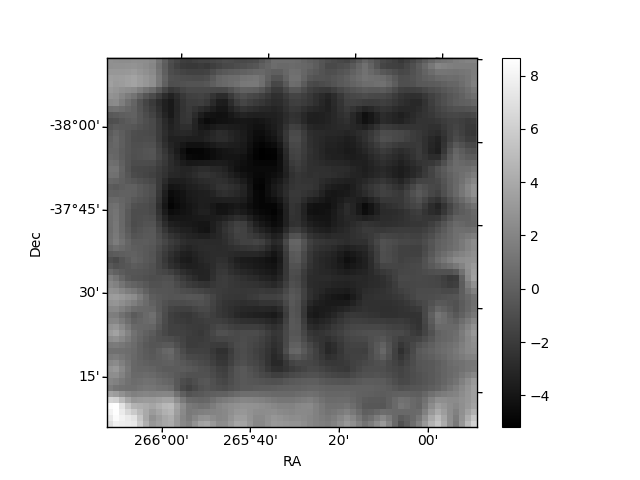
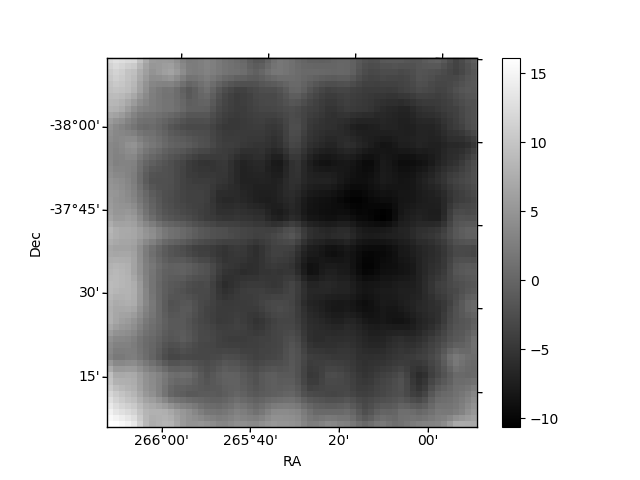
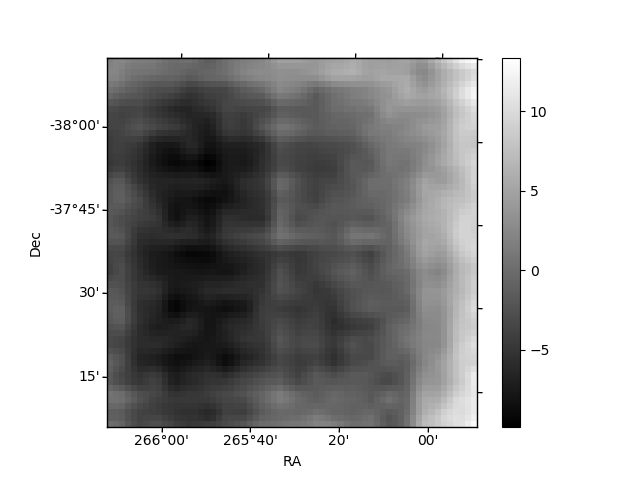
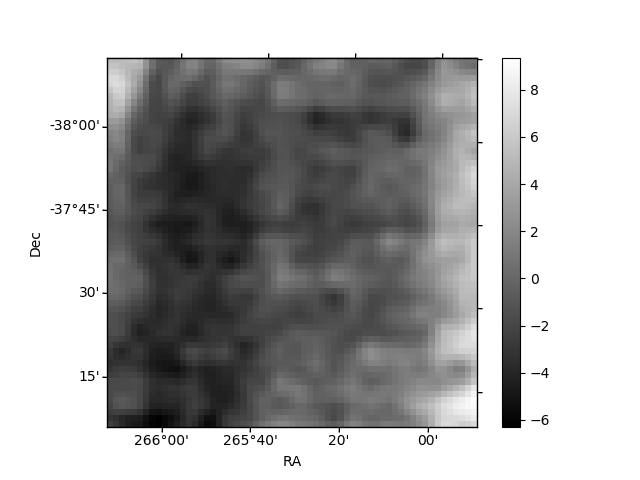
Histogram calculated using DETX and DETY for each event in the final _common_clean file
| Quadrant A | 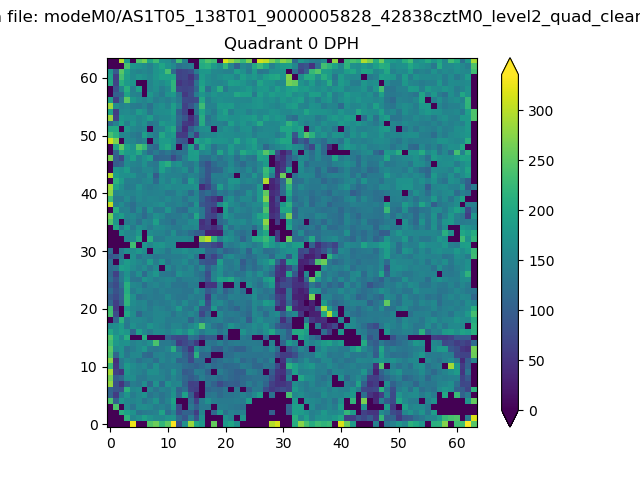 |
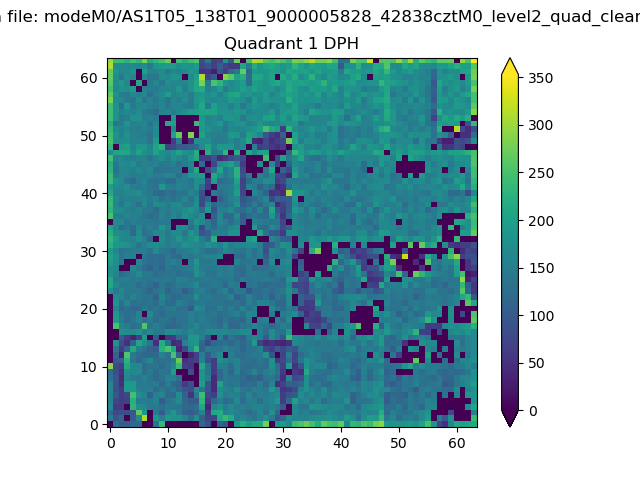 |
Quadrant B |
|---|---|---|---|
| Quadrant D | 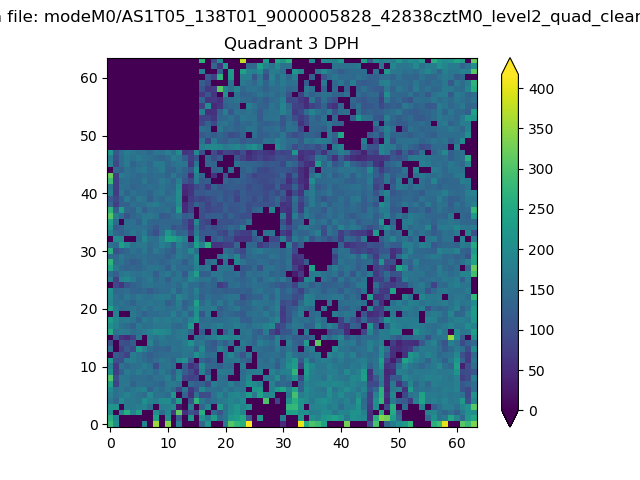 |
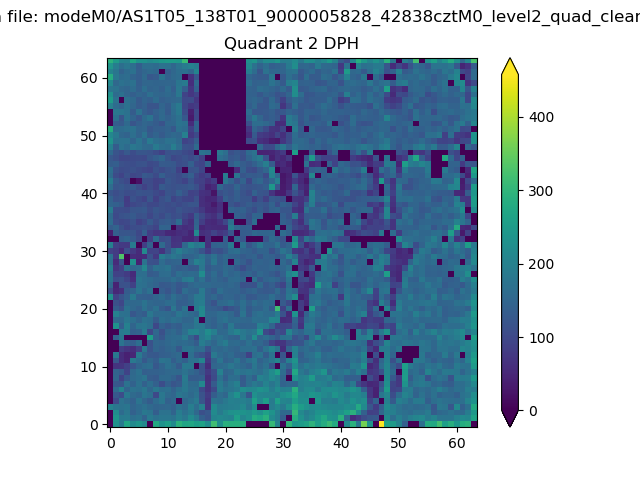 |
Quadrant C |
| Plot type | Count rate plots | Images |
|---|---|---|
| Comparison with Poisson distribution Blue bars denote a histogram of data divided into 1 sec bins. Red curve is a Poisson curve with rate = median count rate of data. |
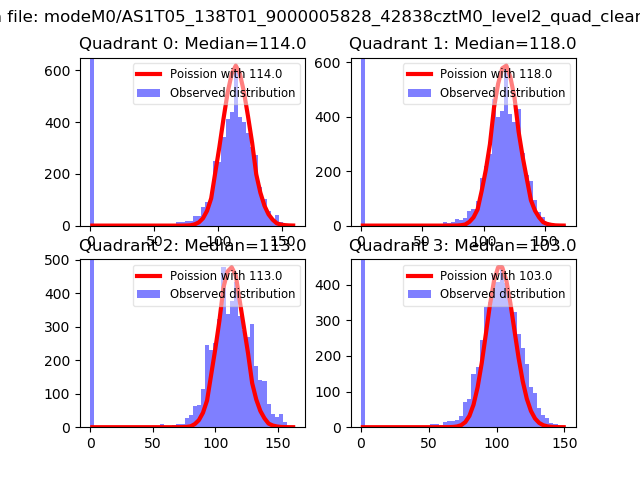 |
 |
| Quadrant-wise count rates Data is divided into 100 sec bins |
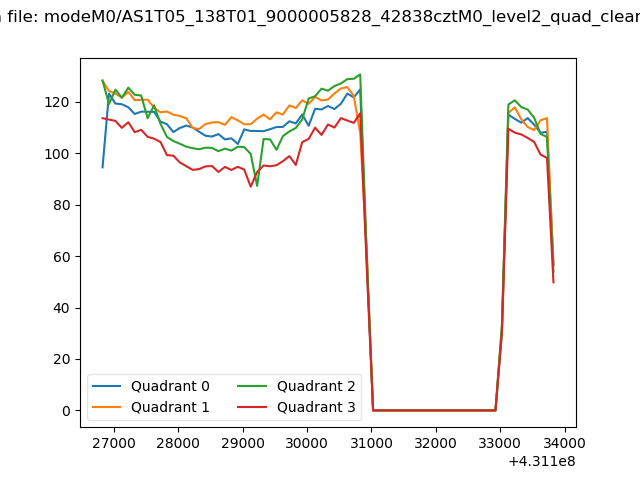 |
|
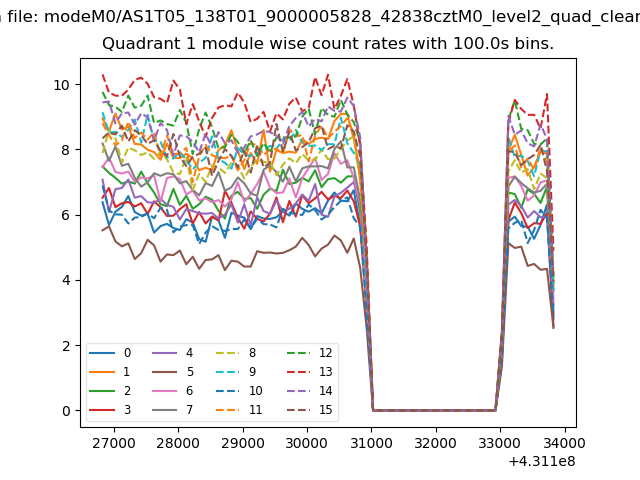
| Module-wise count rates for Quadrant A Data is divided into 100 sec bins |
 |
 |
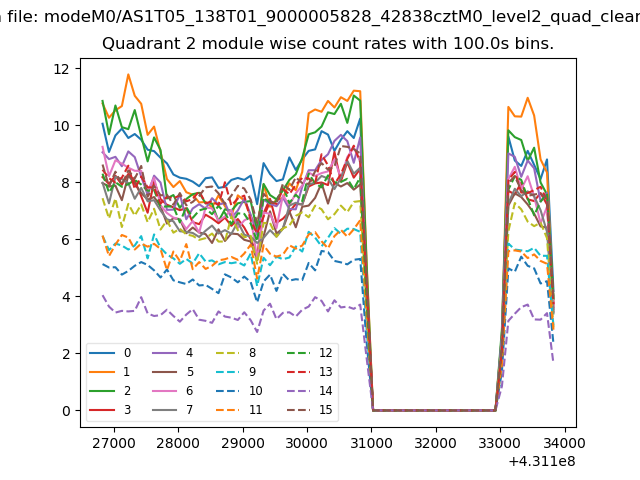
| Module-wise count rates for Quadrant B Data is divided into 100 sec bins |
 |
 |
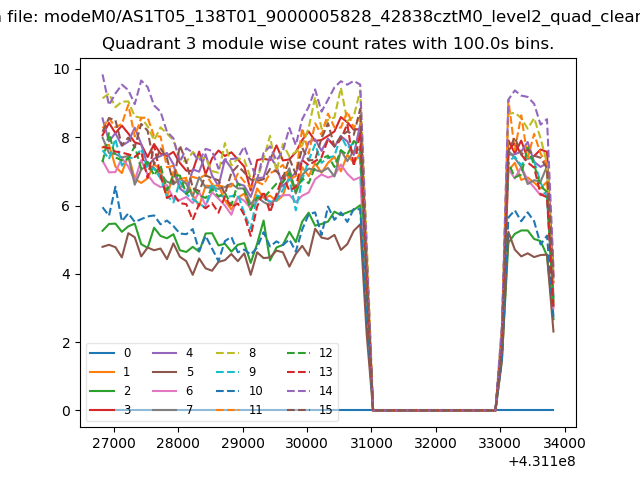
| Module-wise count rates for Quadrant C Data is divided into 100 sec bins |
 |
 |
| Module-wise count rates for Quadrant D Data is divided into 100 sec bins |
 |
 |
| Parameter | Plot |
|---|---|
| CZT HV Monitor | 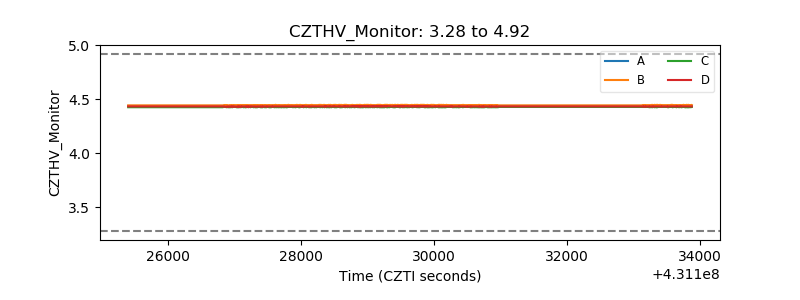 |
| D_VDD | 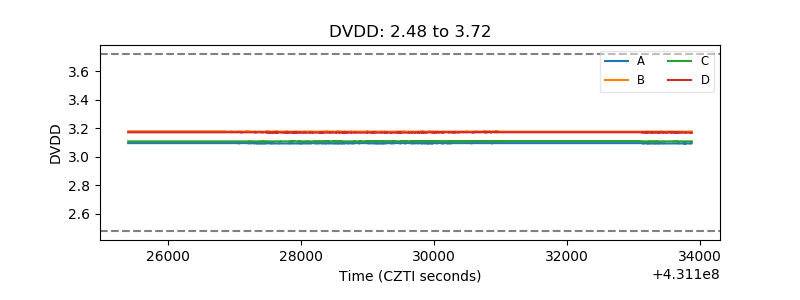 |
| Temperature 1 | 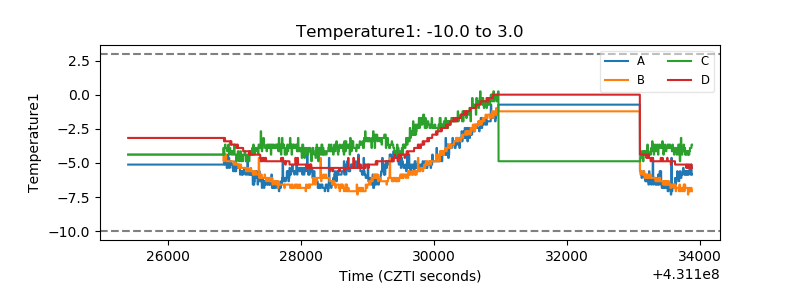 |
| Veto HV Monitor | 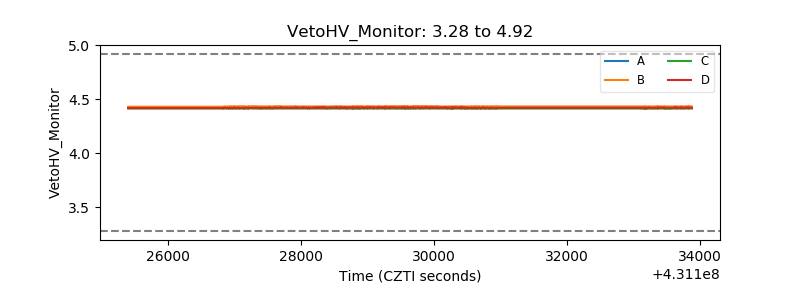 |
| Veto LLD | 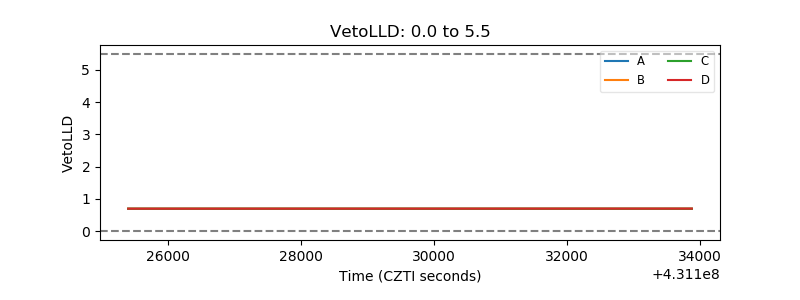 |
| Alpha Counter | 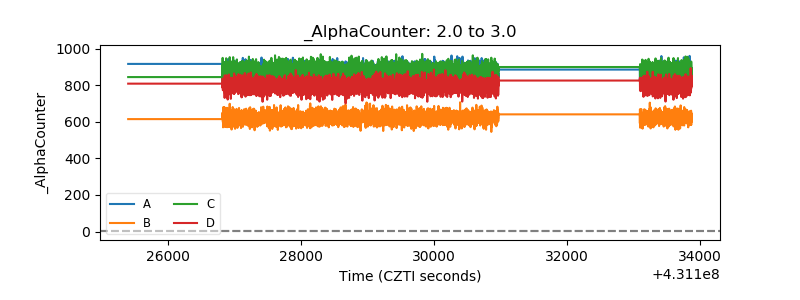 |
| _CPM_Rate | 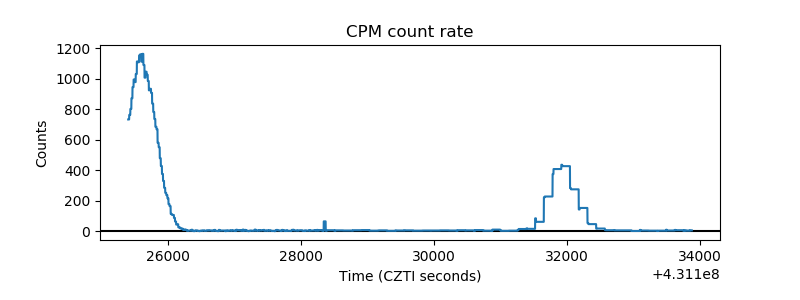 |
| CZT Counter | 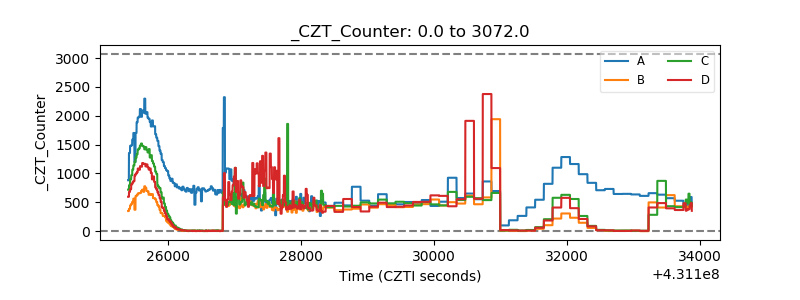 |
| +2.5 Volts monitor | 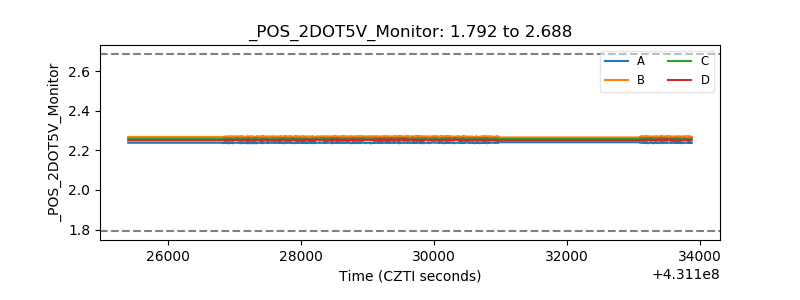 |
| +5 Volts monitor |  |
| _ROLL_ROT | 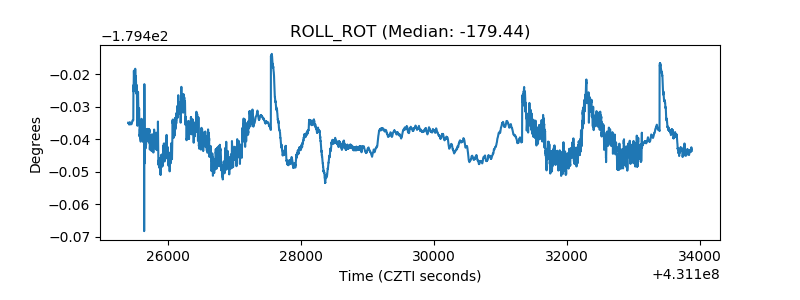 |
| _Roll_DEC | 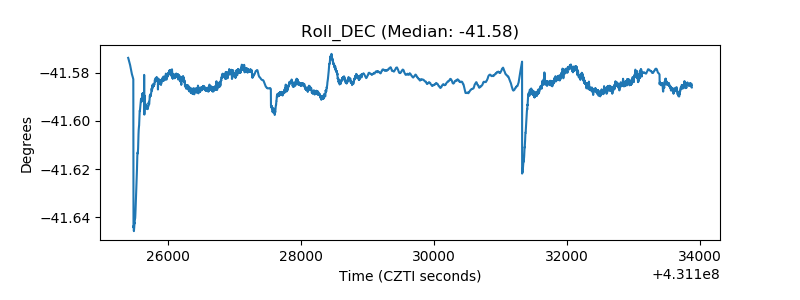 |
| _Roll_RA | 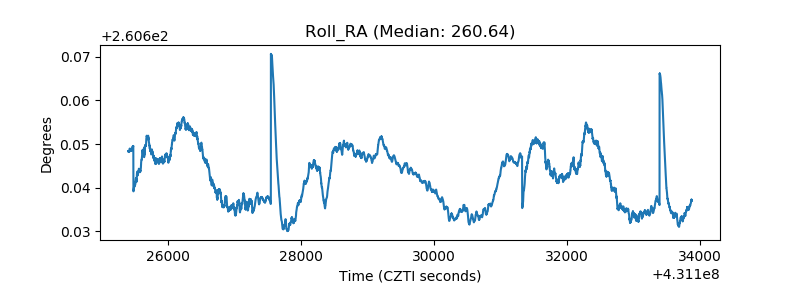 |
| Veto Counter | 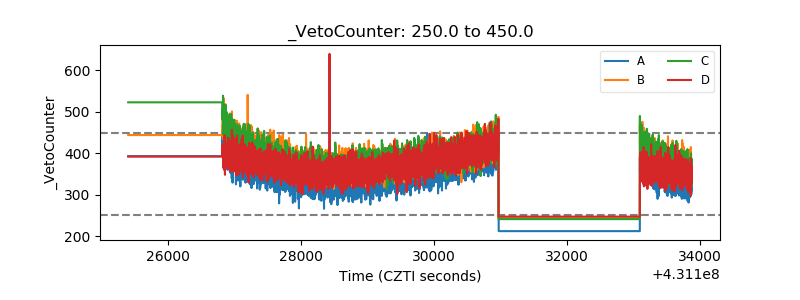 |