| Param | Original file | Final file |
|---|---|---|
| Filename | modeM0/AS1T05_138T01_9000005828_42839cztM0_level2.fits | modeM0/AS1T05_138T01_9000005828_42839cztM0_level2_quad_clean.evt |
| Size (bytes) | 332,524,800 | 83,280,960 |
| Size | 317.1 MB | 79.4 MB |
| Events in quadrant A | 2,953,192 | 557,980 |
| Events in quadrant B | 2,503,321 | 573,279 |
| Events in quadrant C | 2,650,838 | 561,603 |
| Events in quadrant D | 3,804,956 | 471,991 |
| Mode M0 | |||
|---|---|---|---|
| Quadrant | BADHDUFLAG | Total packets | Discarded packets |
| A | 0 | 11863 | 3 |
| B | 0 | 11044 | 2 |
| C | 0 | 11084 | 2 |
| D | 0 | 14981 | 2 |
| Mode M9 | |||
|---|---|---|---|
| Quadrant | BADHDUFLAG | Total packets | Discarded packets |
| A | 0 | 39 | 0 |
| B | 0 | 40 | 0 |
| C | 0 | 40 | 0 |
| D | 0 | 40 | 0 |
| Mode SS | |||
|---|---|---|---|
| Quadrant | BADHDUFLAG | Total packets | Discarded packets |
| A | 0 | 104 | 0 |
| B | 0 | 104 | 0 |
| C | 0 | 104 | 0 |
| D | 0 | 104 | 0 |
| Quadrant | Total seconds | Saturated seconds | Saturation percentage |
|---|---|---|---|
| A | 5090 | 60 | 1.178782% |
| B | 5090 | 68 | 1.335953% |
| C | 5090 | 17 | 0.333988% |
| D | 5090 | 495 | 9.724951% |
Noise dominated data is calculated using 1-second bins in cleaned event files. If a bin has >2000 counts, and if more than 50% of those come from <1% of pixels, then it is considered to be noise-dominated and hence unusable.
| Quadrant | # 1 sec bins | Bins with >0 counts | Bins with >2000 counts | High rate bins dominated by noise | Noise dominated (total time) | Noise dominated (detector-on time) | Marked lightcurve |
|---|---|---|---|---|---|---|---|
| A | 7064 | 5091 | 43 | 43 | 0.61% | 0.84% | 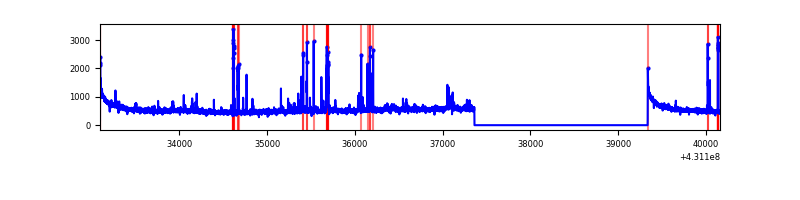 |
| B | 7064 | 5091 | 24 | 24 | 0.34% | 0.47% | 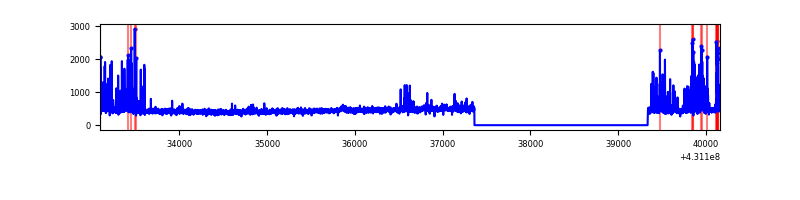 |
| C | 7064 | 5091 | 14 | 14 | 0.20% | 0.27% | 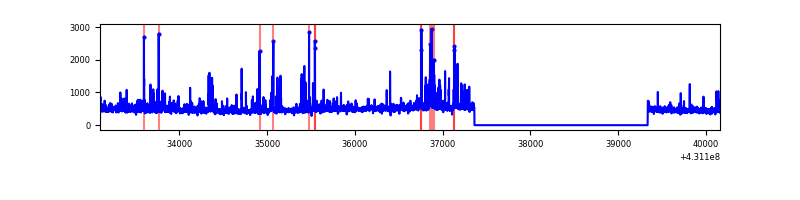 |
| D | 7064 | 5091 | 400 | 400 | 5.66% | 7.86% | 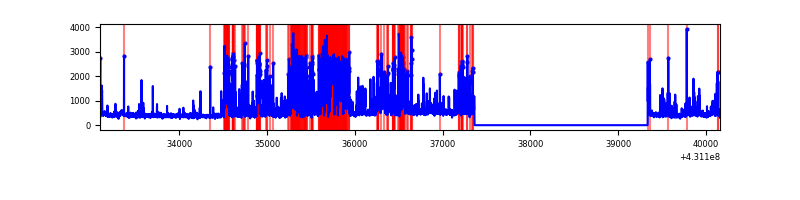 |
Top three noisy pixels from each quadrant. If the there are fewer than three noisy pixels in the level2.evt file, extra rows are filled as -1
| Pixel properties | Quadrant properties | ||||||
|---|---|---|---|---|---|---|---|
| Quadrant | DetID | PixID | Counts | Sigma | Mean | Median | Sigma |
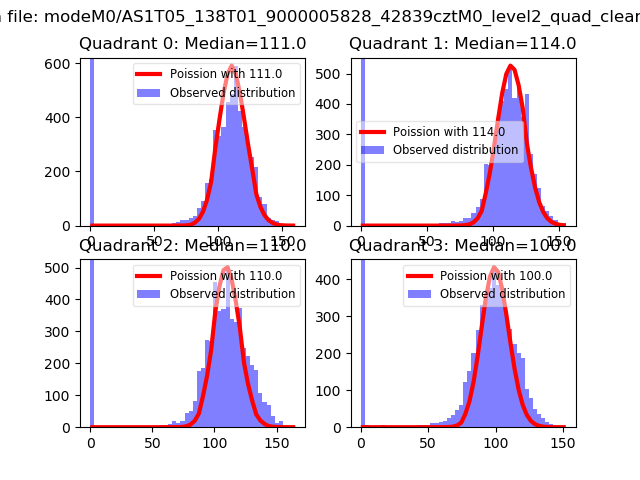
| A | 10 | 83 | 537221 | 4673.66 | 551 | 538 | 114.8 |
| A | 15 | 237 | 173485 | 1506.09 | 551 | 538 | 114.8 |
| A | 12 | 189 | 44357 | 381.59 | 551 | 538 | 114.8 |
| B | 4 | 171 | 300122 | 2768.73 | 552 | 535 | 108.2 |
| B | 5 | 255 | 19625 | 176.42 | 552 | 535 | 108.2 |
| B | 12 | 111 | 13341 | 118.35 | 552 | 535 | 108.2 |
| C | 15 | 214 | 206260 | 1610.36 | 545 | 549 | 127.7 |
| C | 14 | 254 | 165724 | 1293.03 | 545 | 549 | 127.7 |
| C | 7 | 220 | 117043 | 911.95 | 545 | 549 | 127.7 |
| D | 1 | 52 | 1303422 | 10361.38 | 512 | 498 | 125.7 |
| D | 13 | 249 | 338044 | 2684.3 | 512 | 498 | 125.7 |
| D | 2 | 249 | 49847 | 392.44 | 512 | 498 | 125.7 |
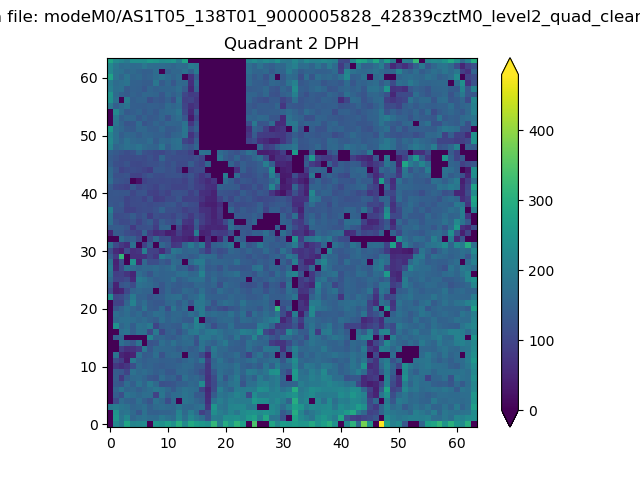
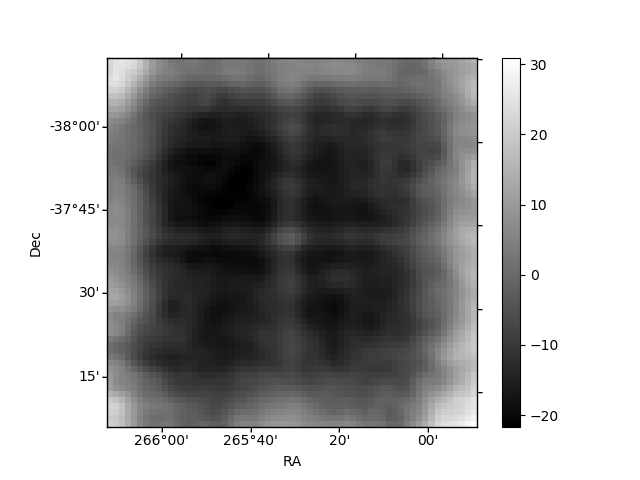
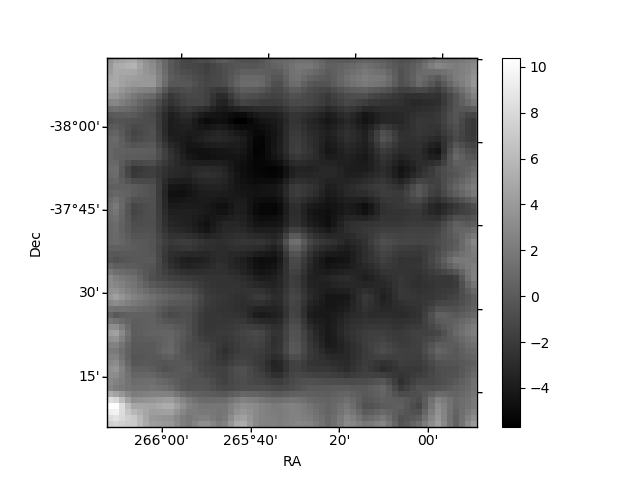
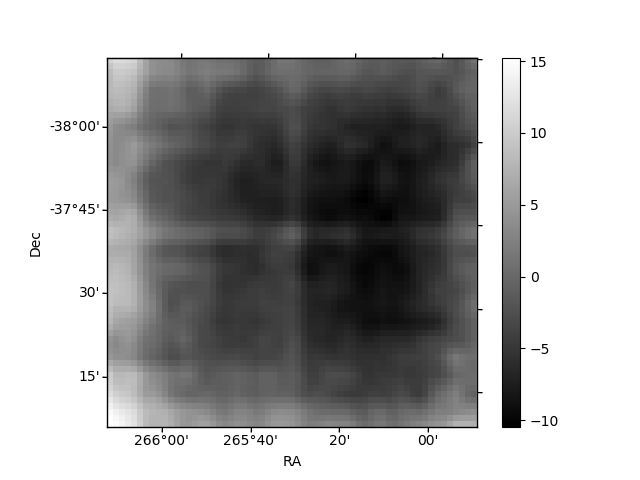
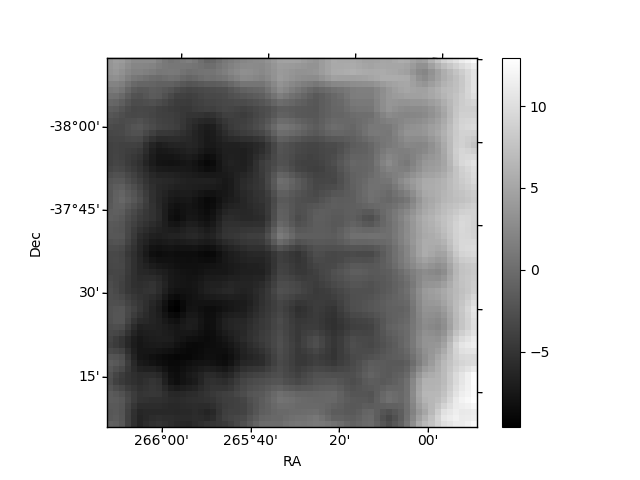
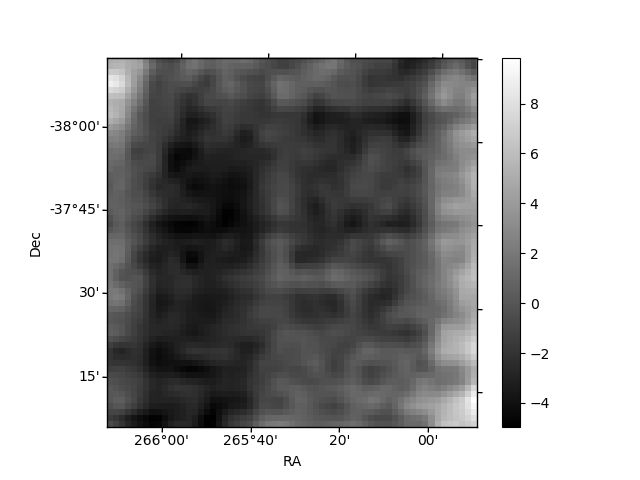
Histogram calculated using DETX and DETY for each event in the final _common_clean file
| Quadrant A | 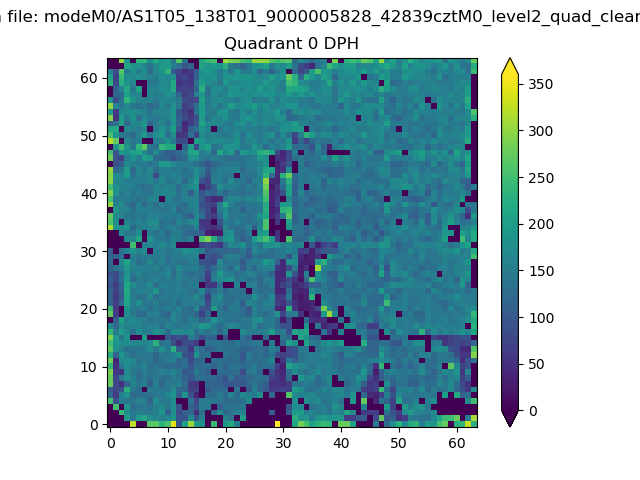 |
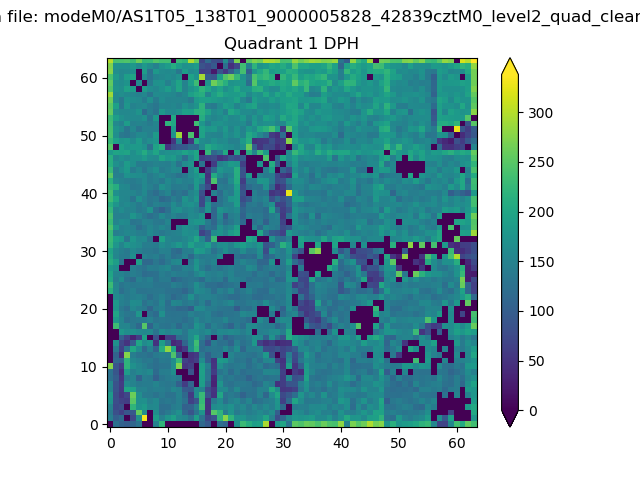 |
Quadrant B |
|---|---|---|---|
| Quadrant D | 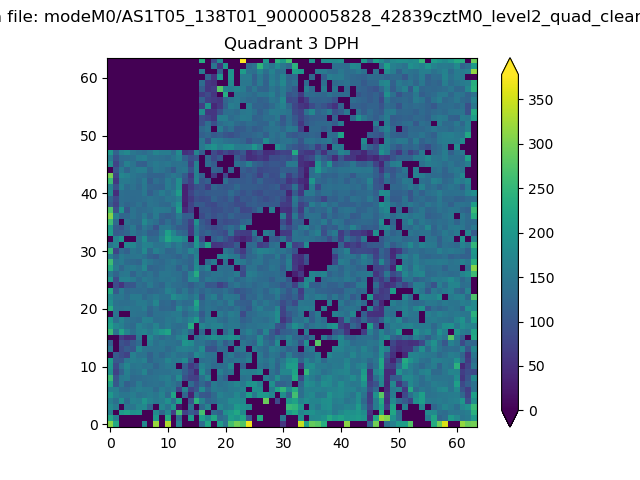 |
 |
Quadrant C |
| Plot type | Count rate plots | Images |
|---|---|---|
| Comparison with Poisson distribution Blue bars denote a histogram of data divided into 1 sec bins. Red curve is a Poisson curve with rate = median count rate of data. |
 |
 |
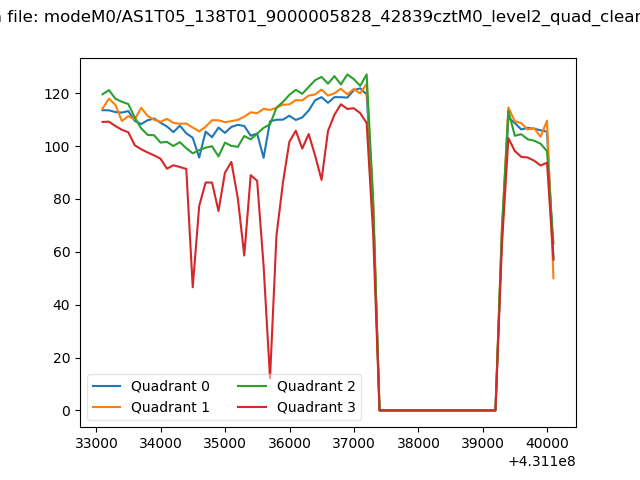
| Quadrant-wise count rates Data is divided into 100 sec bins |
 |
|
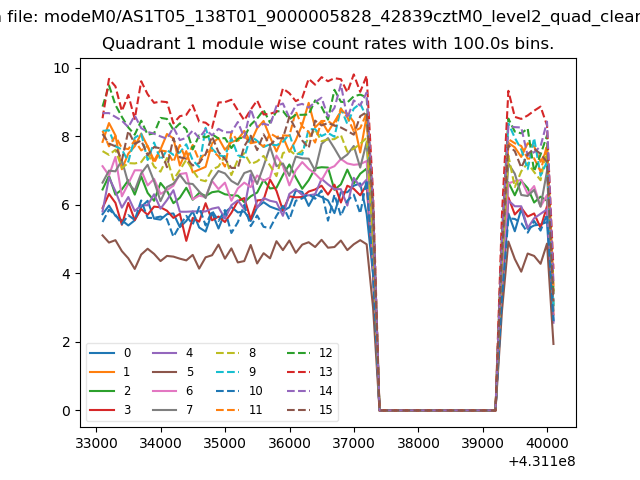
| Module-wise count rates for Quadrant A Data is divided into 100 sec bins |
 |
 |
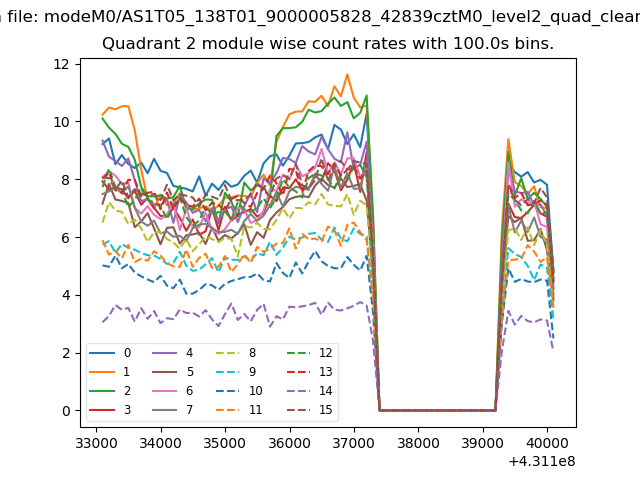
| Module-wise count rates for Quadrant B Data is divided into 100 sec bins |
 |
 |
| Module-wise count rates for Quadrant C Data is divided into 100 sec bins |
 |
 |
| Module-wise count rates for Quadrant D Data is divided into 100 sec bins |
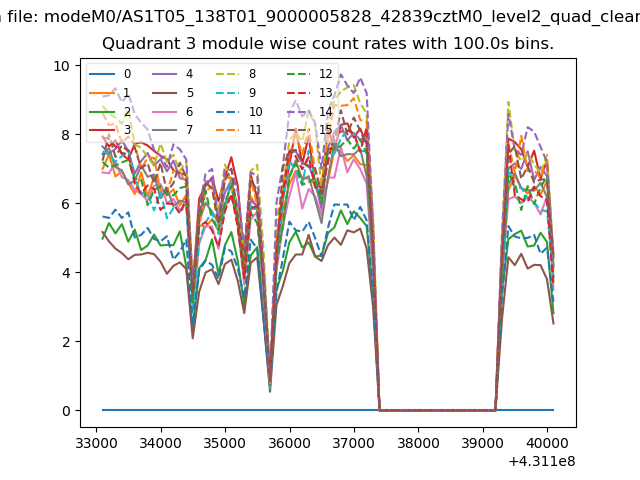 |
 |
| Parameter | Plot |
|---|---|
| CZT HV Monitor |  |
| D_VDD | 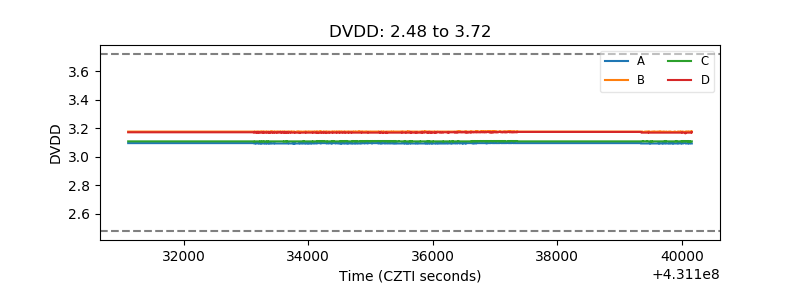 |
| Temperature 1 | 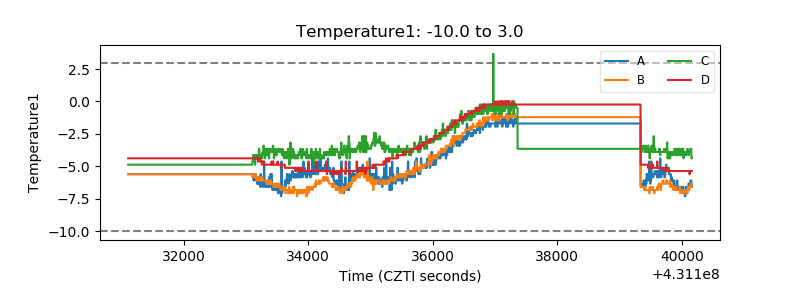 |
| Veto HV Monitor | 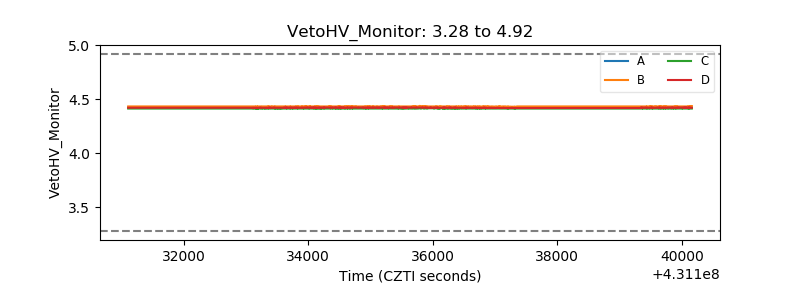 |
| Veto LLD | 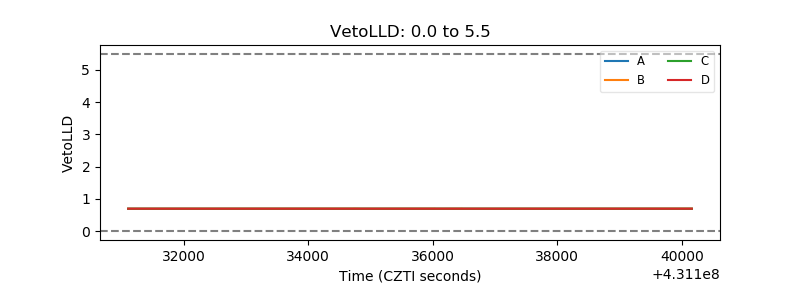 |
| Alpha Counter | 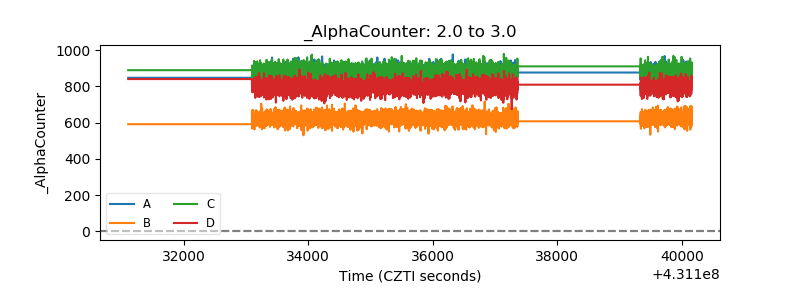 |
| _CPM_Rate | 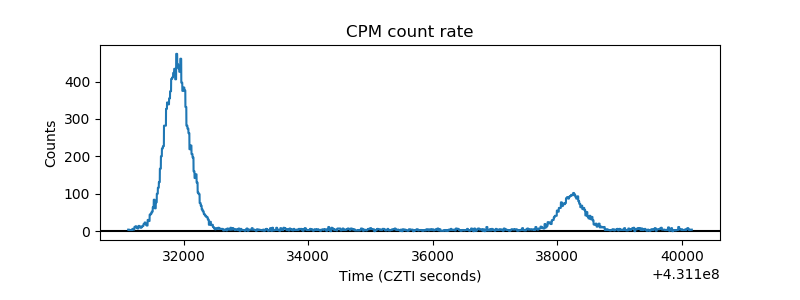 |
| CZT Counter | 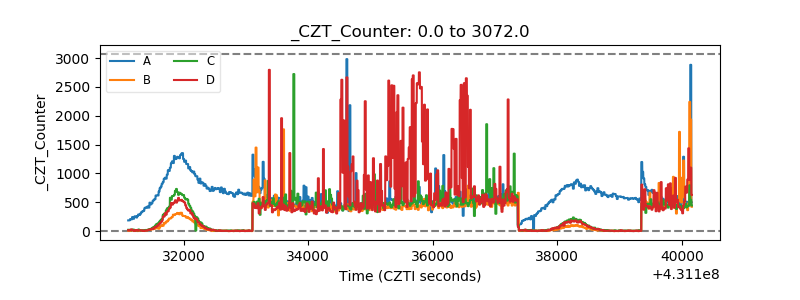 |
| +2.5 Volts monitor | 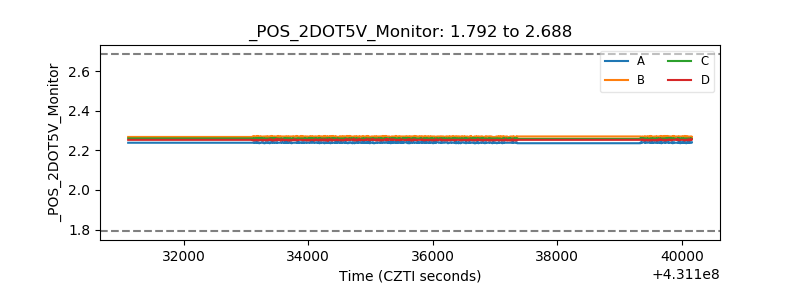 |
| +5 Volts monitor |  |
| _ROLL_ROT | 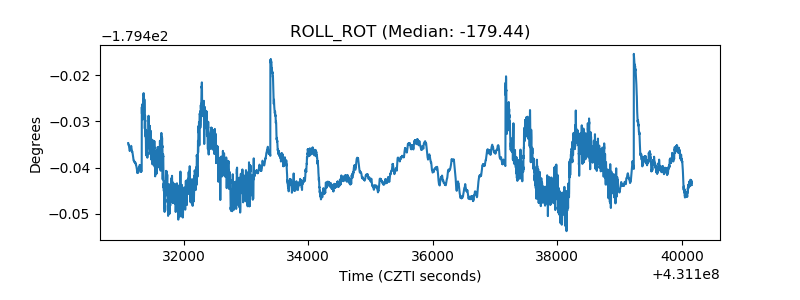 |
| _Roll_DEC | 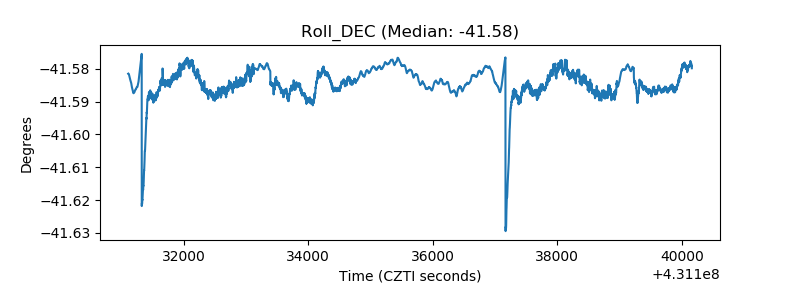 |
| _Roll_RA | 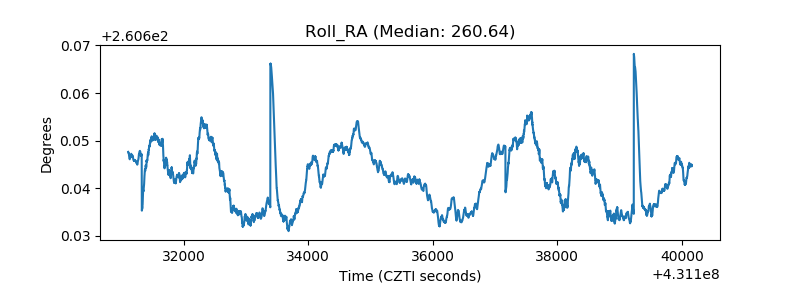 |
| Veto Counter | 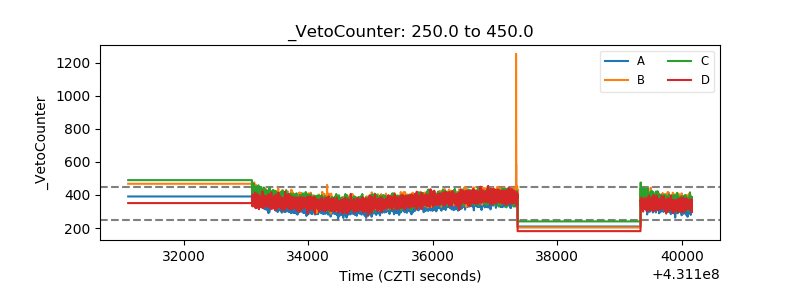 |