| Param | Original file | Final file |
|---|---|---|
| Filename | modeM0/AS1T05_138T01_9000005828_42840cztM0_level2.fits | modeM0/AS1T05_138T01_9000005828_42840cztM0_level2_quad_clean.evt |
| Size (bytes) | 401,901,120 | 90,037,440 |
| Size | 383.3 MB | 85.9 MB |
| Events in quadrant A | 3,267,337 | 605,055 |
| Events in quadrant B | 2,812,060 | 622,881 |
| Events in quadrant C | 3,107,993 | 605,602 |
| Events in quadrant D | 5,250,255 | 497,301 |
| Mode M0 | |||
|---|---|---|---|
| Quadrant | BADHDUFLAG | Total packets | Discarded packets |
| A | 0 | 13121 | 2 |
| B | 0 | 12324 | 3 |
| C | 0 | 12767 | 2 |
| D | 0 | 19616 | 2 |
| Mode M9 | |||
|---|---|---|---|
| Quadrant | BADHDUFLAG | Total packets | Discarded packets |
| A | 0 | 29 | 0 |
| B | 0 | 30 | 0 |
| C | 0 | 30 | 0 |
| D | 0 | 30 | 0 |
| Mode SS | |||
|---|---|---|---|
| Quadrant | BADHDUFLAG | Total packets | Discarded packets |
| A | 0 | 116 | 0 |
| B | 0 | 116 | 0 |
| C | 0 | 116 | 0 |
| D | 0 | 116 | 0 |
| Quadrant | Total seconds | Saturated seconds | Saturation percentage |
|---|---|---|---|
| A | 5647 | 46 | 0.814592% |
| B | 5646 | 76 | 1.346086% |
| C | 5646 | 48 | 0.850159% |
| D | 5646 | 717 | 12.699256% |
Noise dominated data is calculated using 1-second bins in cleaned event files. If a bin has >2000 counts, and if more than 50% of those come from <1% of pixels, then it is considered to be noise-dominated and hence unusable.
| Quadrant | # 1 sec bins | Bins with >0 counts | Bins with >2000 counts | High rate bins dominated by noise | Noise dominated (total time) | Noise dominated (detector-on time) | Marked lightcurve |
|---|---|---|---|---|---|---|---|
| A | 7290 | 5648 | 31 | 31 | 0.43% | 0.55% | 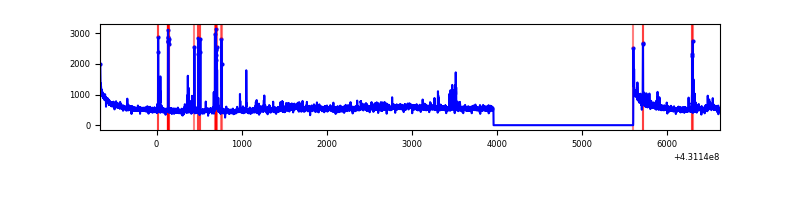 |
| B | 7289 | 5647 | 34 | 34 | 0.47% | 0.60% | 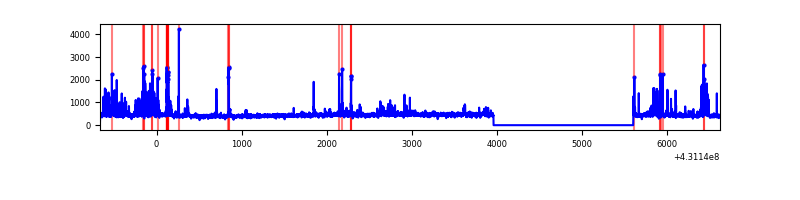 |
| C | 7289 | 5647 | 52 | 52 | 0.71% | 0.92% | 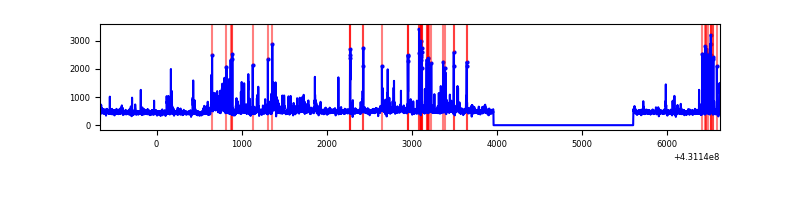 |
| D | 7289 | 5647 | 644 | 644 | 8.84% | 11.40% | 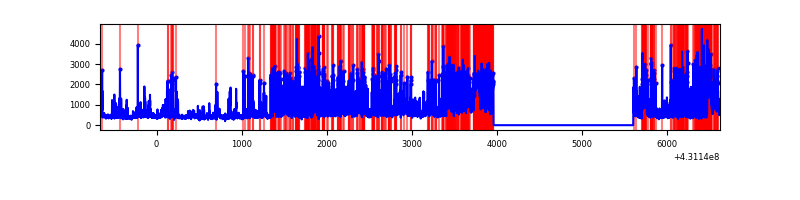 |
Top three noisy pixels from each quadrant. If the there are fewer than three noisy pixels in the level2.evt file, extra rows are filled as -1
| Pixel properties | Quadrant properties | ||||||
|---|---|---|---|---|---|---|---|
| Quadrant | DetID | PixID | Counts | Sigma | Mean | Median | Sigma |
| A | 10 | 83 | 599536 | 4744.24 | 607 | 595 | 126.2 |
| A | 15 | 237 | 148446 | 1171.13 | 607 | 595 | 126.2 |
| A | 15 | 222 | 74580 | 586.04 | 607 | 595 | 126.2 |
| B | 4 | 171 | 327128 | 2765.14 | 608 | 593 | 118.1 |
| B | 5 | 255 | 38800 | 323.54 | 608 | 593 | 118.1 |
| B | 5 | 172 | 26498 | 219.37 | 608 | 593 | 118.1 |
| C | 14 | 254 | 277858 | 1962.74 | 600 | 604 | 141.3 |
| C | 15 | 214 | 231868 | 1637.16 | 600 | 604 | 141.3 |
| C | 7 | 220 | 194666 | 1373.8 | 600 | 604 | 141.3 |
| D | 1 | 52 | 2238973 | 16062.36 | 563 | 547 | 139.4 |
| D | 2 | 249 | 215568 | 1542.93 | 563 | 547 | 139.4 |
| D | 10 | 118 | 141595 | 1012.12 | 563 | 547 | 139.4 |
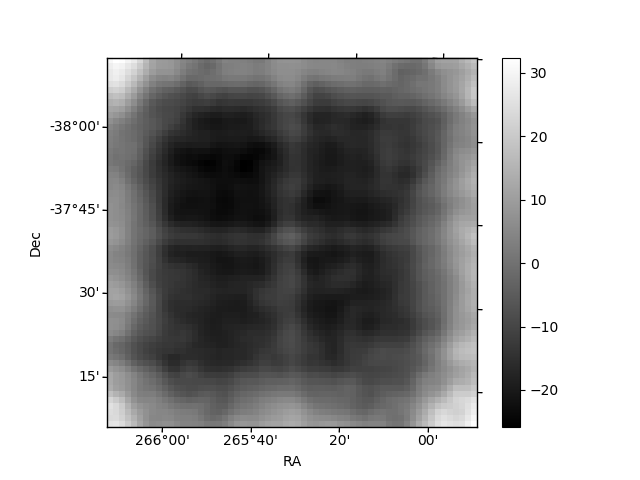
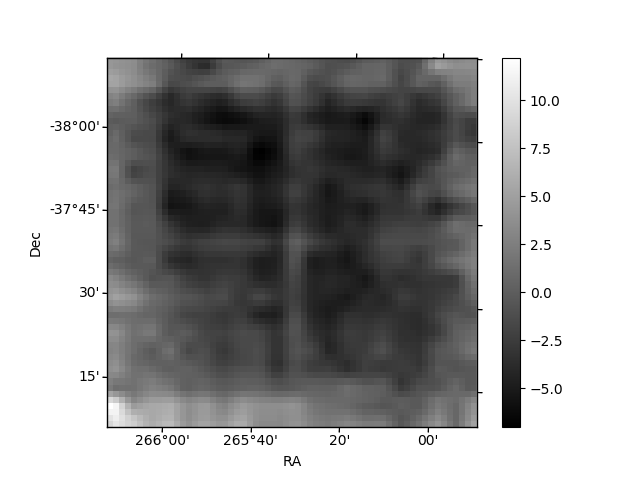
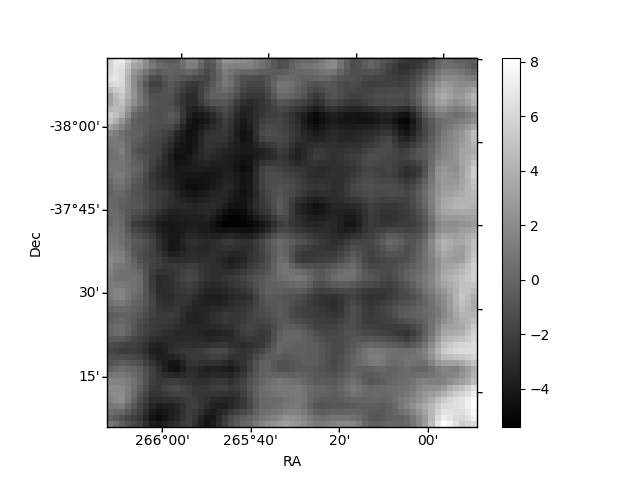
Histogram calculated using DETX and DETY for each event in the final _common_clean file
| Quadrant A | 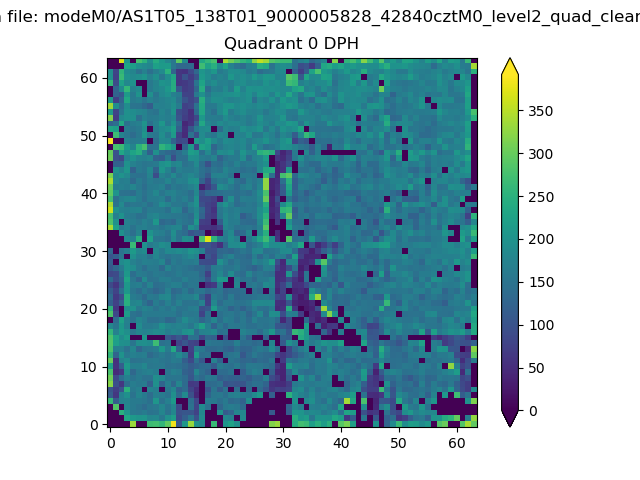 |
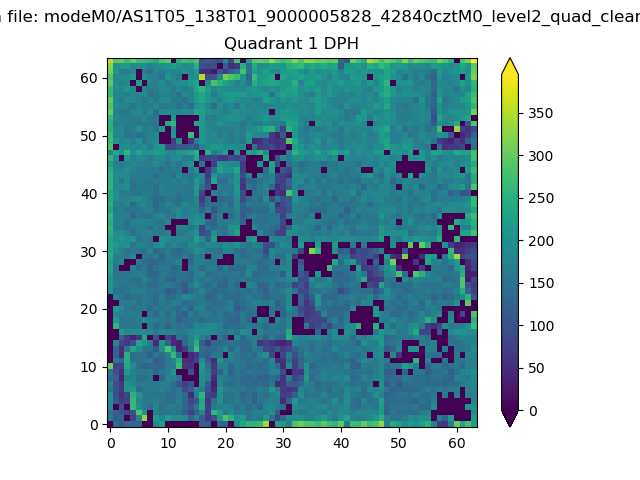 |
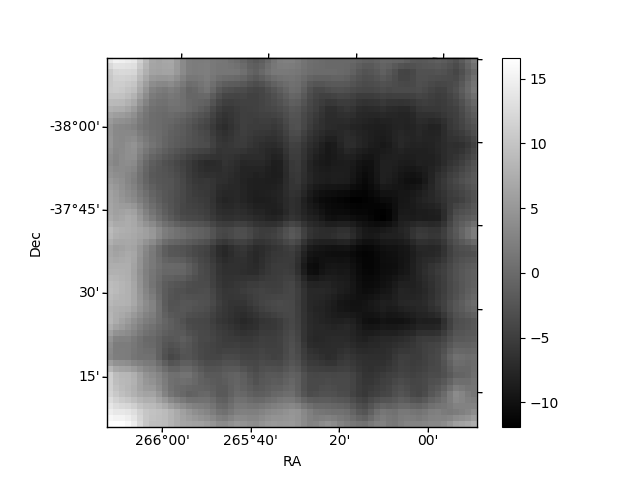
Quadrant B |
|---|---|---|---|
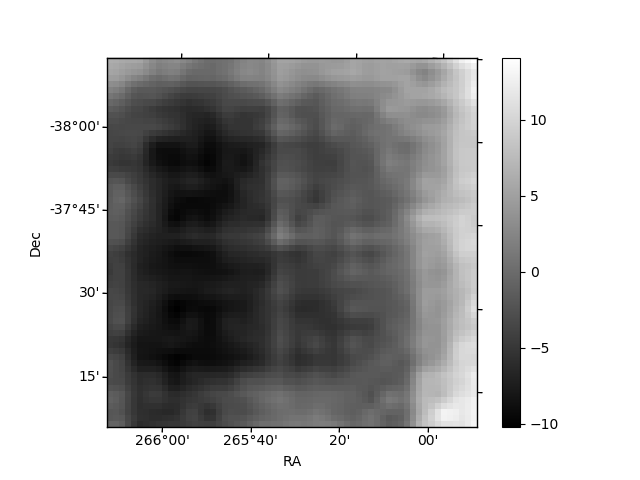
| Quadrant D | 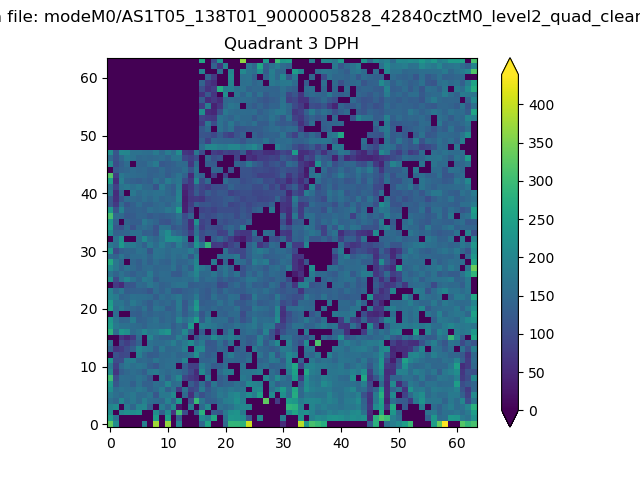 |
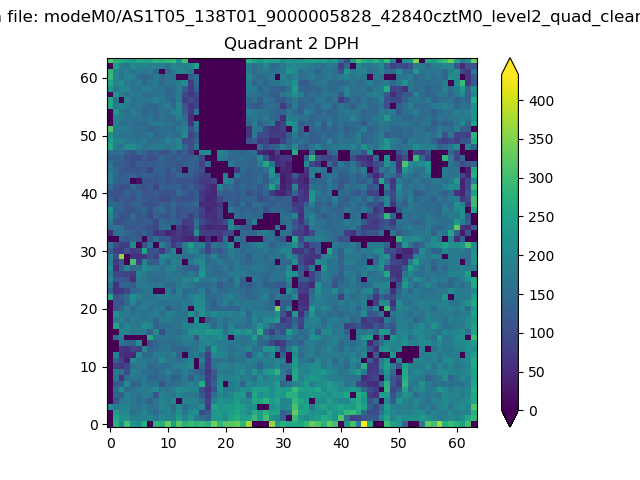 |
Quadrant C |
| Plot type | Count rate plots | Images |
|---|---|---|
| Comparison with Poisson distribution Blue bars denote a histogram of data divided into 1 sec bins. Red curve is a Poisson curve with rate = median count rate of data. |
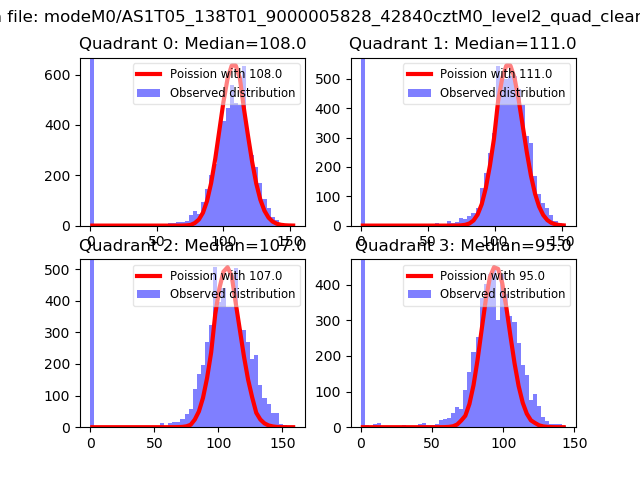 |
 |
| Quadrant-wise count rates Data is divided into 100 sec bins |
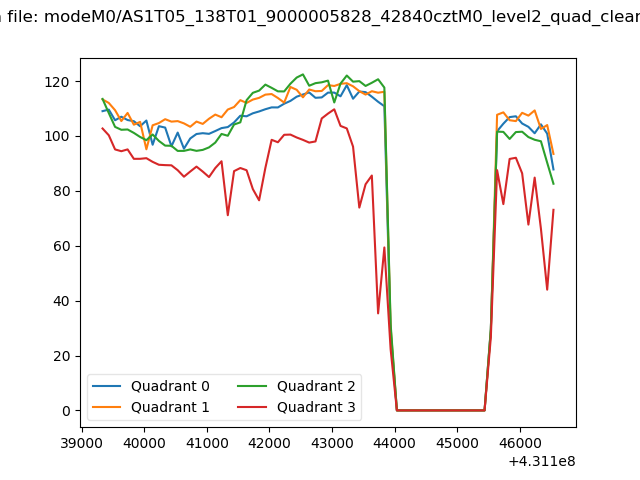 |
|
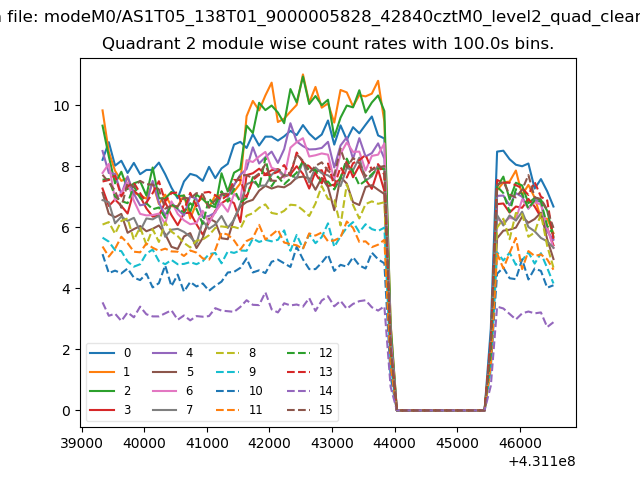
| Module-wise count rates for Quadrant A Data is divided into 100 sec bins |
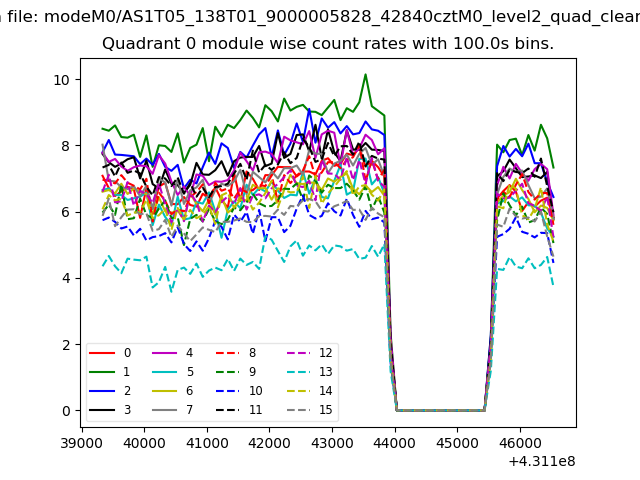 |
 |
| Module-wise count rates for Quadrant B Data is divided into 100 sec bins |
 |
 |
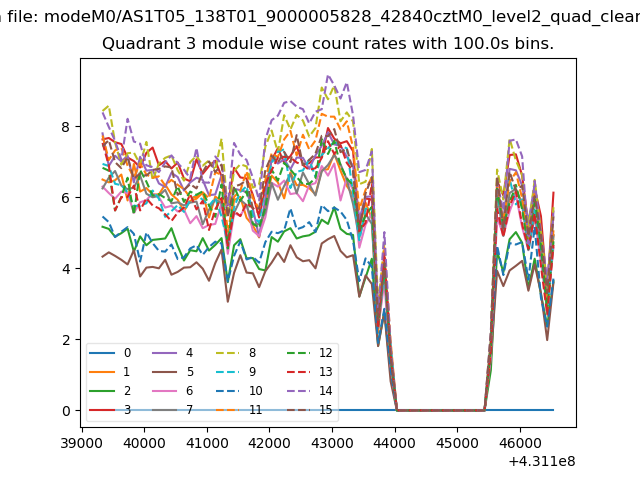
| Module-wise count rates for Quadrant C Data is divided into 100 sec bins |
 |
 |
| Module-wise count rates for Quadrant D Data is divided into 100 sec bins |
 |
 |
| Parameter | Plot |
|---|---|
| CZT HV Monitor | 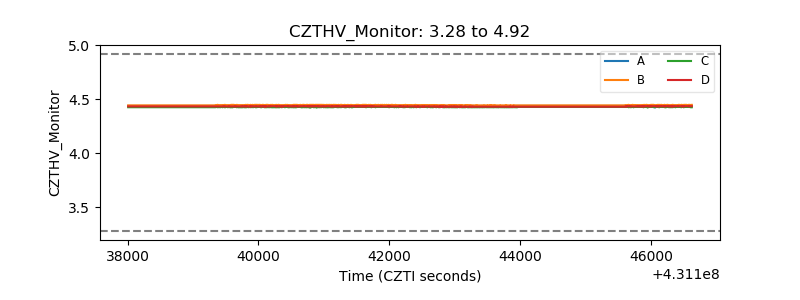 |
| D_VDD | 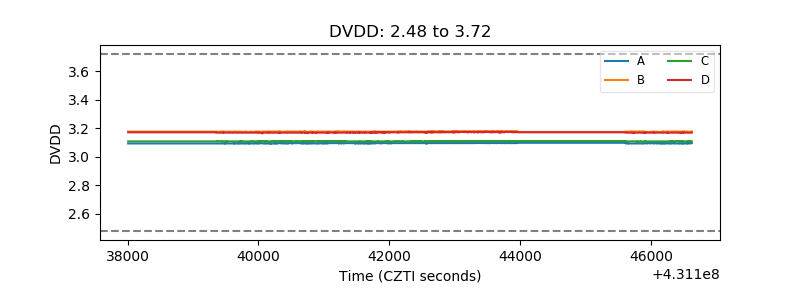 |
| Temperature 1 | 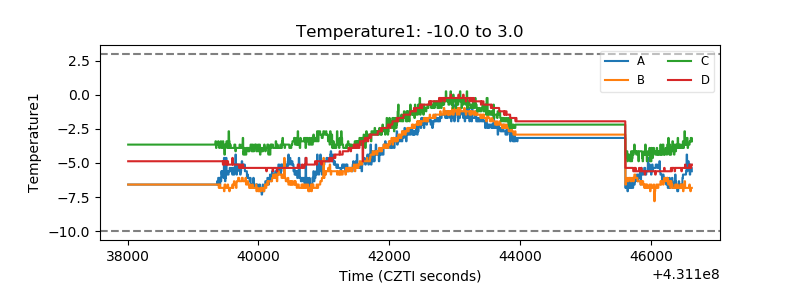 |
| Veto HV Monitor | 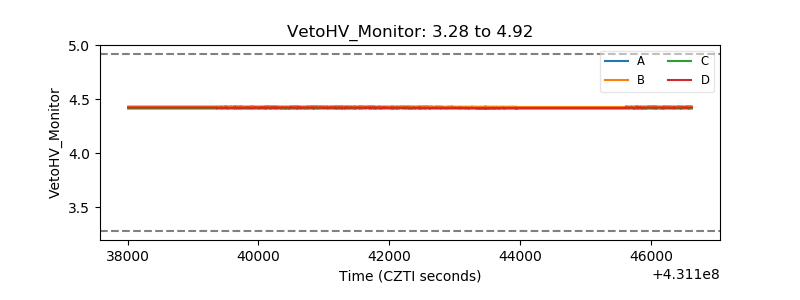 |
| Veto LLD | 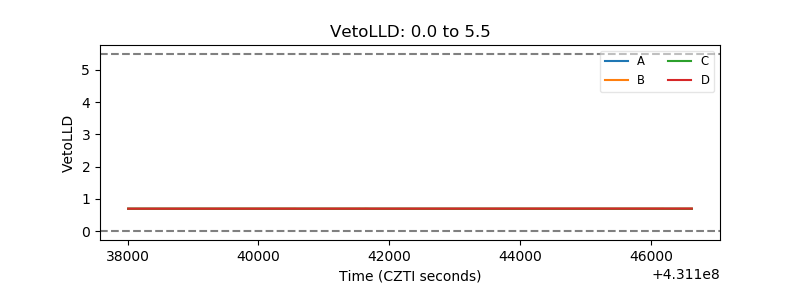 |
| Alpha Counter | 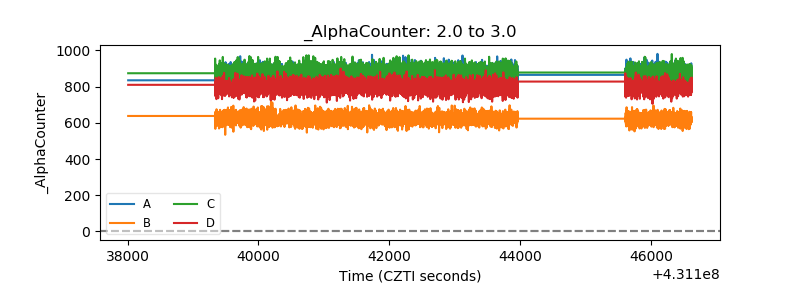 |
| _CPM_Rate | 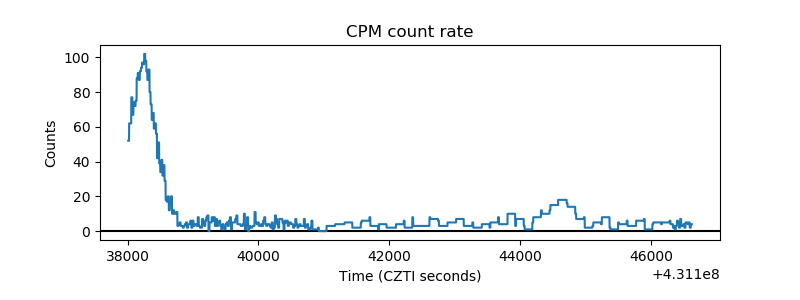 |
| CZT Counter | 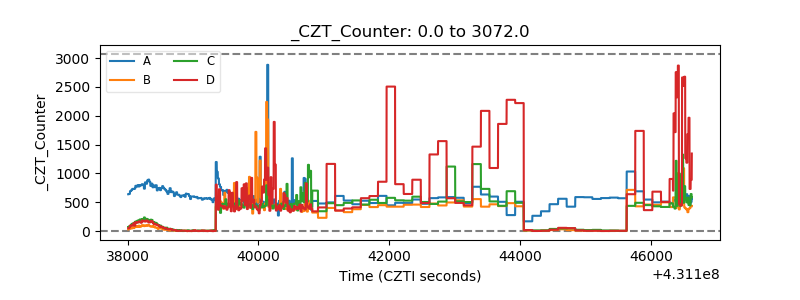 |
| +2.5 Volts monitor | 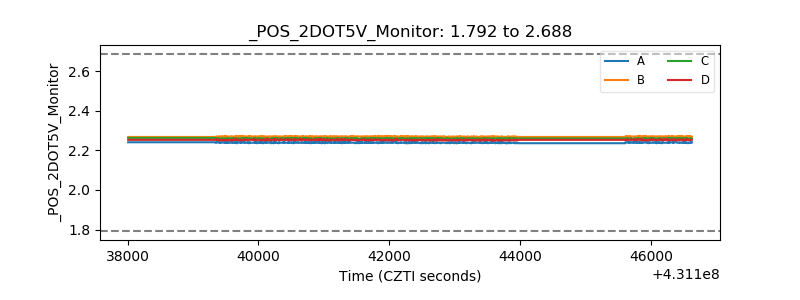 |
| +5 Volts monitor | 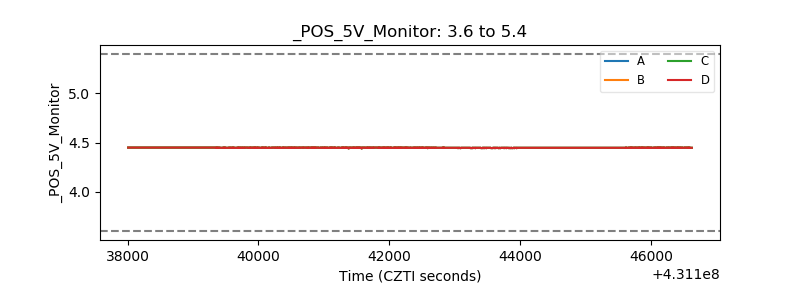 |
| _ROLL_ROT | 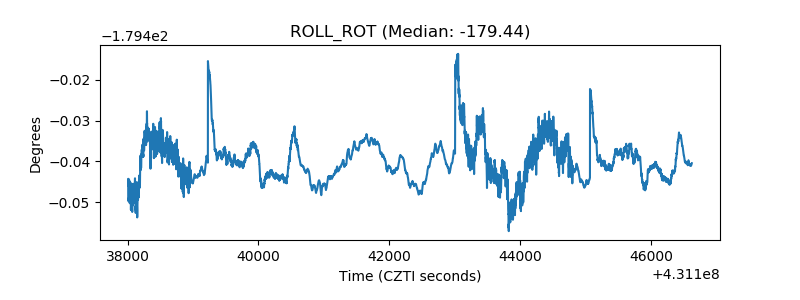 |
| _Roll_DEC | 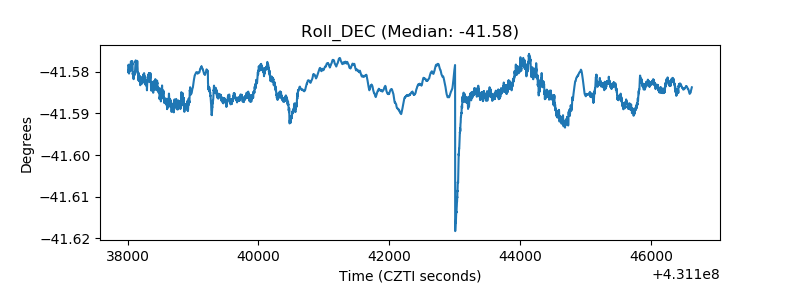 |
| _Roll_RA | 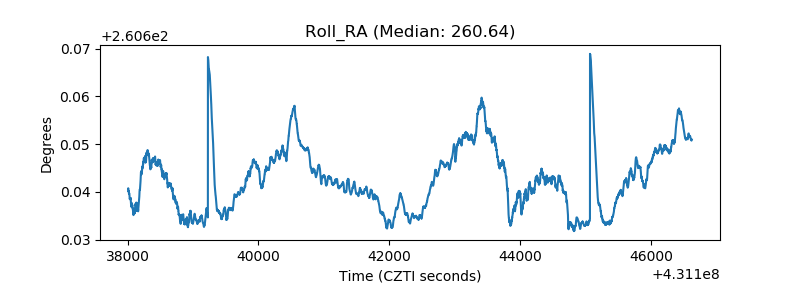 |
| Veto Counter | 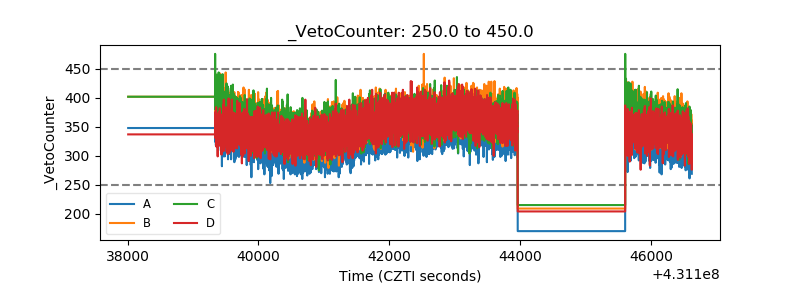 |