| Param | Original file | Final file |
|---|---|---|
| Filename | modeM0/AS1T05_138T01_9000005828_42841cztM0_level2.fits | modeM0/AS1T05_138T01_9000005828_42841cztM0_level2_quad_clean.evt |
| Size (bytes) | 446,155,200 | 91,255,680 |
| Size | 425.5 MB | 87.0 MB |
| Events in quadrant A | 3,461,365 | 613,900 |
| Events in quadrant B | 2,719,250 | 635,403 |
| Events in quadrant C | 3,704,395 | 617,596 |
| Events in quadrant D | 6,182,239 | 492,913 |
| Mode M0 | |||
|---|---|---|---|
| Quadrant | BADHDUFLAG | Total packets | Discarded packets |
| A | 0 | 13872 | 2 |
| B | 0 | 12132 | 2 |
| C | 0 | 14722 | 2 |
| D | 0 | 22341 | 2 |
| Mode M9 | |||
|---|---|---|---|
| Quadrant | BADHDUFLAG | Total packets | Discarded packets |
| A | 0 | 15 | 0 |
| B | 0 | 16 | 0 |
| C | 0 | 16 | 0 |
| D | 0 | 16 | 0 |
| Mode SS | |||
|---|---|---|---|
| Quadrant | BADHDUFLAG | Total packets | Discarded packets |
| A | 0 | 118 | 0 |
| B | 0 | 118 | 0 |
| C | 0 | 118 | 0 |
| D | 0 | 118 | 0 |
| Quadrant | Total seconds | Saturated seconds | Saturation percentage |
|---|---|---|---|
| A | 5766 | 48 | 0.832466% |
| B | 5766 | 35 | 0.607007% |
| C | 5766 | 100 | 1.734305% |
| D | 5766 | 931 | 16.146375% |
Noise dominated data is calculated using 1-second bins in cleaned event files. If a bin has >2000 counts, and if more than 50% of those come from <1% of pixels, then it is considered to be noise-dominated and hence unusable.
| Quadrant | # 1 sec bins | Bins with >0 counts | Bins with >2000 counts | High rate bins dominated by noise | Noise dominated (total time) | Noise dominated (detector-on time) | Marked lightcurve |
|---|---|---|---|---|---|---|---|
| A | 7168 | 5767 | 33 | 33 | 0.46% | 0.57% | 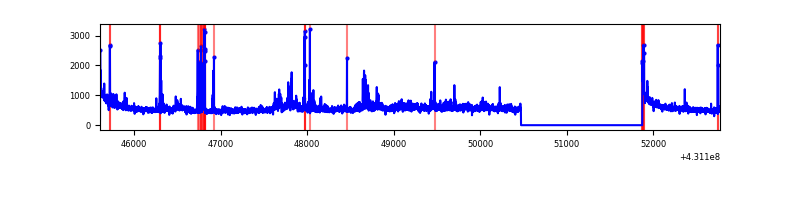 |
| B | 7168 | 5767 | 10 | 10 | 0.14% | 0.17% | 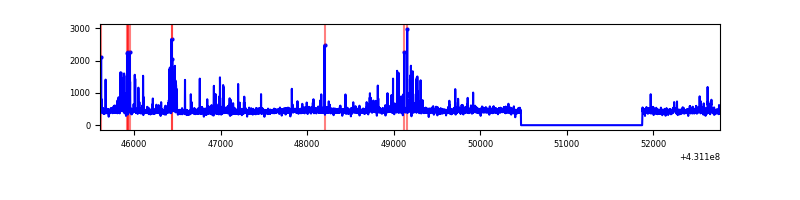 |
| C | 7168 | 5767 | 105 | 105 | 1.46% | 1.82% | 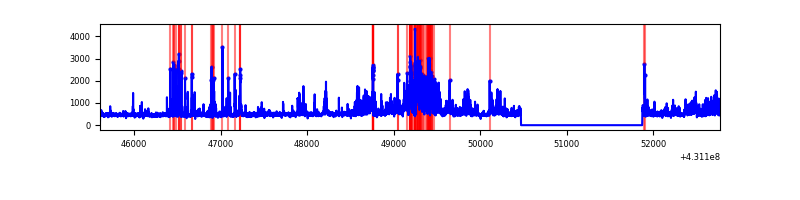 |
| D | 7168 | 5767 | 862 | 862 | 12.03% | 14.95% | 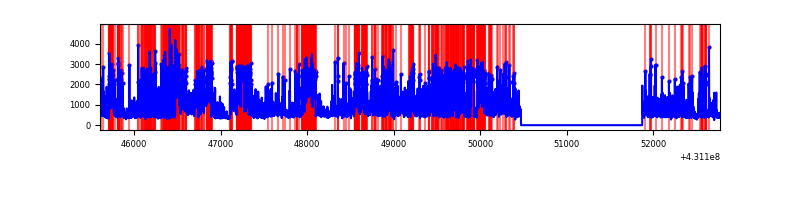 |
Top three noisy pixels from each quadrant. If the there are fewer than three noisy pixels in the level2.evt file, extra rows are filled as -1
| Pixel properties | Quadrant properties | ||||||
|---|---|---|---|---|---|---|---|
| Quadrant | DetID | PixID | Counts | Sigma | Mean | Median | Sigma |
| A | 10 | 83 | 605077 | 4684.21 | 622 | 608 | 129.0 |
| A | 15 | 237 | 185562 | 1433.26 | 622 | 608 | 129.0 |
| A | 15 | 222 | 153975 | 1188.49 | 622 | 608 | 129.0 |
| B | 4 | 171 | 127710 | 1040.98 | 621 | 602 | 122.1 |
| B | 15 | 85 | 50228 | 406.42 | 621 | 602 | 122.1 |
| B | 5 | 255 | 42030 | 339.28 | 621 | 602 | 122.1 |
| C | 7 | 220 | 610104 | 4231.41 | 611 | 614 | 144.0 |
| C | 14 | 254 | 402915 | 2792.99 | 611 | 614 | 144.0 |
| C | 15 | 214 | 234887 | 1626.45 | 611 | 614 | 144.0 |
| D | 1 | 52 | 3102785 | 22209.43 | 568 | 550 | 139.7 |
| D | 13 | 171 | 268913 | 1921.26 | 568 | 550 | 139.7 |
| D | 12 | 233 | 232410 | 1659.93 | 568 | 550 | 139.7 |
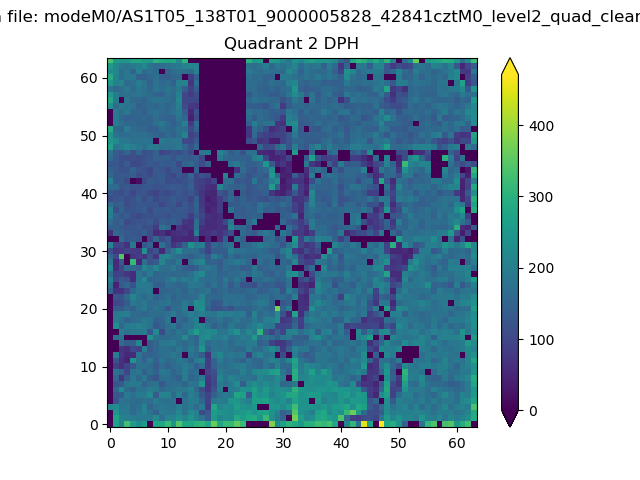
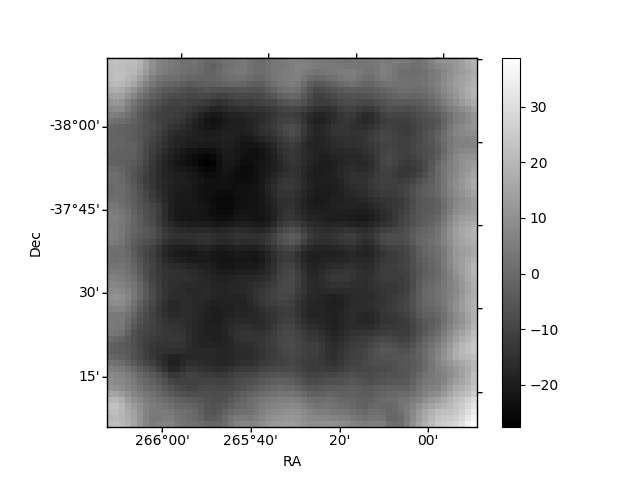
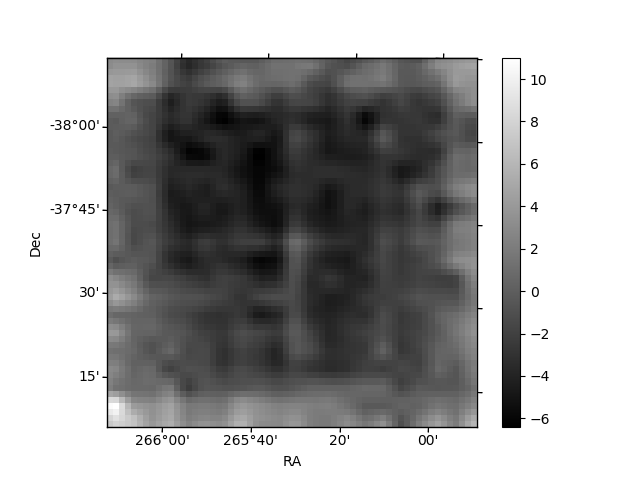
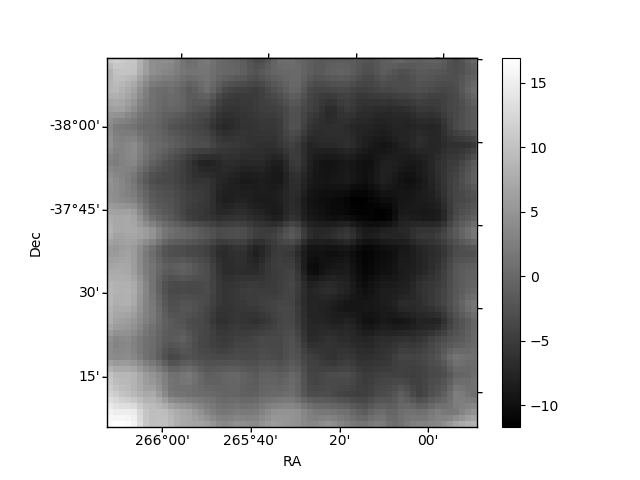
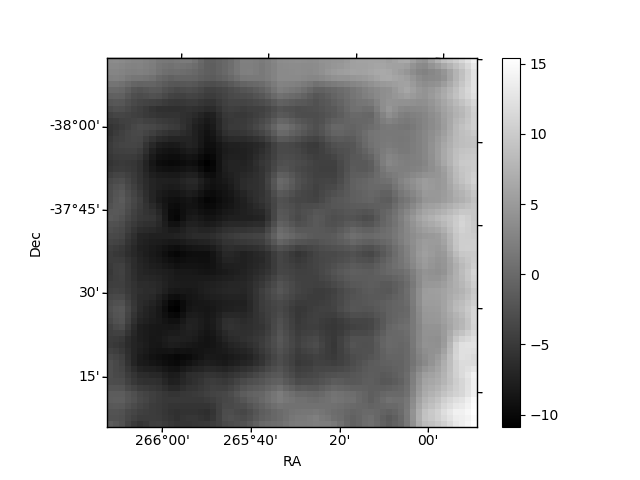
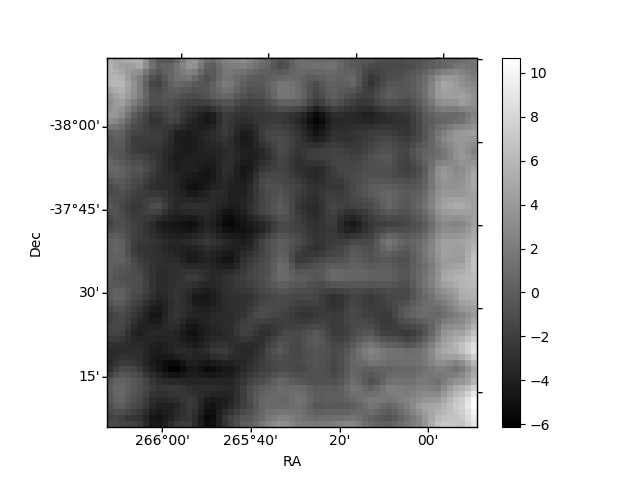
Histogram calculated using DETX and DETY for each event in the final _common_clean file
| Quadrant A | 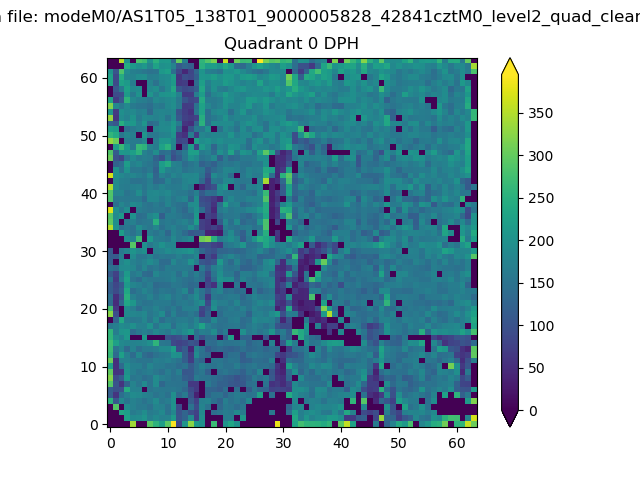 |
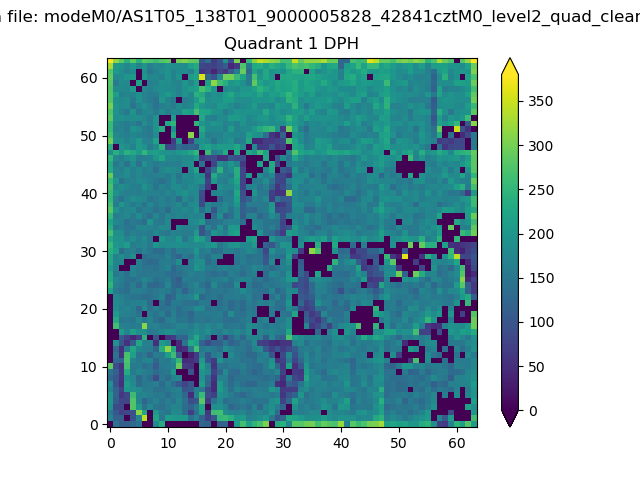 |
Quadrant B |
|---|---|---|---|
| Quadrant D | 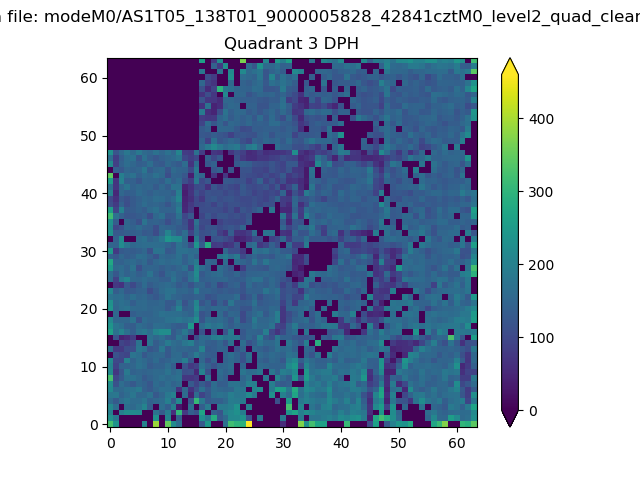 |
 |
Quadrant C |
| Plot type | Count rate plots | Images |
|---|---|---|
| Comparison with Poisson distribution Blue bars denote a histogram of data divided into 1 sec bins. Red curve is a Poisson curve with rate = median count rate of data. |
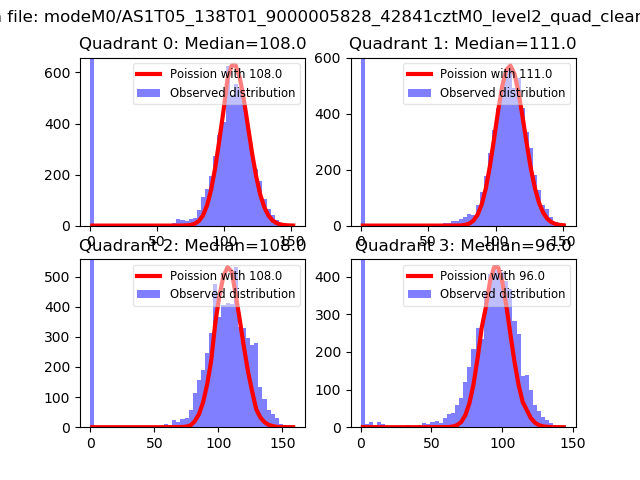 |
 |
| Quadrant-wise count rates Data is divided into 100 sec bins |
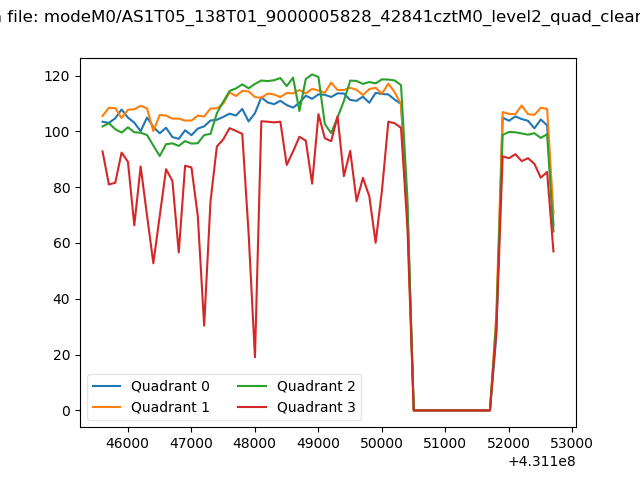 |
|
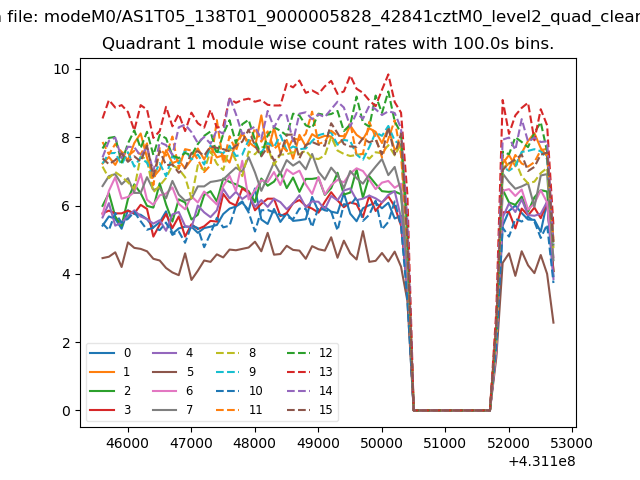
| Module-wise count rates for Quadrant A Data is divided into 100 sec bins |
 |
 |
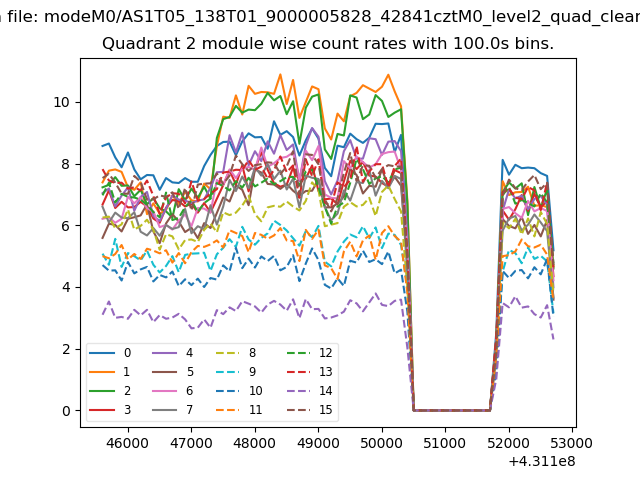
| Module-wise count rates for Quadrant B Data is divided into 100 sec bins |
 |
 |
| Module-wise count rates for Quadrant C Data is divided into 100 sec bins |
 |
 |
| Module-wise count rates for Quadrant D Data is divided into 100 sec bins |
 |
 |
| Parameter | Plot |
|---|---|
| CZT HV Monitor |  |
| D_VDD | 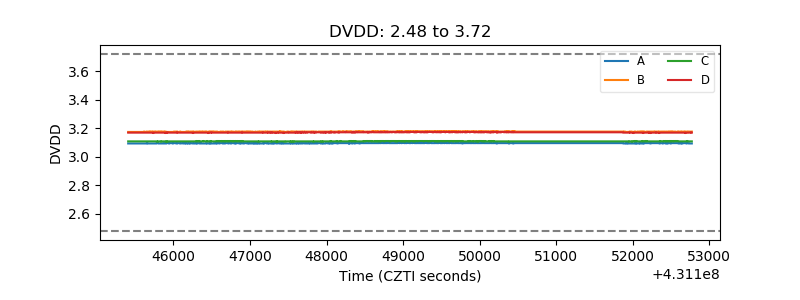 |
| Temperature 1 | 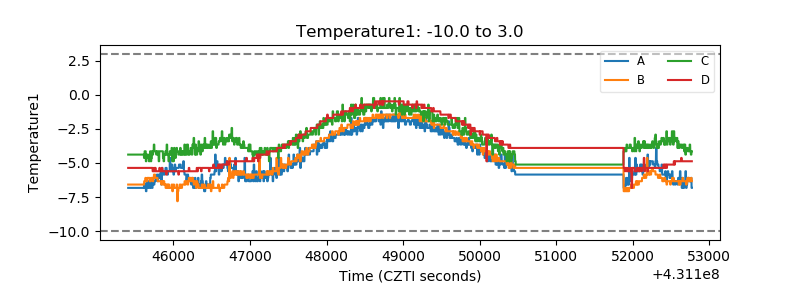 |
| Veto HV Monitor | 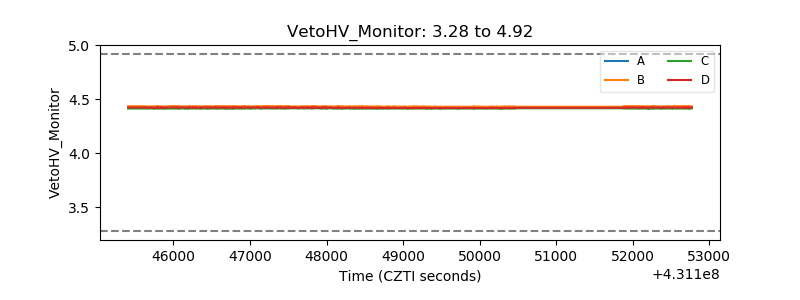 |
| Veto LLD | 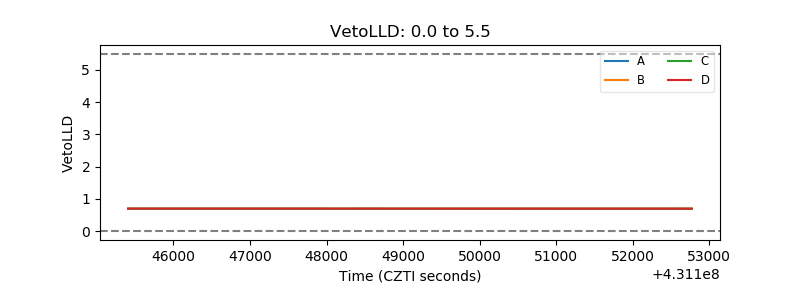 |
| Alpha Counter | 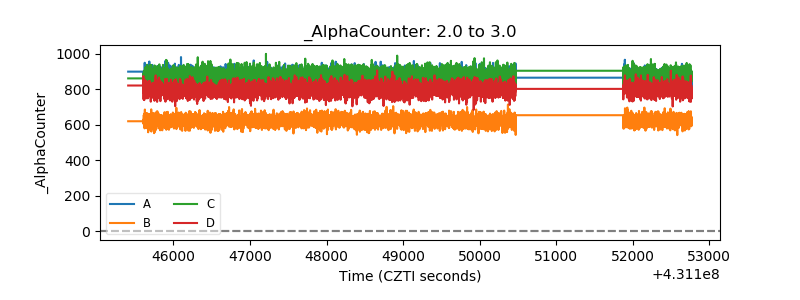 |
| _CPM_Rate | 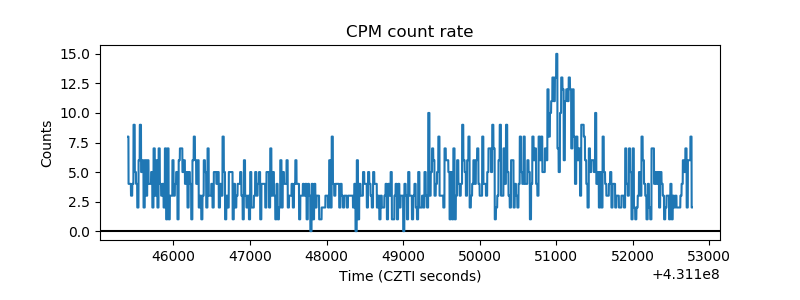 |
| CZT Counter | 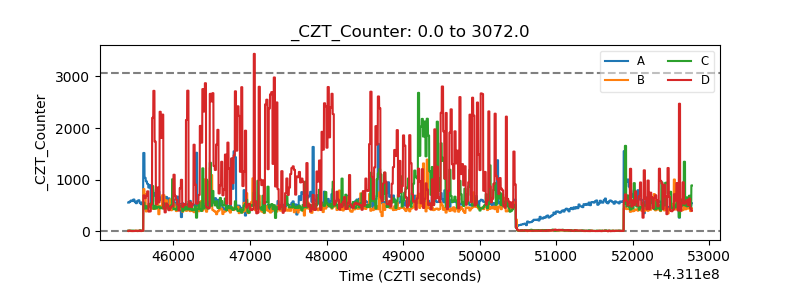 |
| +2.5 Volts monitor | 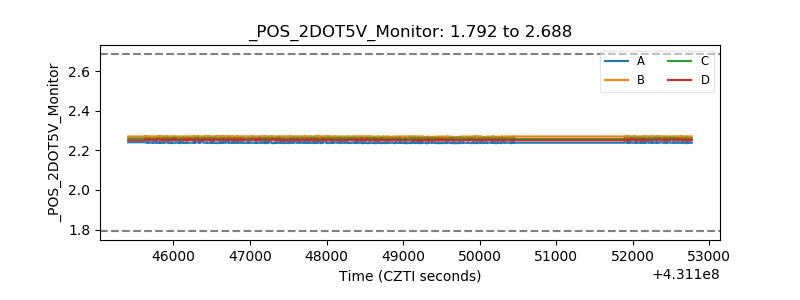 |
| +5 Volts monitor |  |
| _ROLL_ROT | 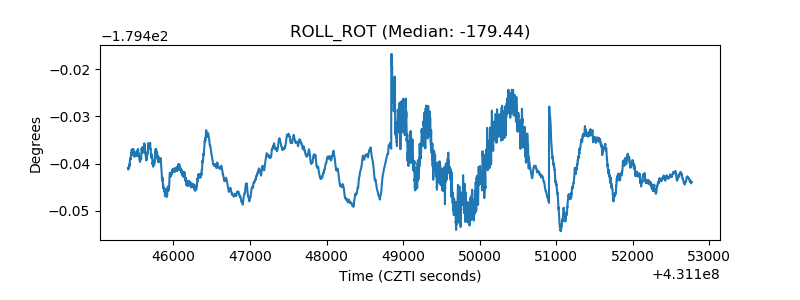 |
| _Roll_DEC | 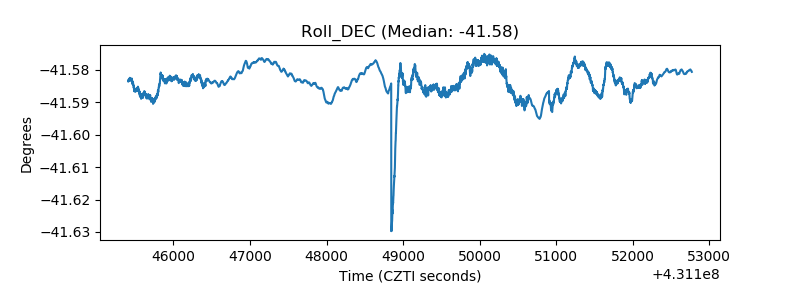 |
| _Roll_RA | 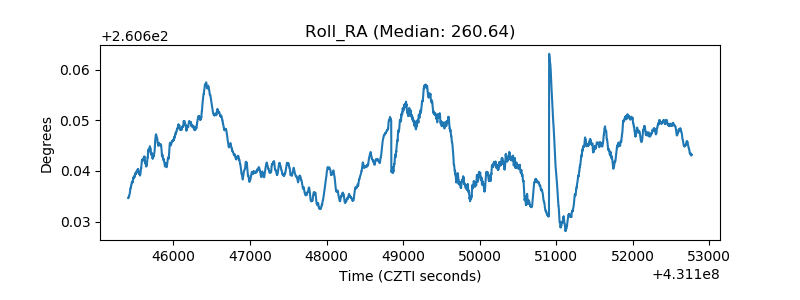 |
| Veto Counter | 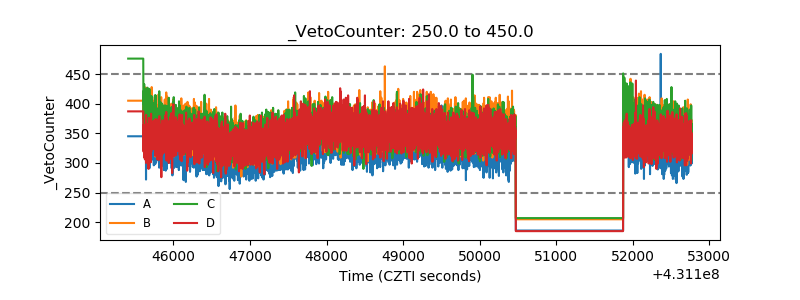 |