| Param | Original file | Final file |
|---|---|---|
| Filename | modeM0/AS1T05_138T01_9000005828_42842cztM0_level2.fits | modeM0/AS1T05_138T01_9000005828_42842cztM0_level2_quad_clean.evt |
| Size (bytes) | 449,781,120 | 94,487,040 |
| Size | 428.9 MB | 90.1 MB |
| Events in quadrant A | 3,384,836 | 631,824 |
| Events in quadrant B | 2,632,490 | 655,737 |
| Events in quadrant C | 3,851,347 | 642,055 |
| Events in quadrant D | 6,320,247 | 516,713 |
| Mode M0 | |||
|---|---|---|---|
| Quadrant | BADHDUFLAG | Total packets | Discarded packets |
| A | 0 | 13490 | 2 |
| B | 0 | 12058 | 2 |
| C | 0 | 15220 | 2 |
| D | 0 | 22871 | 2 |
| Mode M9 | |||
|---|---|---|---|
| Quadrant | BADHDUFLAG | Total packets | Discarded packets |
| A | 0 | 15 | 0 |
| B | 0 | 16 | 0 |
| C | 0 | 16 | 0 |
| D | 0 | 16 | 0 |
| Mode SS | |||
|---|---|---|---|
| Quadrant | BADHDUFLAG | Total packets | Discarded packets |
| A | 0 | 122 | 0 |
| B | 0 | 122 | 0 |
| C | 0 | 122 | 0 |
| D | 0 | 122 | 0 |
| Quadrant | Total seconds | Saturated seconds | Saturation percentage |
|---|---|---|---|
| A | 5928 | 42 | 0.708502% |
| B | 5928 | 10 | 0.168691% |
| C | 5927 | 70 | 1.181036% |
| D | 5927 | 921 | 15.539059% |
Noise dominated data is calculated using 1-second bins in cleaned event files. If a bin has >2000 counts, and if more than 50% of those come from <1% of pixels, then it is considered to be noise-dominated and hence unusable.
| Quadrant | # 1 sec bins | Bins with >0 counts | Bins with >2000 counts | High rate bins dominated by noise | Noise dominated (total time) | Noise dominated (detector-on time) | Marked lightcurve |
|---|---|---|---|---|---|---|---|
| A | 7241 | 5929 | 31 | 31 | 0.43% | 0.52% |  |
| B | 7241 | 5929 | 4 | 4 | 0.06% | 0.07% |  |
| C | 7240 | 5928 | 70 | 70 | 0.97% | 1.18% |  |
| D | 7240 | 5928 | 853 | 853 | 11.78% | 14.39% | 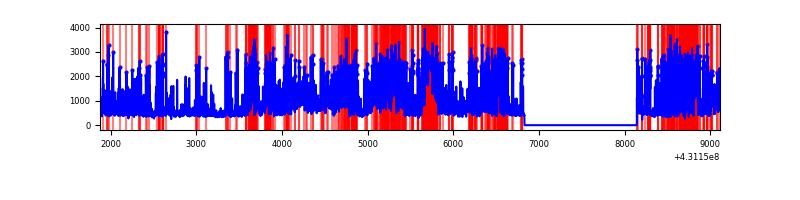 |
Top three noisy pixels from each quadrant. If the there are fewer than three noisy pixels in the level2.evt file, extra rows are filled as -1
| Pixel properties | Quadrant properties | ||||||
|---|---|---|---|---|---|---|---|
| Quadrant | DetID | PixID | Counts | Sigma | Mean | Median | Sigma |
| A | 10 | 83 | 635369 | 4758.12 | 642 | 628 | 133.4 |
| A | 12 | 189 | 94289 | 702.1 | 642 | 628 | 133.4 |
| A | 15 | 237 | 69631 | 517.26 | 642 | 628 | 133.4 |
| B | 3 | 112 | 39607 | 308.34 | 643 | 623 | 126.4 |
| B | 0 | 245 | 26111 | 201.6 | 643 | 623 | 126.4 |
| B | 12 | 111 | 15690 | 119.17 | 643 | 623 | 126.4 |
| C | 7 | 220 | 750501 | 5004.32 | 633 | 637 | 149.8 |
| C | 14 | 254 | 336370 | 2240.56 | 633 | 637 | 149.8 |
| C | 15 | 214 | 243413 | 1620.2 | 633 | 637 | 149.8 |
| D | 1 | 52 | 3194501 | 21750.94 | 593 | 574 | 146.8 |
| D | 2 | 249 | 249085 | 1692.38 | 593 | 574 | 146.8 |
| D | 10 | 118 | 176162 | 1195.77 | 593 | 574 | 146.8 |
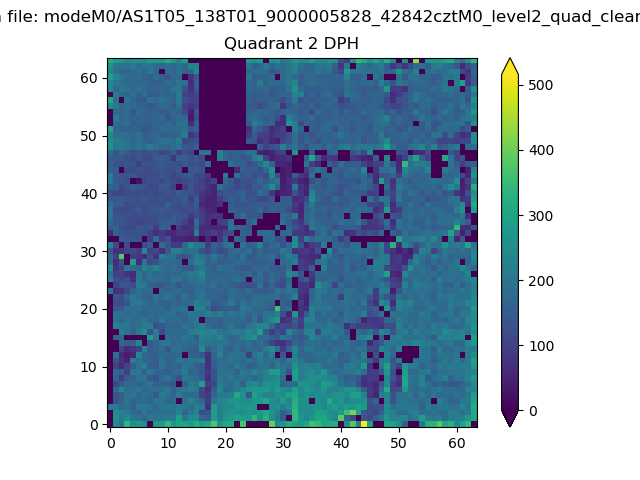
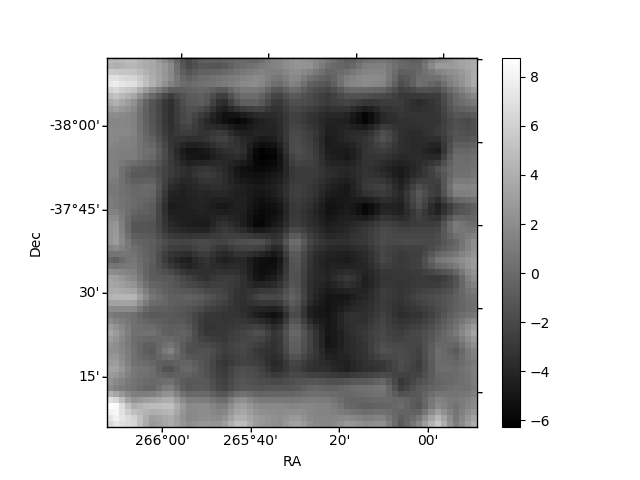
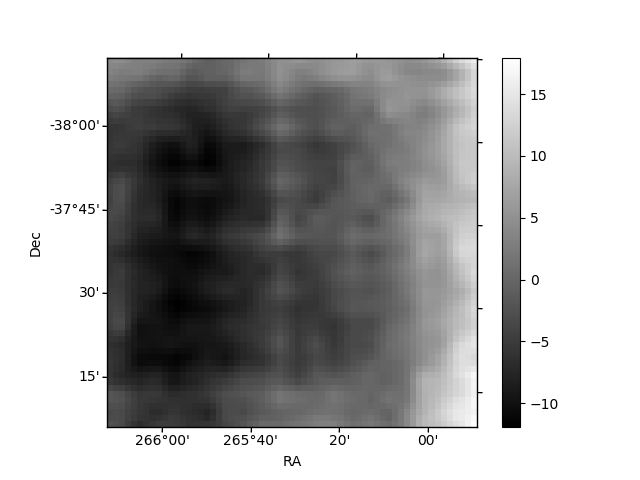
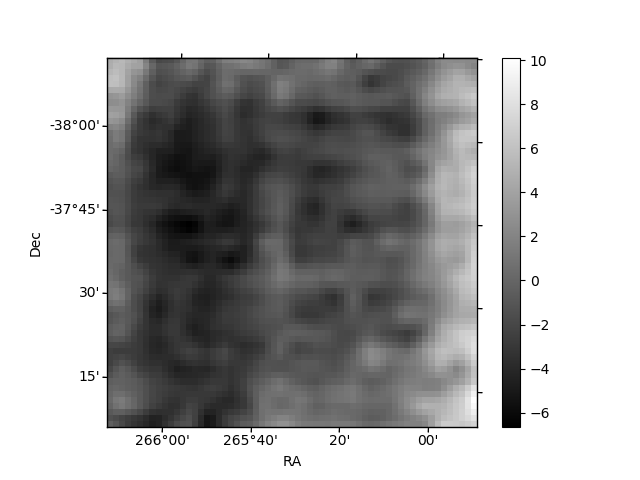
Histogram calculated using DETX and DETY for each event in the final _common_clean file
| Quadrant A | 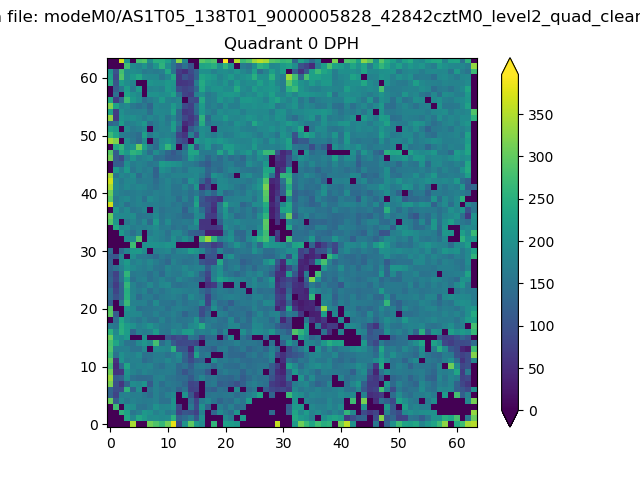 |
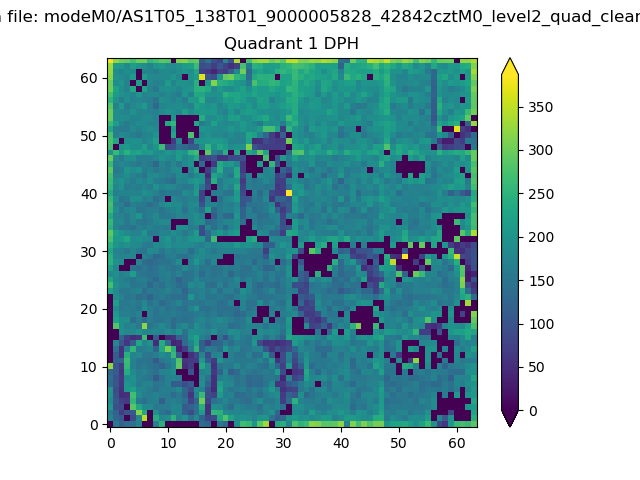 |
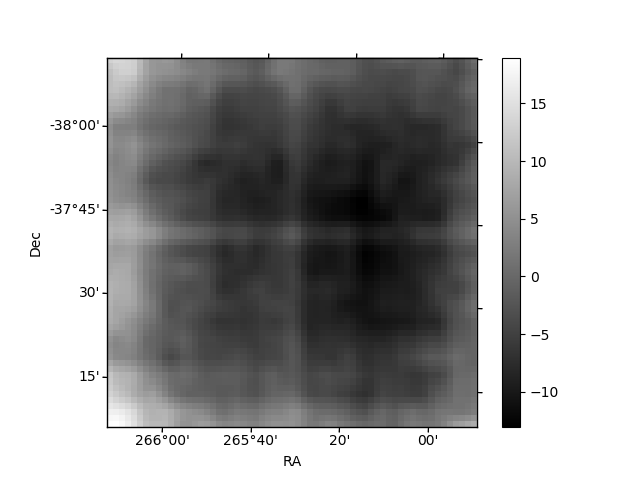
Quadrant B |
|---|---|---|---|
| Quadrant D | 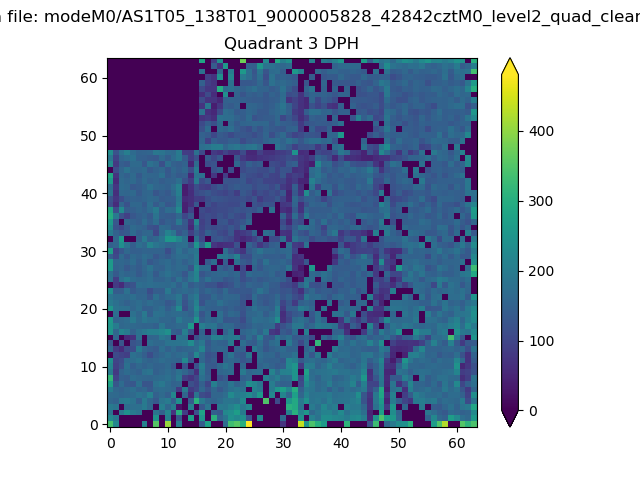 |
 |
Quadrant C |
| Plot type | Count rate plots | Images |
|---|---|---|
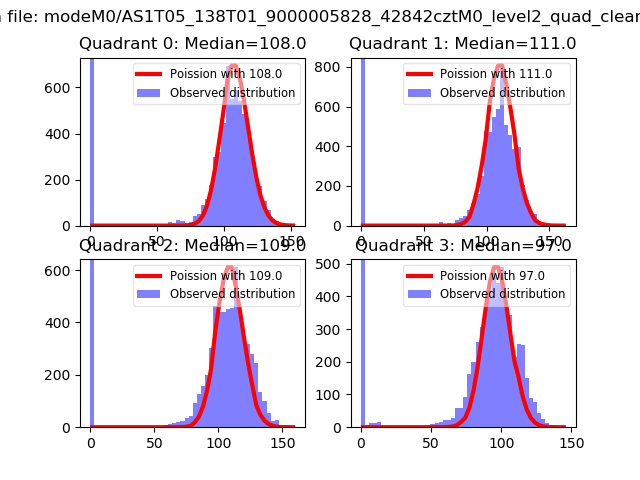
| Comparison with Poisson distribution Blue bars denote a histogram of data divided into 1 sec bins. Red curve is a Poisson curve with rate = median count rate of data. |
 |
 |
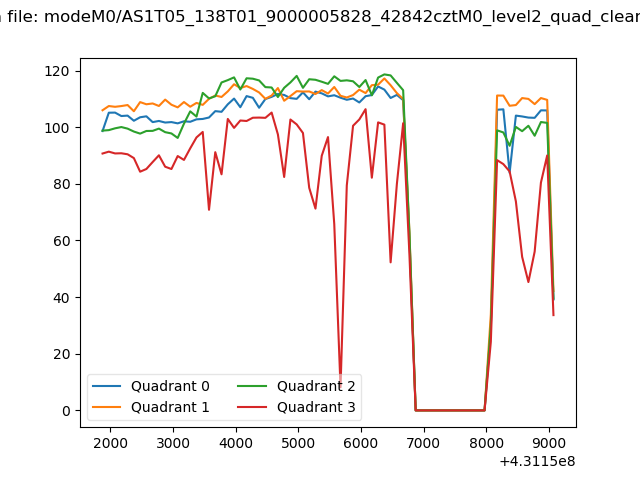
| Quadrant-wise count rates Data is divided into 100 sec bins |
 |
|
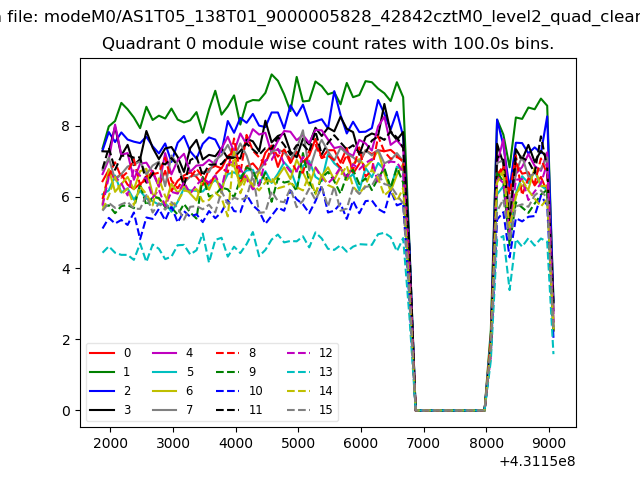
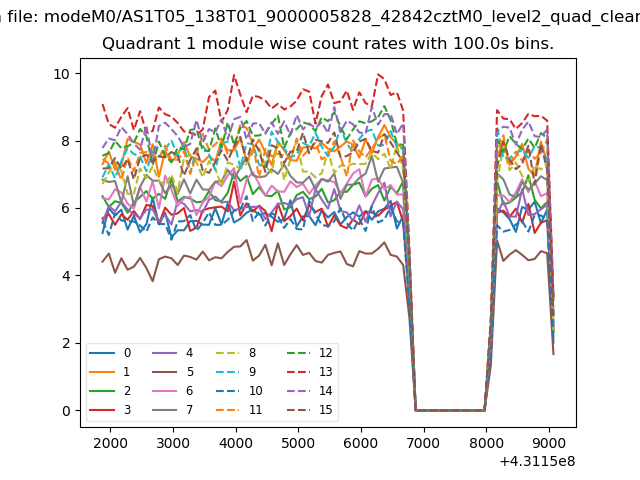
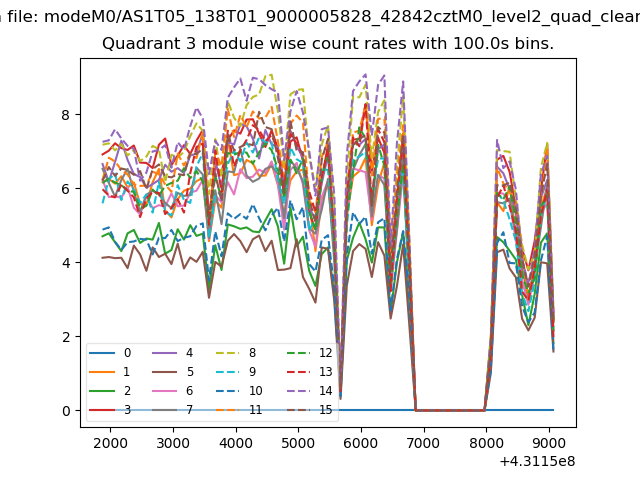
| Module-wise count rates for Quadrant A Data is divided into 100 sec bins |
 |
 |
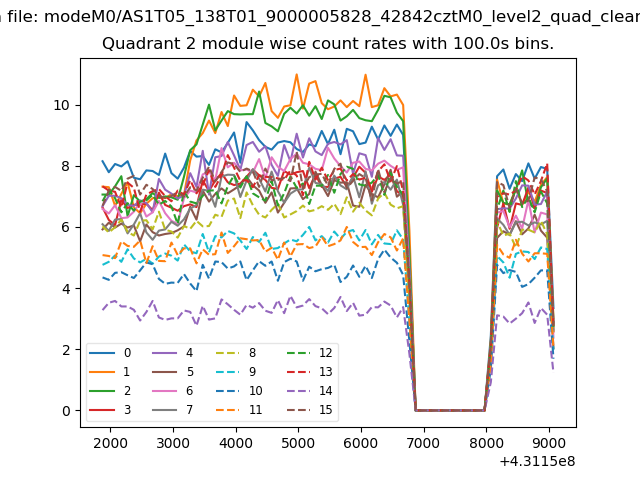
| Module-wise count rates for Quadrant B Data is divided into 100 sec bins |
 |
 |
| Module-wise count rates for Quadrant C Data is divided into 100 sec bins |
 |
 |
| Module-wise count rates for Quadrant D Data is divided into 100 sec bins |
 |
 |
| Parameter | Plot |
|---|---|
| CZT HV Monitor | 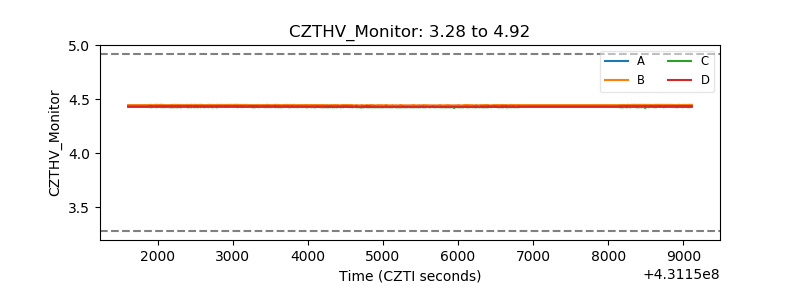 |
| D_VDD | 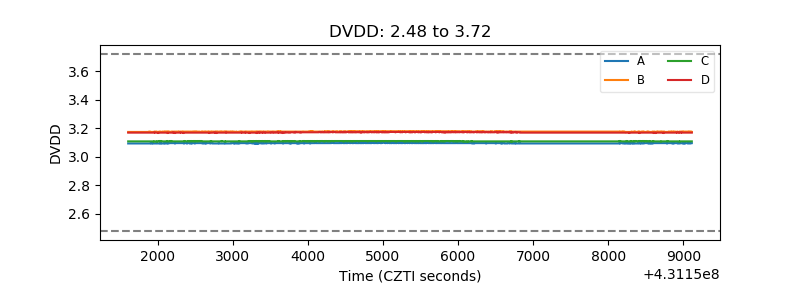 |
| Temperature 1 | 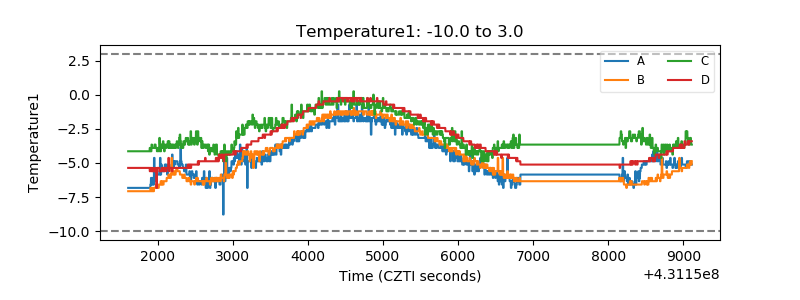 |
| Veto HV Monitor |  |
| Veto LLD | 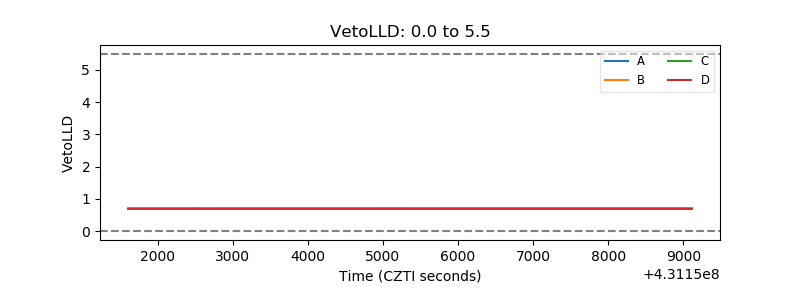 |
| Alpha Counter | 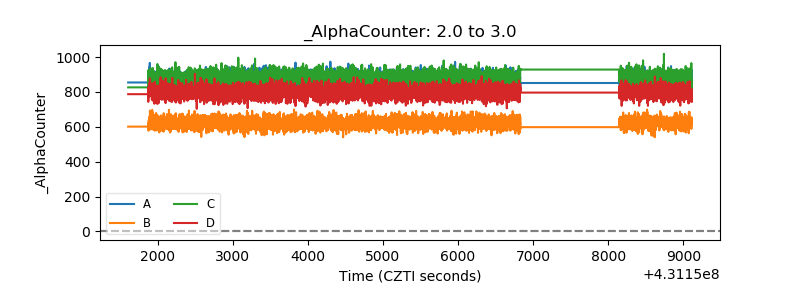 |
| _CPM_Rate | 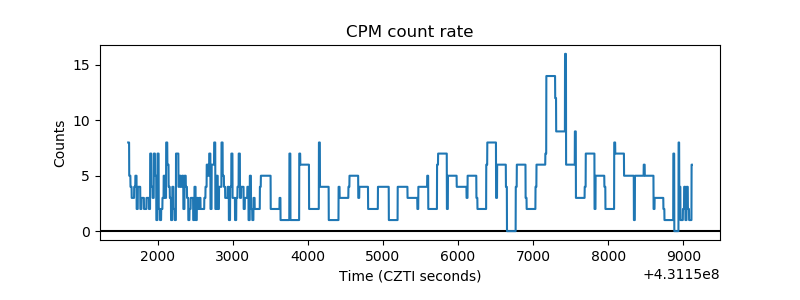 |
| CZT Counter | 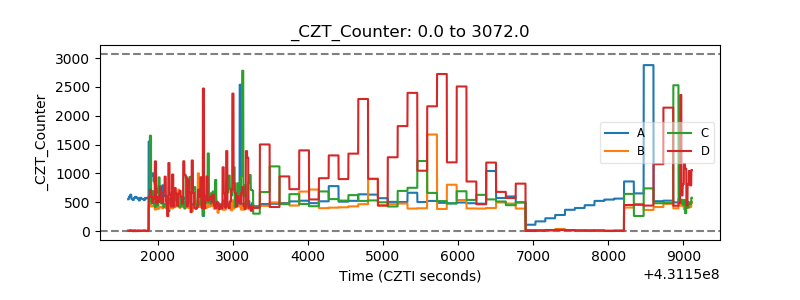 |
| +2.5 Volts monitor | 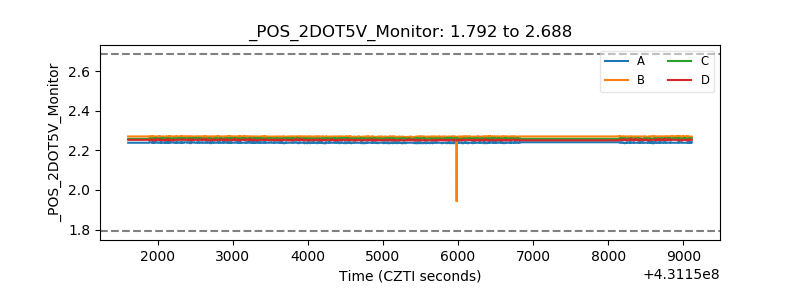 |
| +5 Volts monitor |  |
| _ROLL_ROT |  |
| _Roll_DEC | 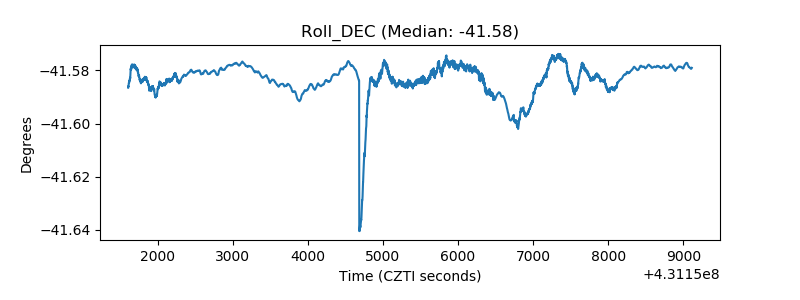 |
| _Roll_RA | 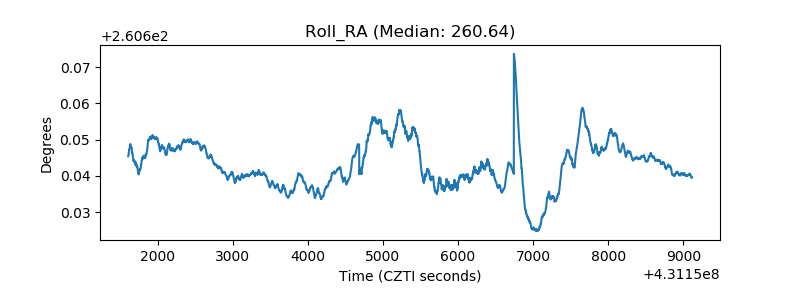 |
| Veto Counter | 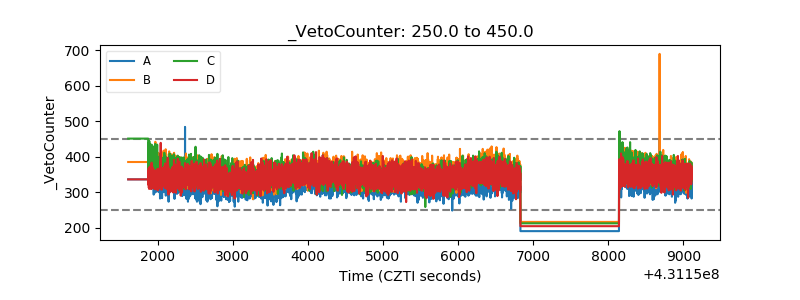 |