| Param | Original file | Final file |
|---|---|---|
| Filename | modeM0/AS1T05_138T01_9000005828_42845cztM0_level2.fits | modeM0/AS1T05_138T01_9000005828_42845cztM0_level2_quad_clean.evt |
| Size (bytes) | 1,173,119,040 | 252,210,240 |
| Size | 1.1 GB | 240.5 MB |
| Events in quadrant A | 8,920,980 | 1,684,855 |
| Events in quadrant B | 7,303,504 | 1,738,857 |
| Events in quadrant C | 10,123,561 | 1,732,288 |
| Events in quadrant D | 15,863,184 | 1,396,863 |
| Mode M0 | |||
|---|---|---|---|
| Quadrant | BADHDUFLAG | Total packets | Discarded packets |
| A | 0 | 35558 | 4 |
| B | 0 | 32649 | 4 |
| C | 0 | 39923 | 4 |
| D | 0 | 57855 | 4 |
| Mode M9 | |||
|---|---|---|---|
| Quadrant | BADHDUFLAG | Total packets | Discarded packets |
| A | 0 | 56 | 0 |
| B | 0 | 56 | 0 |
| C | 0 | 56 | 0 |
| D | 0 | 56 | 0 |
| Mode SS | |||
|---|---|---|---|
| Quadrant | BADHDUFLAG | Total packets | Discarded packets |
| A | 0 | 322 | 0 |
| B | 0 | 322 | 0 |
| C | 0 | 322 | 0 |
| D | 0 | 322 | 0 |
| Quadrant | Total seconds | Saturated seconds | Saturation percentage |
|---|---|---|---|
| A | 15696 | 109 | 0.694444% |
| B | 15696 | 61 | 0.388634% |
| C | 15697 | 347 | 2.210613% |
| D | 15697 | 2247 | 14.314837% |
Noise dominated data is calculated using 1-second bins in cleaned event files. If a bin has >2000 counts, and if more than 50% of those come from <1% of pixels, then it is considered to be noise-dominated and hence unusable.
| Quadrant | # 1 sec bins | Bins with >0 counts | Bins with >2000 counts | High rate bins dominated by noise | Noise dominated (total time) | Noise dominated (detector-on time) | Marked lightcurve |
|---|---|---|---|---|---|---|---|
| A | 21247 | 15700 | 74 | 74 | 0.35% | 0.47% | 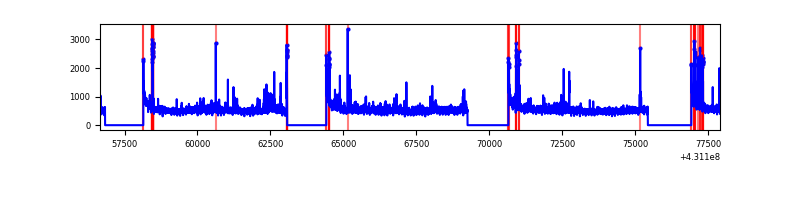 |
| B | 21247 | 15700 | 42 | 42 | 0.20% | 0.27% | 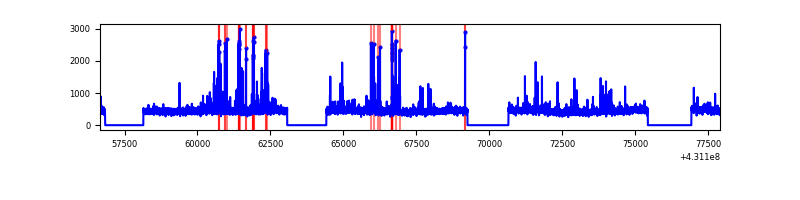 |
| C | 21248 | 15701 | 350 | 350 | 1.65% | 2.23% | 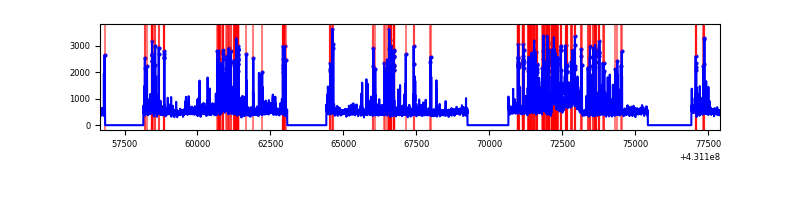 |
| D | 21248 | 15701 | 2057 | 2057 | 9.68% | 13.10% | 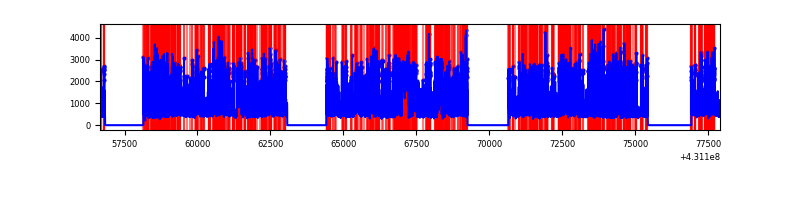 |
Top three noisy pixels from each quadrant. If the there are fewer than three noisy pixels in the level2.evt file, extra rows are filled as -1
| Pixel properties | Quadrant properties | ||||||
|---|---|---|---|---|---|---|---|
| Quadrant | DetID | PixID | Counts | Sigma | Mean | Median | Sigma |
| A | 10 | 83 | 1595629 | 4506.06 | 1721 | 1686 | 353.7 |
| A | 12 | 189 | 285226 | 801.57 | 1721 | 1686 | 353.7 |
| A | 15 | 237 | 233858 | 656.35 | 1721 | 1686 | 353.7 |
| B | 5 | 255 | 317101 | 951.85 | 1712 | 1665 | 331.4 |
| B | 0 | 245 | 101236 | 300.46 | 1712 | 1665 | 331.4 |
| B | 15 | 85 | 86887 | 257.16 | 1712 | 1665 | 331.4 |
| C | 14 | 254 | 1336366 | 3354.73 | 1689 | 1699 | 397.8 |
| C | 15 | 214 | 632327 | 1585.1 | 1689 | 1699 | 397.8 |
| C | 3 | 233 | 516784 | 1294.68 | 1689 | 1699 | 397.8 |
| D | 1 | 52 | 6121335 | 15816.57 | 1591 | 1548 | 386.9 |
| D | 2 | 249 | 857643 | 2212.57 | 1591 | 1548 | 386.9 |
| D | 10 | 118 | 734942 | 1895.45 | 1591 | 1548 | 386.9 |
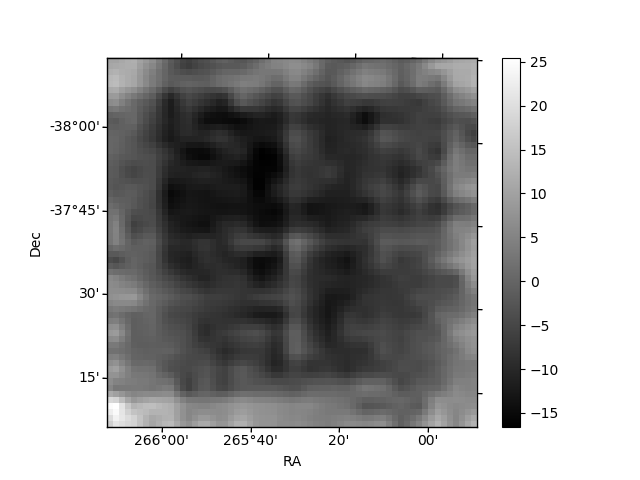
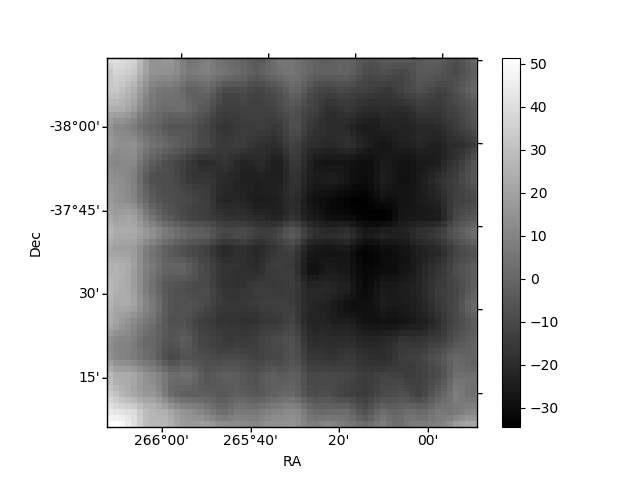
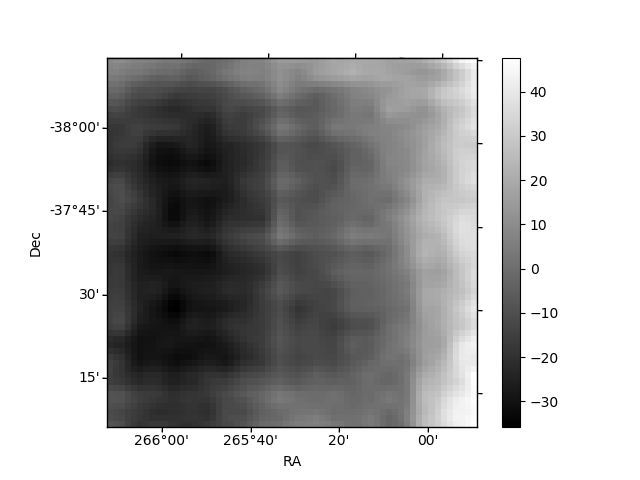
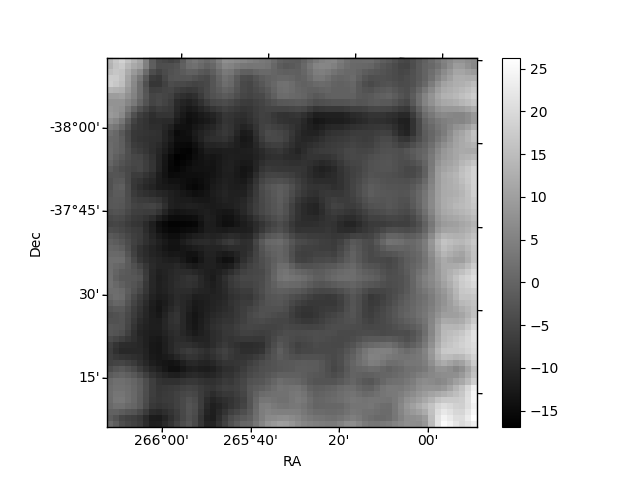
Histogram calculated using DETX and DETY for each event in the final _common_clean file
| Quadrant A | 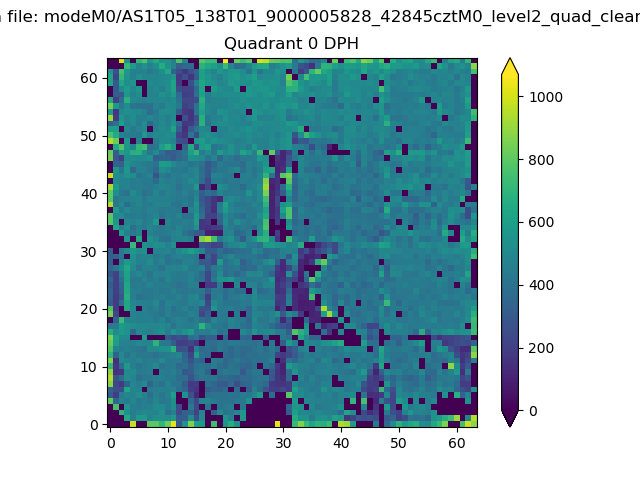 |
 |
Quadrant B |
|---|---|---|---|
| Quadrant D | 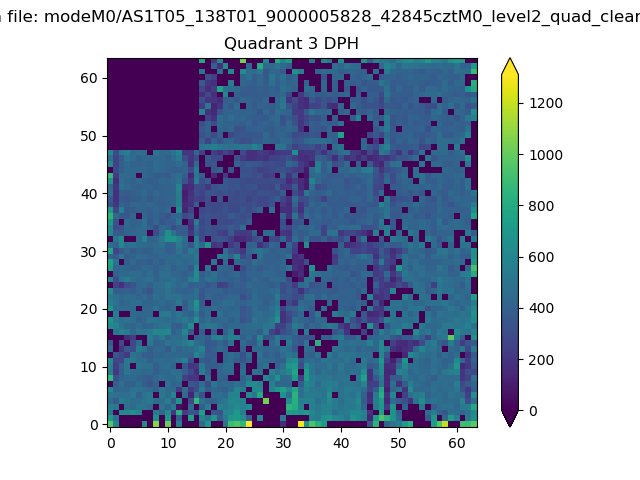 |
 |
Quadrant C |
| Plot type | Count rate plots | Images |
|---|---|---|
| Comparison with Poisson distribution Blue bars denote a histogram of data divided into 1 sec bins. Red curve is a Poisson curve with rate = median count rate of data. |
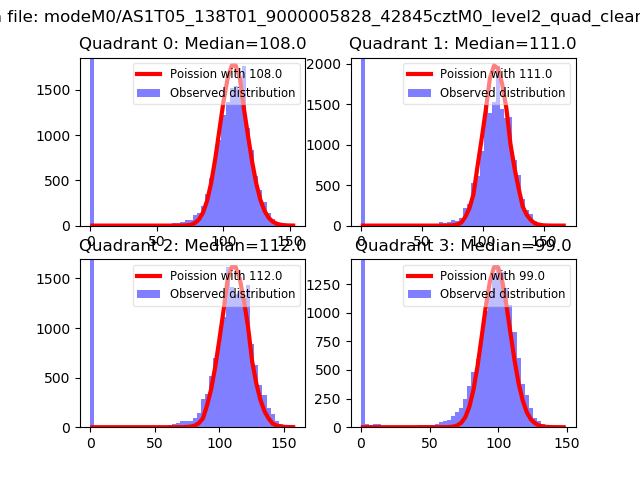 |
 |
| Quadrant-wise count rates Data is divided into 100 sec bins |
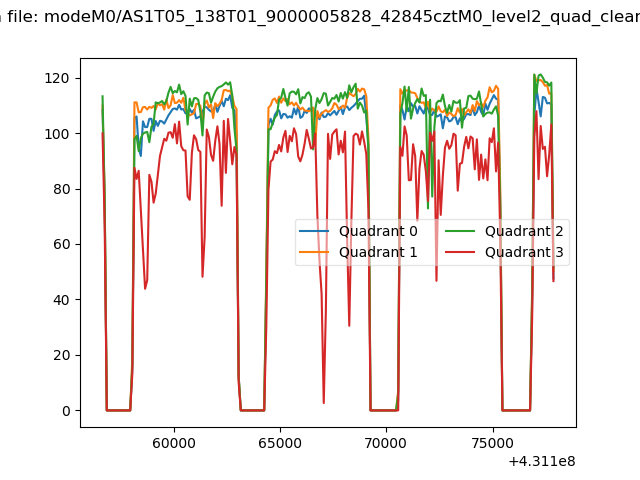 |
|
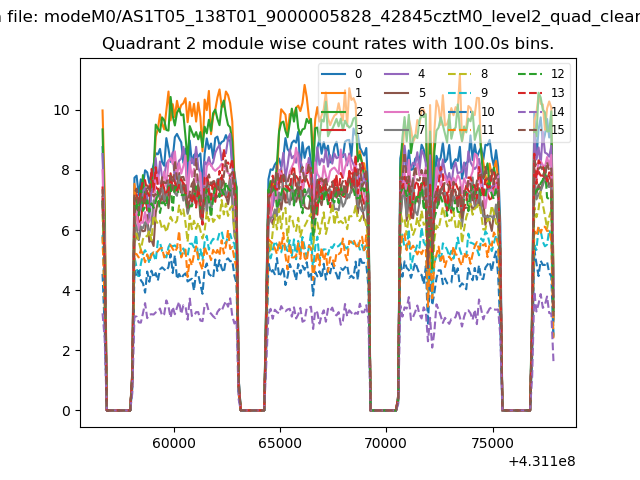
| Module-wise count rates for Quadrant A Data is divided into 100 sec bins |
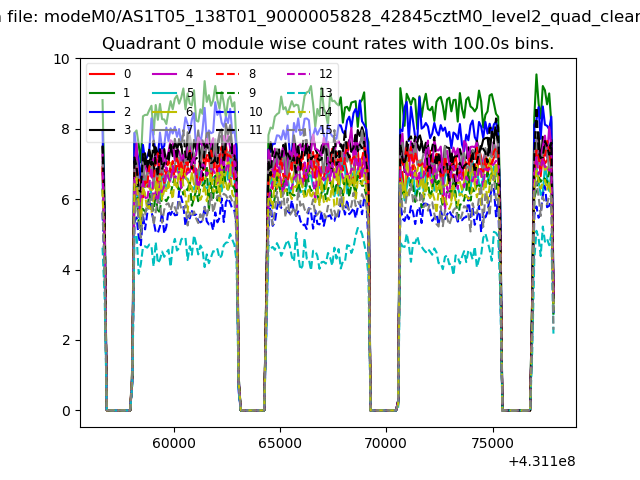 |
 |
| Module-wise count rates for Quadrant B Data is divided into 100 sec bins |
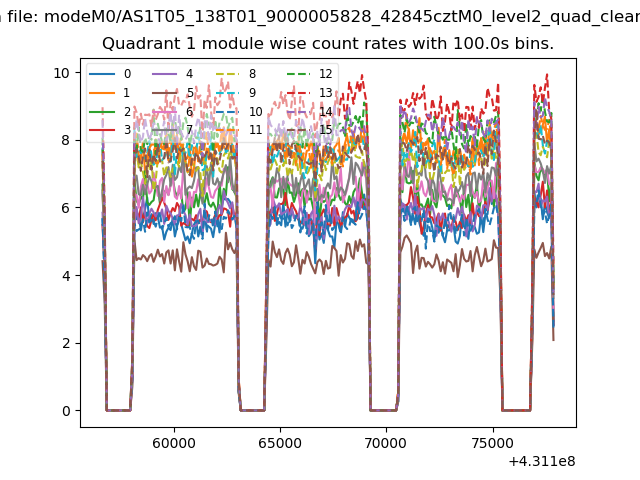 |
 |
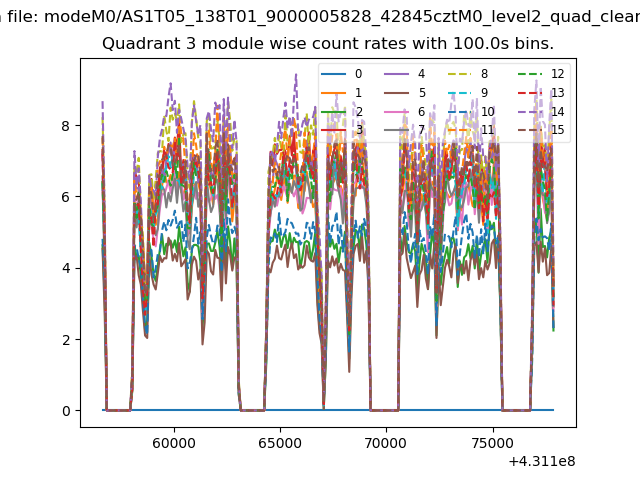
| Module-wise count rates for Quadrant C Data is divided into 100 sec bins |
 |
 |
| Module-wise count rates for Quadrant D Data is divided into 100 sec bins |
 |
 |
| Parameter | Plot |
|---|---|
| CZT HV Monitor | 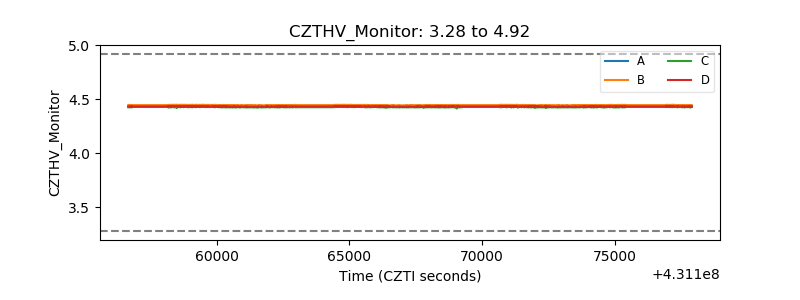 |
| D_VDD | 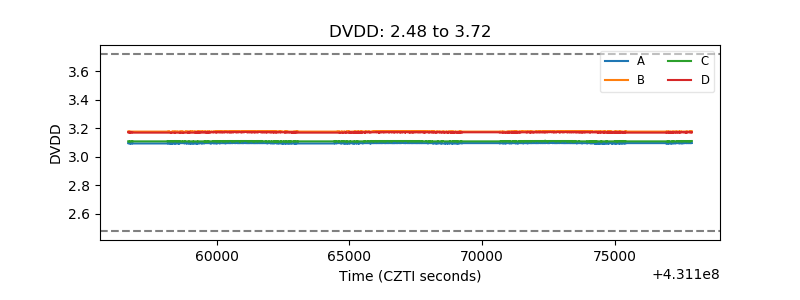 |
| Temperature 1 | 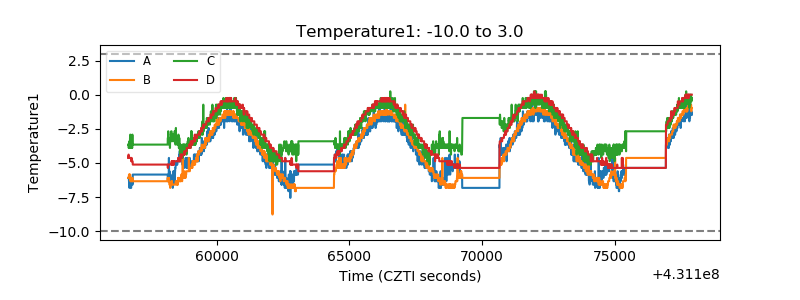 |
| Veto HV Monitor | 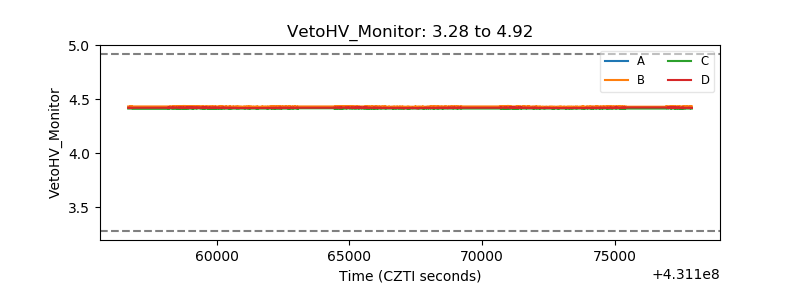 |
| Veto LLD | 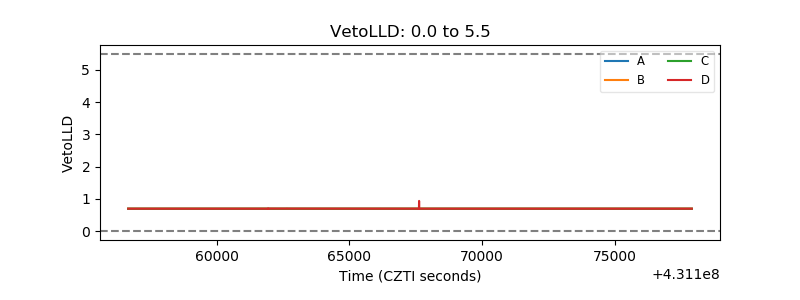 |
| Alpha Counter | 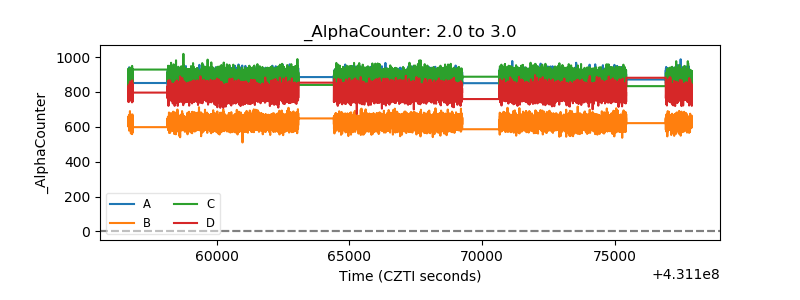 |
| _CPM_Rate | 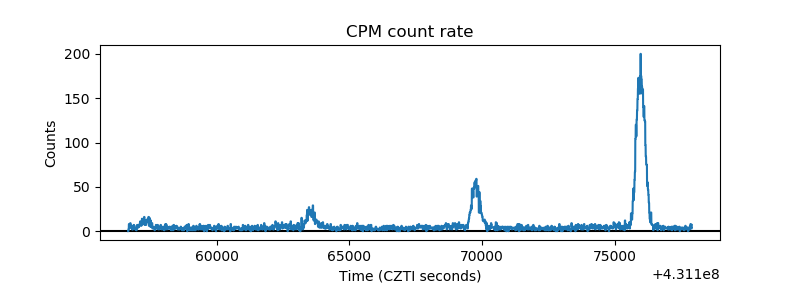 |
| CZT Counter | 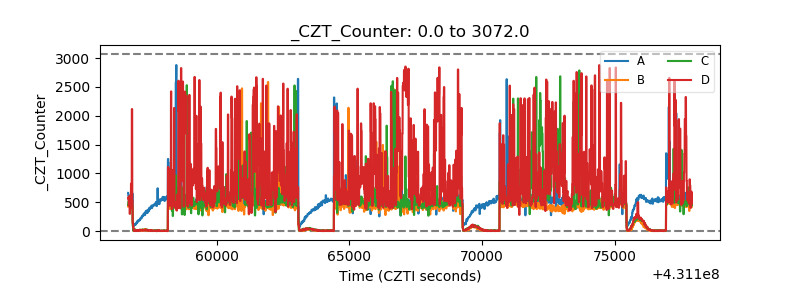 |
| +2.5 Volts monitor | 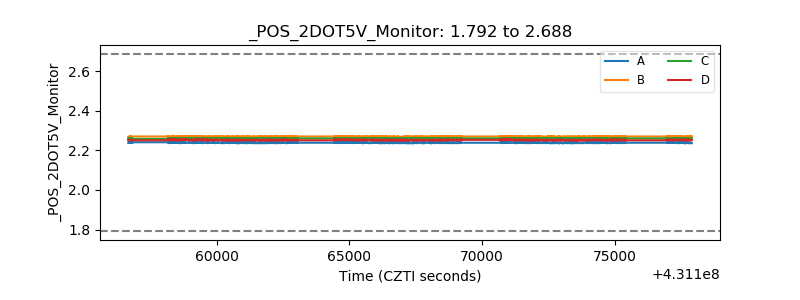 |
| +5 Volts monitor | 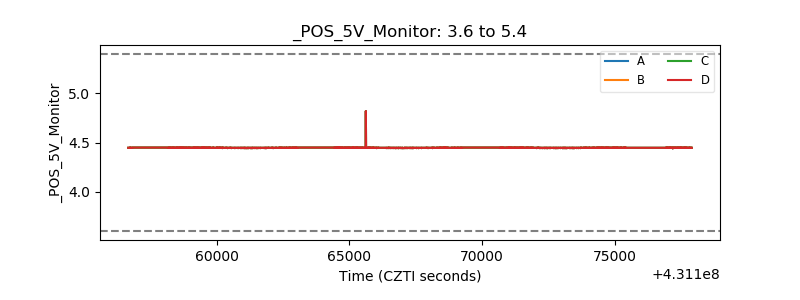 |
| _ROLL_ROT | 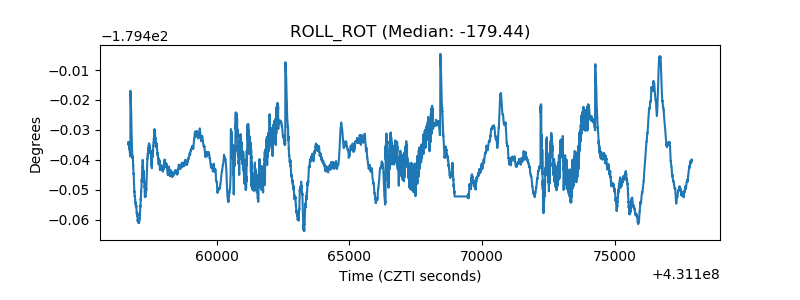 |
| _Roll_DEC | 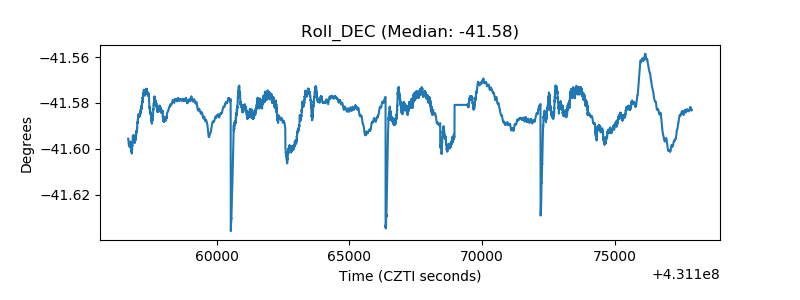 |
| _Roll_RA | 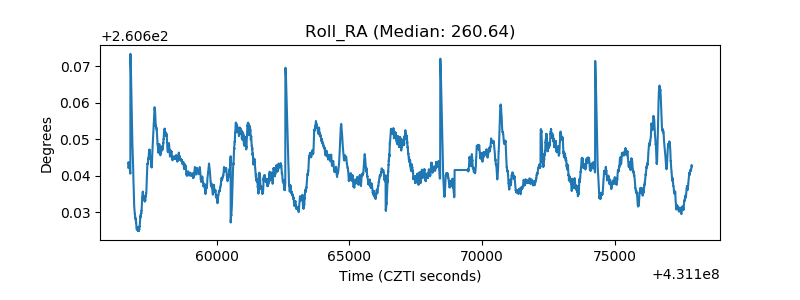 |
| Veto Counter | 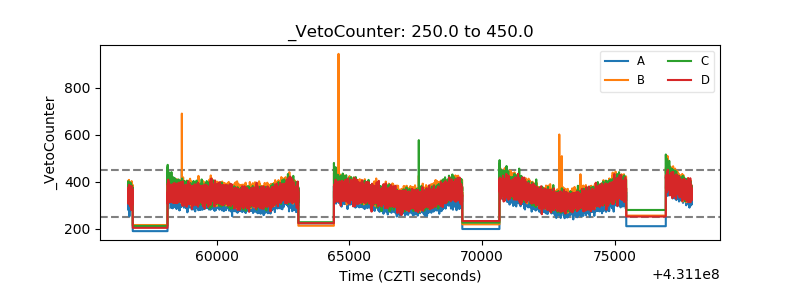 |