| Param | Original file | Final file |
|---|---|---|
| Filename | modeM0/AS1T05_138T01_9000005828_42846cztM0_level2.fits | modeM0/AS1T05_138T01_9000005828_42846cztM0_level2_quad_clean.evt |
| Size (bytes) | 442,664,640 | 92,021,760 |
| Size | 422.2 MB | 87.8 MB |
| Events in quadrant A | 3,310,237 | 628,620 |
| Events in quadrant B | 4,565,891 | 561,040 |
| Events in quadrant C | 3,115,534 | 648,585 |
| Events in quadrant D | 4,949,019 | 547,764 |
| Mode M0 | |||
|---|---|---|---|
| Quadrant | BADHDUFLAG | Total packets | Discarded packets |
| A | 0 | 13303 | 2 |
| B | 0 | 17583 | 2 |
| C | 0 | 12788 | 2 |
| D | 0 | 18609 | 2 |
| Mode M9 | |||
|---|---|---|---|
| Quadrant | BADHDUFLAG | Total packets | Discarded packets |
| A | 0 | 20 | 0 |
| B | 0 | 21 | 0 |
| C | 0 | 21 | 0 |
| D | 0 | 21 | 0 |
| Mode SS | |||
|---|---|---|---|
| Quadrant | BADHDUFLAG | Total packets | Discarded packets |
| A | 0 | 116 | 0 |
| B | 0 | 116 | 0 |
| C | 0 | 116 | 0 |
| D | 0 | 116 | 0 |
| Quadrant | Total seconds | Saturated seconds | Saturation percentage |
|---|---|---|---|
| A | 5725 | 38 | 0.663755% |
| B | 5725 | 798 | 13.938865% |
| C | 5725 | 59 | 1.030568% |
| D | 5725 | 558 | 9.746725% |
Noise dominated data is calculated using 1-second bins in cleaned event files. If a bin has >2000 counts, and if more than 50% of those come from <1% of pixels, then it is considered to be noise-dominated and hence unusable.
| Quadrant | # 1 sec bins | Bins with >0 counts | Bins with >2000 counts | High rate bins dominated by noise | Noise dominated (total time) | Noise dominated (detector-on time) | Marked lightcurve |
|---|---|---|---|---|---|---|---|
| A | 7369 | 5726 | 24 | 24 | 0.33% | 0.42% | 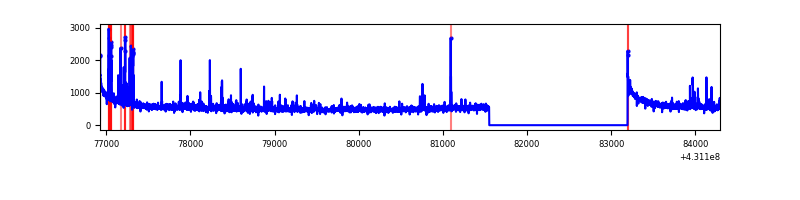 |
| B | 7368 | 5725 | 731 | 731 | 9.92% | 12.77% | 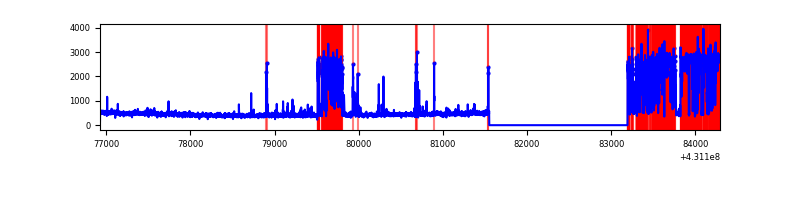 |
| C | 7369 | 5726 | 53 | 53 | 0.72% | 0.93% | 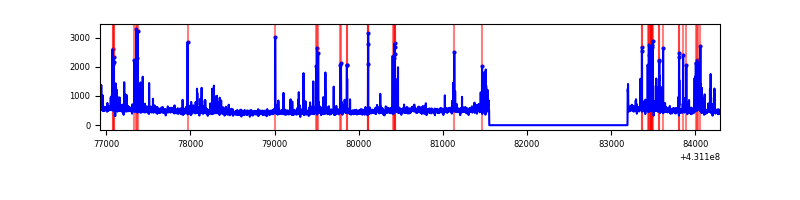 |
| D | 7369 | 5726 | 499 | 499 | 6.77% | 8.71% | 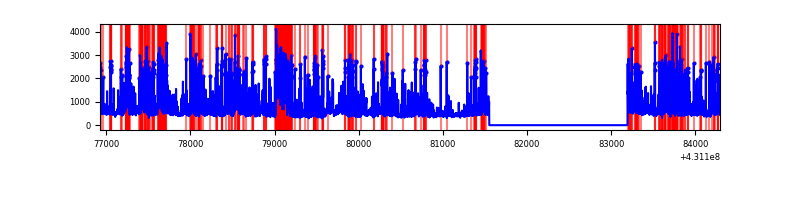 |
Top three noisy pixels from each quadrant. If the there are fewer than three noisy pixels in the level2.evt file, extra rows are filled as -1
| Pixel properties | Quadrant properties | ||||||
|---|---|---|---|---|---|---|---|
| Quadrant | DetID | PixID | Counts | Sigma | Mean | Median | Sigma |
| A | 10 | 83 | 643312 | 4877.75 | 633 | 618 | 131.8 |
| A | 13 | 248 | 79497 | 598.66 | 633 | 618 | 131.8 |
| A | 15 | 237 | 59101 | 443.86 | 633 | 618 | 131.8 |
| B | 4 | 81 | 1702810 | 14895.54 | 584 | 568 | 114.3 |
| B | 5 | 255 | 508878 | 4447.99 | 584 | 568 | 114.3 |
| B | 0 | 245 | 33009 | 283.88 | 584 | 568 | 114.3 |
| C | 14 | 254 | 317123 | 2143.48 | 620 | 625 | 147.7 |
| C | 15 | 214 | 235018 | 1587.42 | 620 | 625 | 147.7 |
| C | 0 | 207 | 98588 | 663.45 | 620 | 625 | 147.7 |
| D | 1 | 52 | 1301428 | 8883.74 | 598 | 583 | 146.4 |
| D | 10 | 118 | 433570 | 2956.96 | 598 | 583 | 146.4 |
| D | 2 | 249 | 415289 | 2832.11 | 598 | 583 | 146.4 |
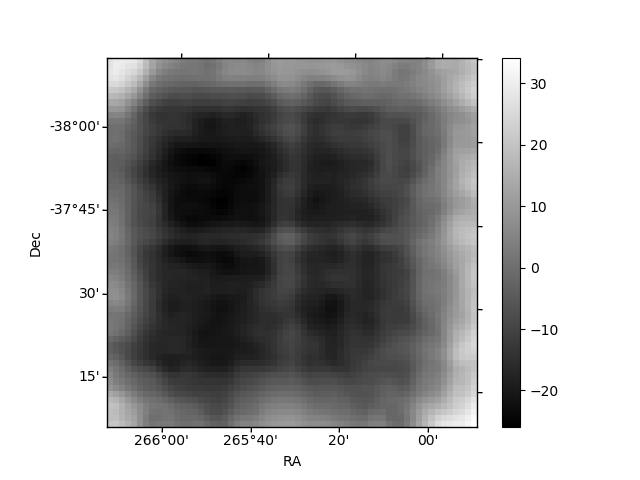
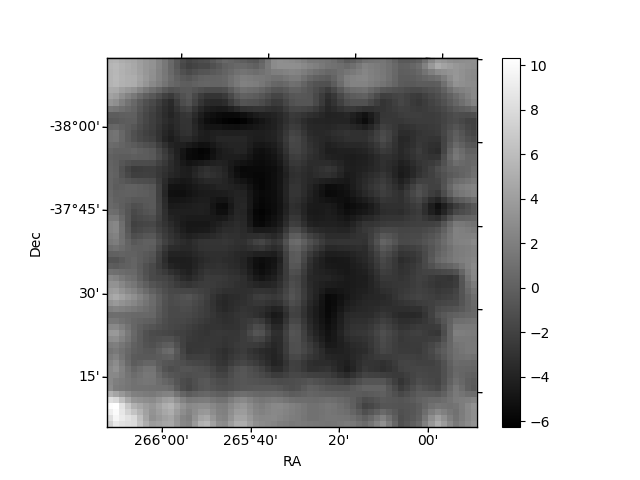
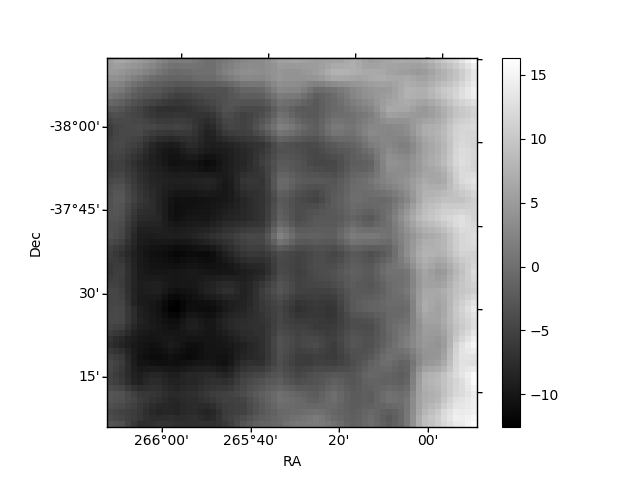
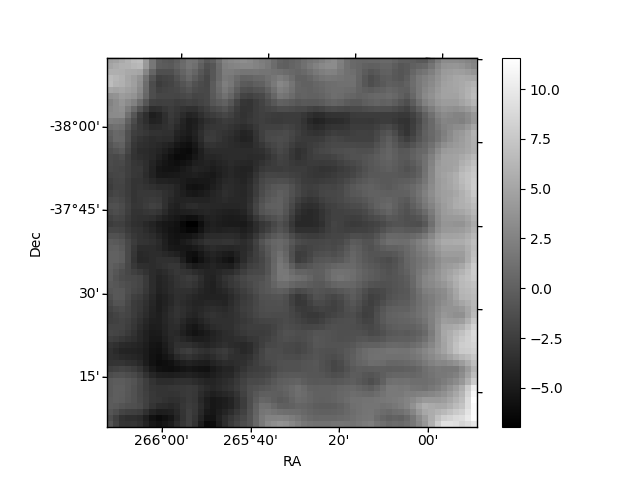
Histogram calculated using DETX and DETY for each event in the final _common_clean file
| Quadrant A | 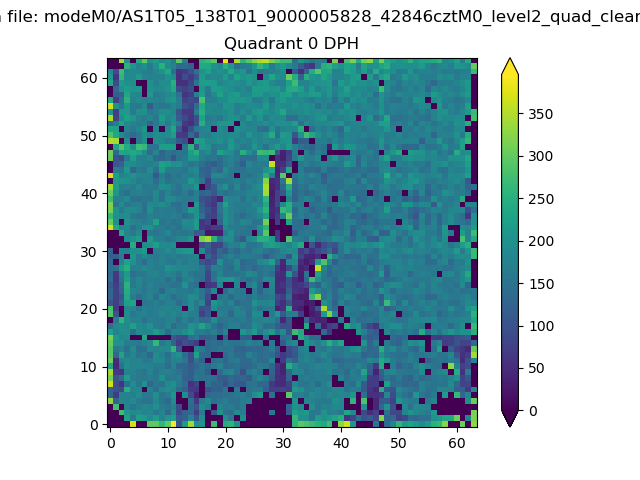 |
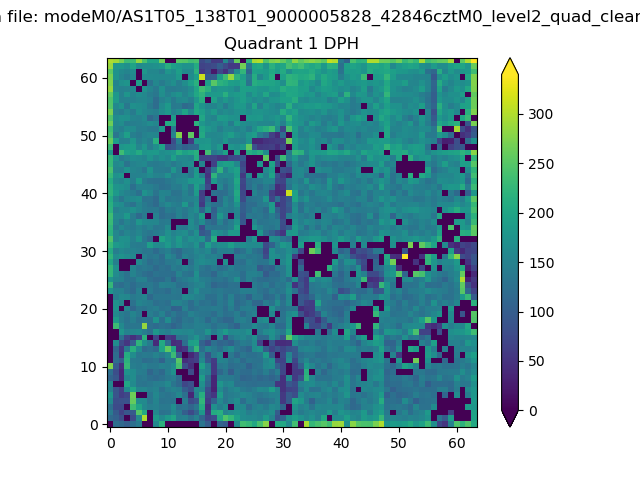 |
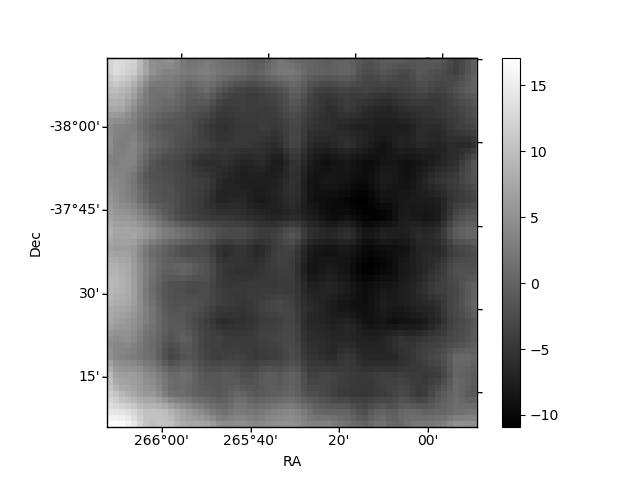
Quadrant B |
|---|---|---|---|
| Quadrant D | 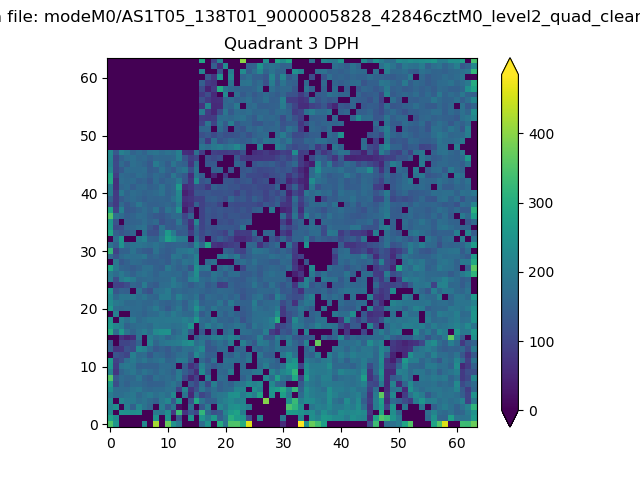 |
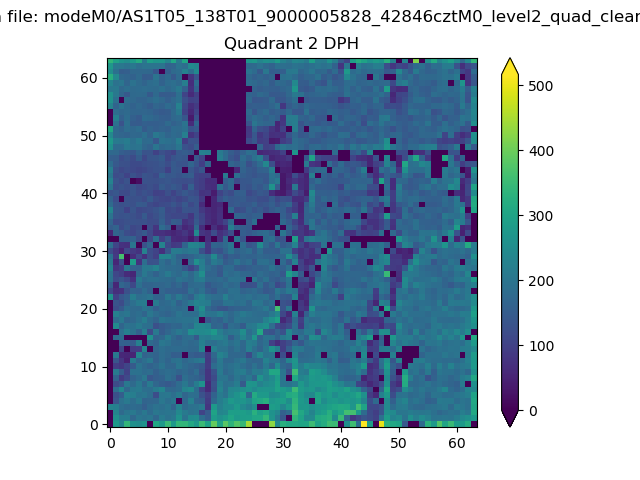 |
Quadrant C |
| Plot type | Count rate plots | Images |
|---|---|---|
| Comparison with Poisson distribution Blue bars denote a histogram of data divided into 1 sec bins. Red curve is a Poisson curve with rate = median count rate of data. |
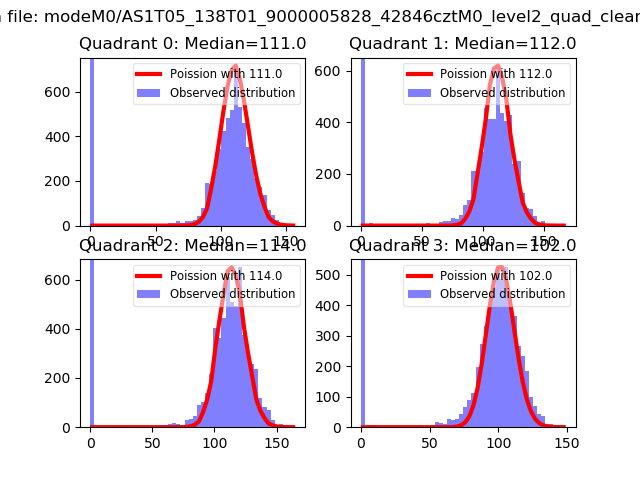 |
 |
| Quadrant-wise count rates Data is divided into 100 sec bins |
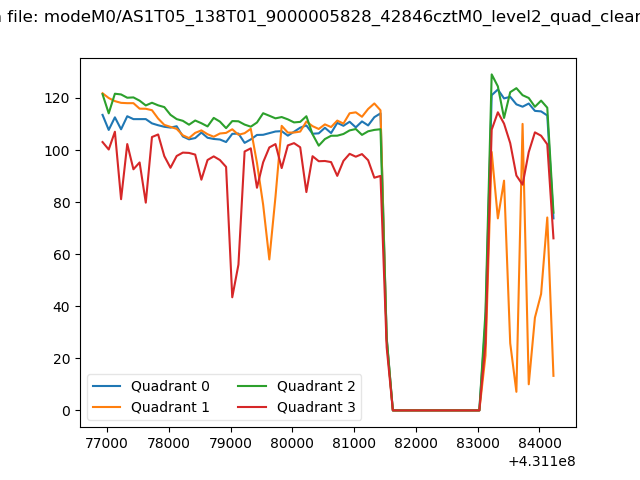 |
|
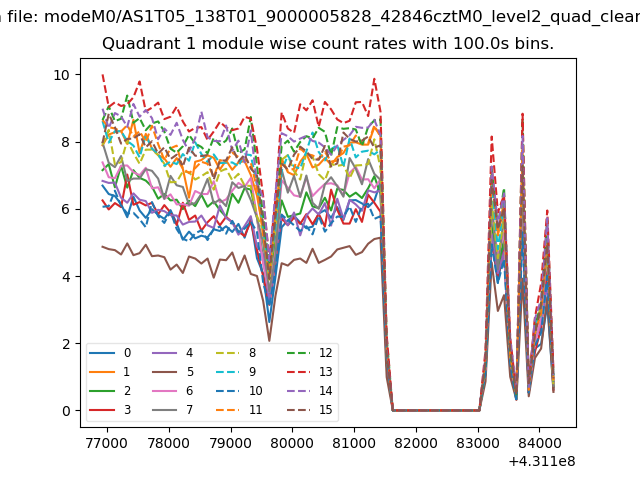
| Module-wise count rates for Quadrant A Data is divided into 100 sec bins |
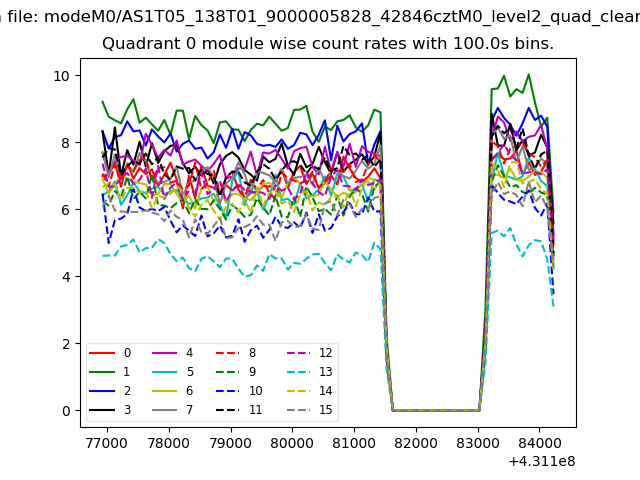 |
 |
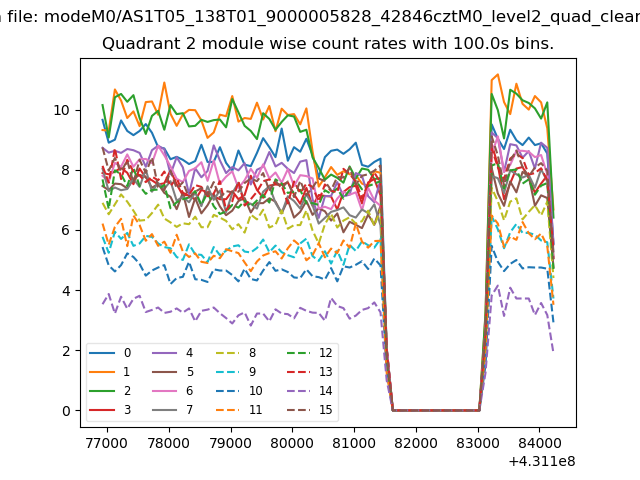
| Module-wise count rates for Quadrant B Data is divided into 100 sec bins |
 |
 |
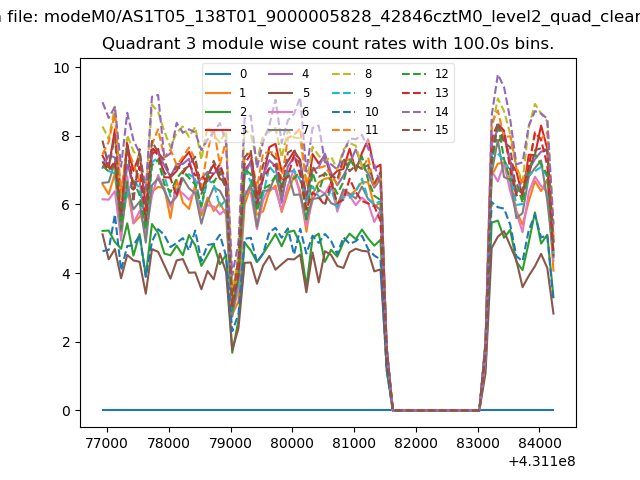
| Module-wise count rates for Quadrant C Data is divided into 100 sec bins |
 |
 |
| Module-wise count rates for Quadrant D Data is divided into 100 sec bins |
 |
 |
| Parameter | Plot |
|---|---|
| CZT HV Monitor |  |
| D_VDD | 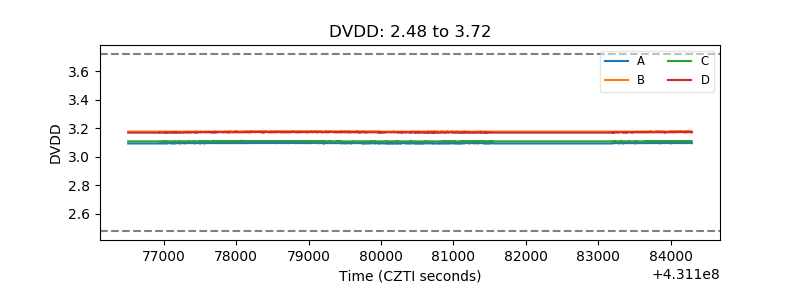 |
| Temperature 1 | 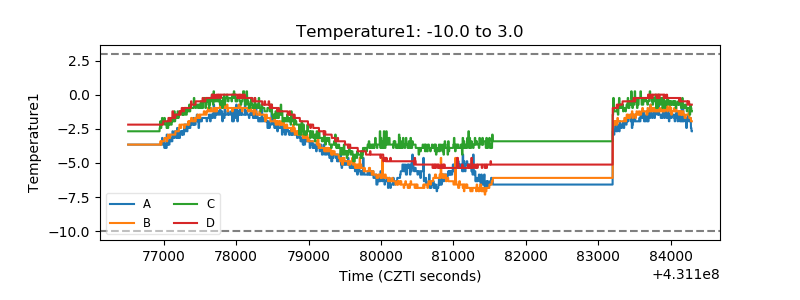 |
| Veto HV Monitor | 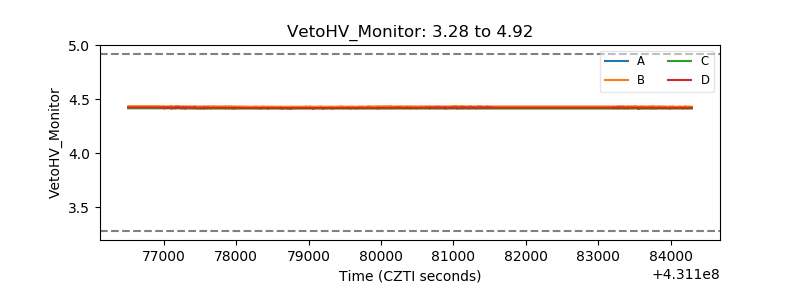 |
| Veto LLD | 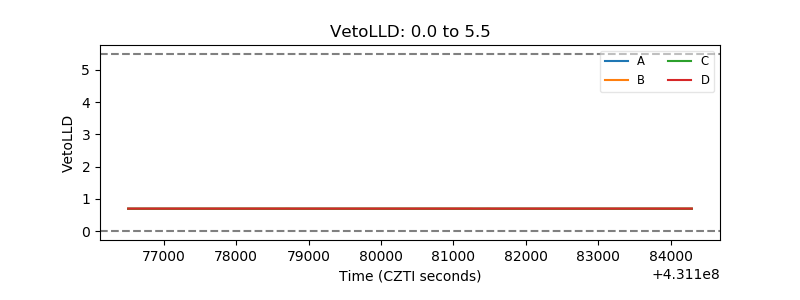 |
| Alpha Counter | 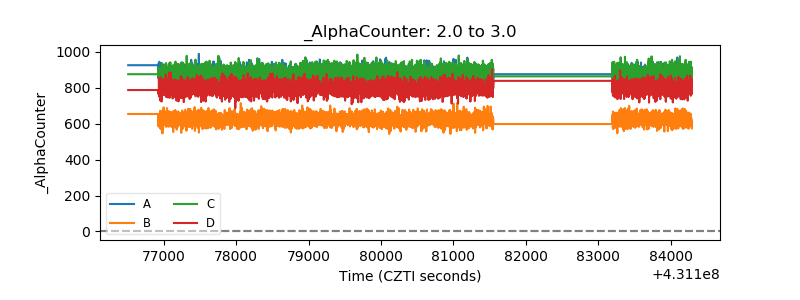 |
| _CPM_Rate | 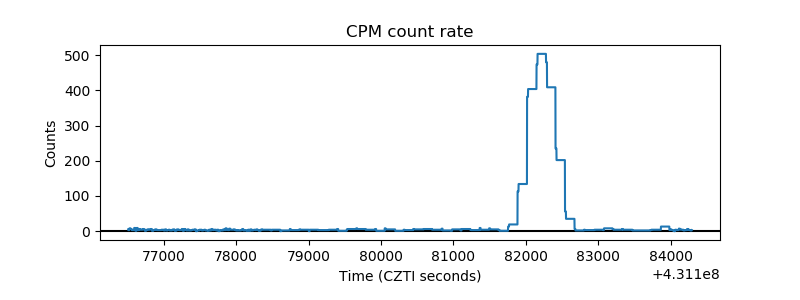 |
| CZT Counter | 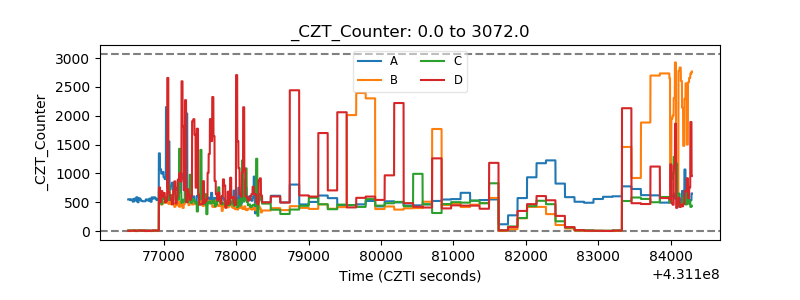 |
| +2.5 Volts monitor | 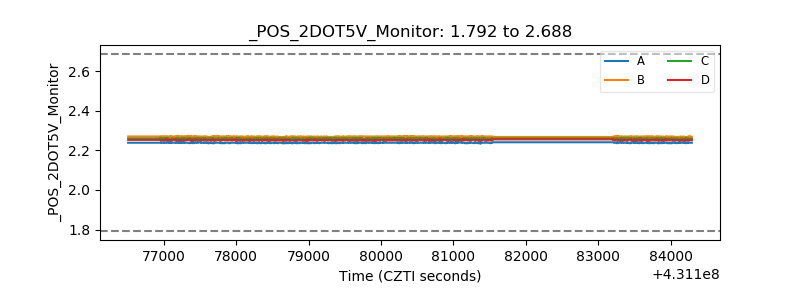 |
| +5 Volts monitor | 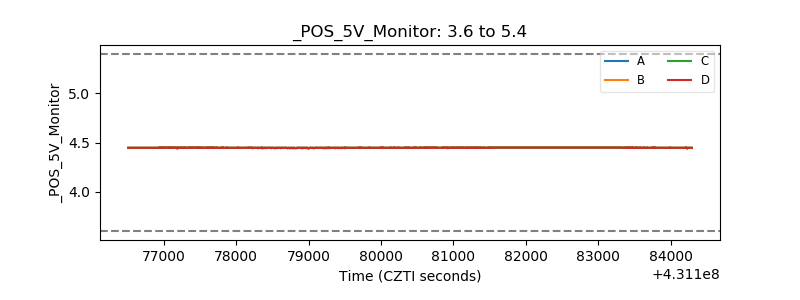 |
| _ROLL_ROT |  |
| _Roll_DEC | 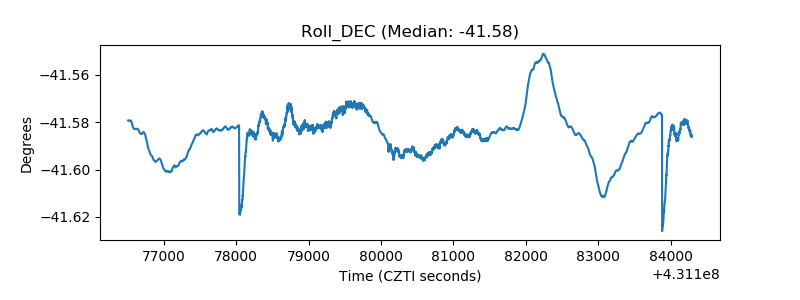 |
| _Roll_RA | 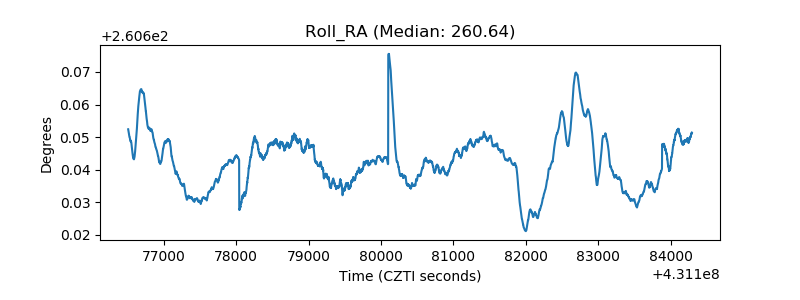 |
| Veto Counter | 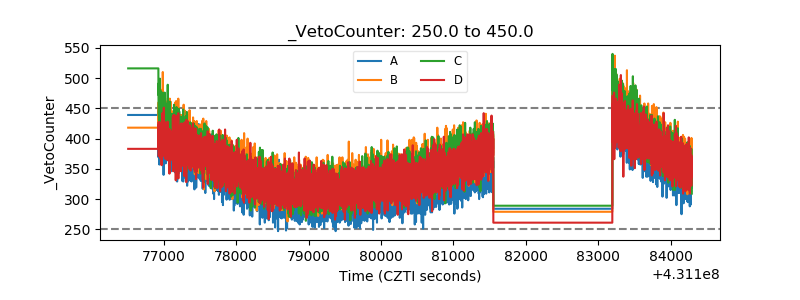 |