| Param | Original file | Final file |
|---|---|---|
| Filename | modeM0/AS1T05_138T01_9000005828_42848cztM0_level2.fits | modeM0/AS1T05_138T01_9000005828_42848cztM0_level2_quad_clean.evt |
| Size (bytes) | 470,344,320 | 87,094,080 |
| Size | 448.6 MB | 83.1 MB |
| Events in quadrant A | 3,075,925 | 616,836 |
| Events in quadrant B | 5,967,443 | 493,879 |
| Events in quadrant C | 3,032,401 | 620,687 |
| Events in quadrant D | 4,912,281 | 524,724 |
| Mode M0 | |||
|---|---|---|---|
| Quadrant | BADHDUFLAG | Total packets | Discarded packets |
| A | 0 | 12543 | 2 |
| B | 0 | 21435 | 2 |
| C | 0 | 12461 | 2 |
| D | 0 | 18429 | 2 |
| Mode M9 | |||
|---|---|---|---|
| Quadrant | BADHDUFLAG | Total packets | Discarded packets |
| A | 0 | 18 | 0 |
| B | 0 | 19 | 0 |
| C | 0 | 19 | 0 |
| D | 0 | 19 | 0 |
| Mode SS | |||
|---|---|---|---|
| Quadrant | BADHDUFLAG | Total packets | Discarded packets |
| A | 0 | 112 | 0 |
| B | 0 | 112 | 0 |
| C | 0 | 112 | 0 |
| D | 0 | 112 | 0 |
| Quadrant | Total seconds | Saturated seconds | Saturation percentage |
|---|---|---|---|
| A | 5438 | 29 | 0.533284% |
| B | 5438 | 1281 | 23.556455% |
| C | 5438 | 71 | 1.305627% |
| D | 5438 | 576 | 10.592129% |
Noise dominated data is calculated using 1-second bins in cleaned event files. If a bin has >2000 counts, and if more than 50% of those come from <1% of pixels, then it is considered to be noise-dominated and hence unusable.
| Quadrant | # 1 sec bins | Bins with >0 counts | Bins with >2000 counts | High rate bins dominated by noise | Noise dominated (total time) | Noise dominated (detector-on time) | Marked lightcurve |
|---|---|---|---|---|---|---|---|
| A | 7230 | 5439 | 13 | 13 | 0.18% | 0.24% | 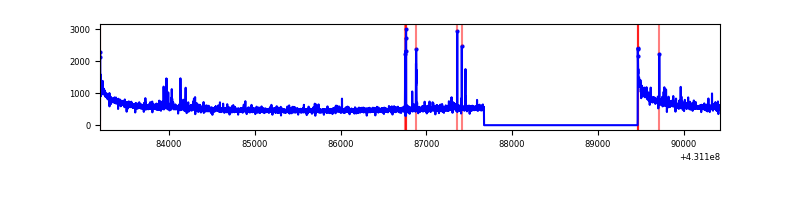 |
| B | 7229 | 5438 | 1204 | 1204 | 16.66% | 22.14% | 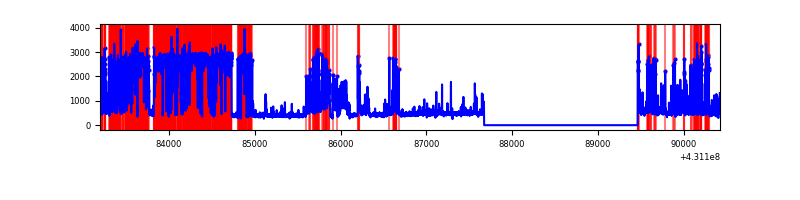 |
| C | 7230 | 5439 | 79 | 79 | 1.09% | 1.45% | 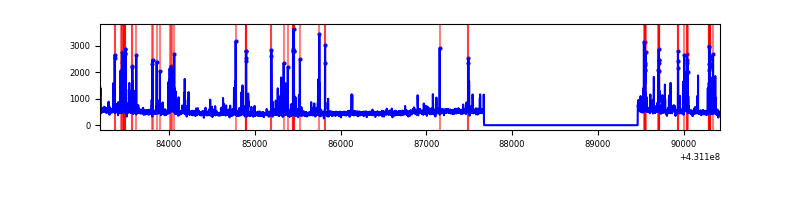 |
| D | 7230 | 5439 | 560 | 560 | 7.75% | 10.30% | 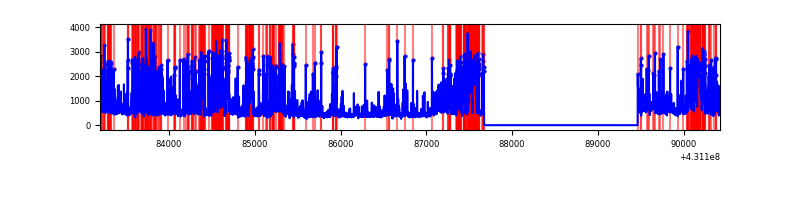 |
Top three noisy pixels from each quadrant. If the there are fewer than three noisy pixels in the level2.evt file, extra rows are filled as -1
| Pixel properties | Quadrant properties | ||||||
|---|---|---|---|---|---|---|---|
| Quadrant | DetID | PixID | Counts | Sigma | Mean | Median | Sigma |
| A | 10 | 83 | 625387 | 5033.93 | 601 | 590 | 124.1 |
| A | 13 | 248 | 43021 | 341.86 | 601 | 590 | 124.1 |
| A | 15 | 237 | 41330 | 328.24 | 601 | 590 | 124.1 |
| B | 4 | 81 | 3663047 | 35514.62 | 523 | 507 | 103.1 |
| B | 4 | 171 | 122768 | 1185.53 | 523 | 507 | 103.1 |
| B | 5 | 255 | 79681 | 767.73 | 523 | 507 | 103.1 |
| C | 14 | 254 | 468515 | 3403.74 | 585 | 589 | 137.5 |
| C | 15 | 214 | 221744 | 1608.7 | 585 | 589 | 137.5 |
| C | 0 | 207 | 20551 | 145.2 | 585 | 589 | 137.5 |
| D | 1 | 52 | 1181024 | 8609.43 | 561 | 547 | 137.1 |
| D | 10 | 118 | 557653 | 4063.07 | 561 | 547 | 137.1 |
| D | 2 | 249 | 288676 | 2101.38 | 561 | 547 | 137.1 |
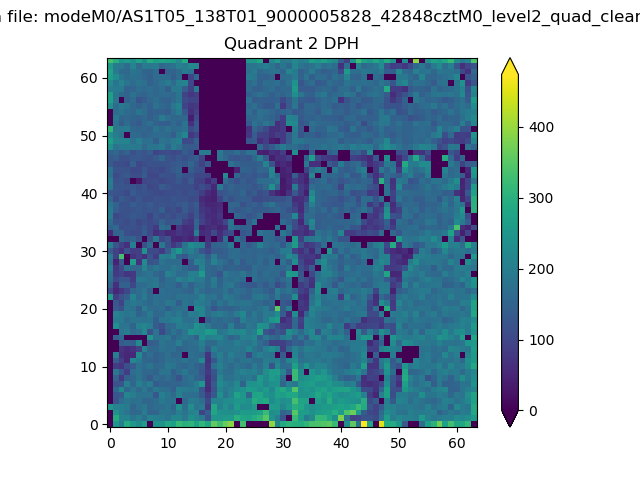
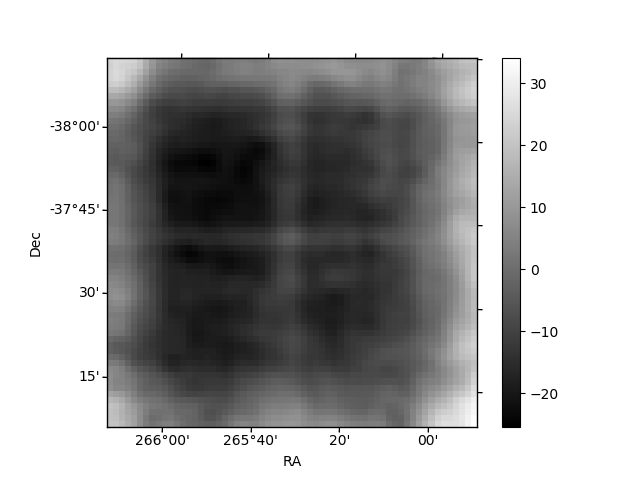
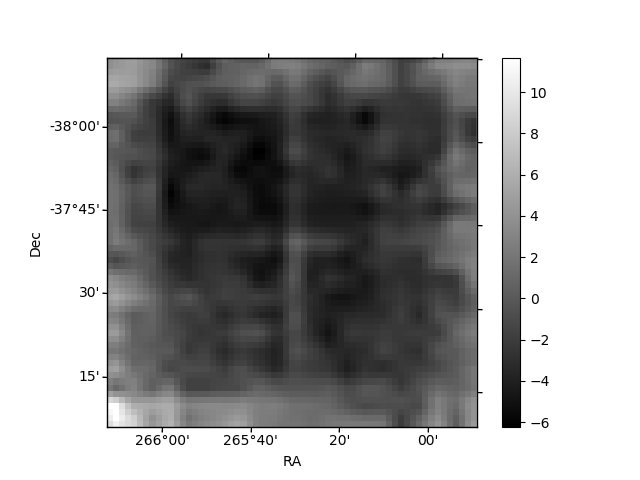
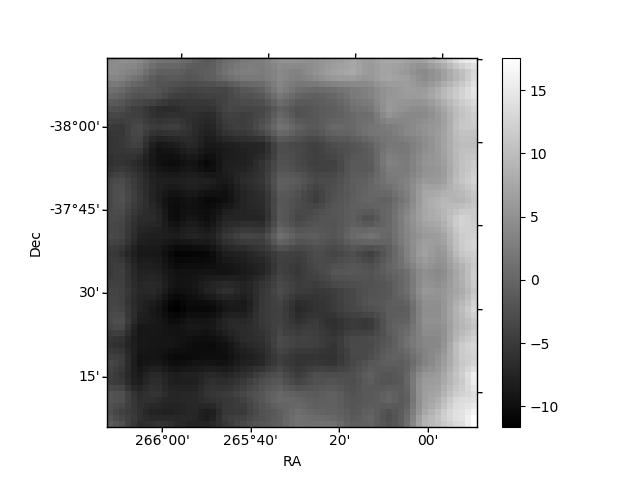
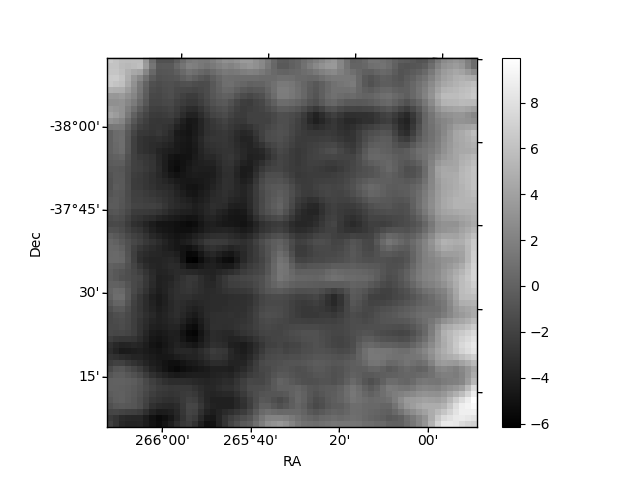
Histogram calculated using DETX and DETY for each event in the final _common_clean file
| Quadrant A | 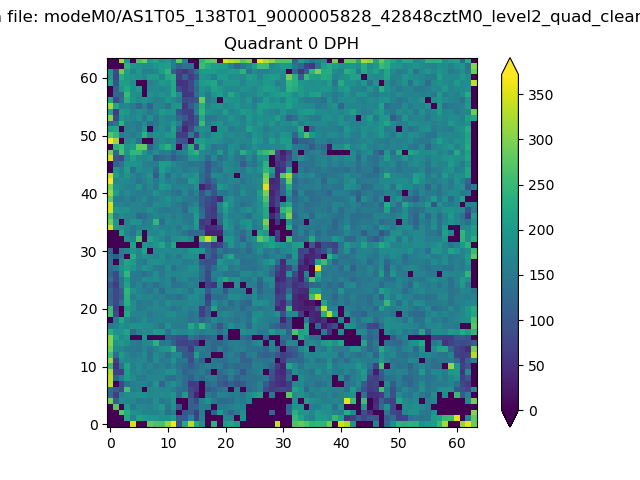 |
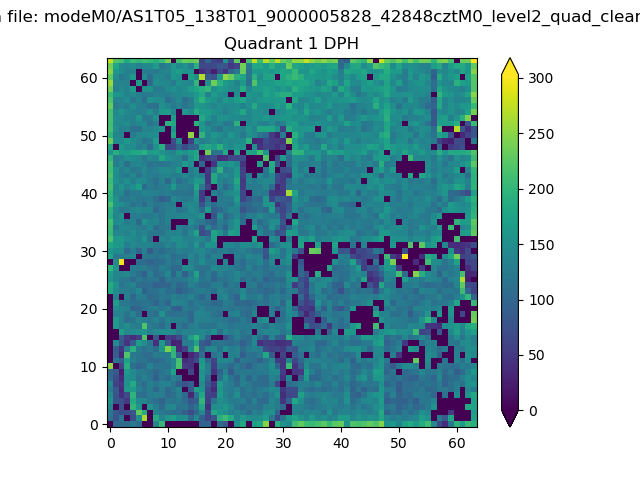 |
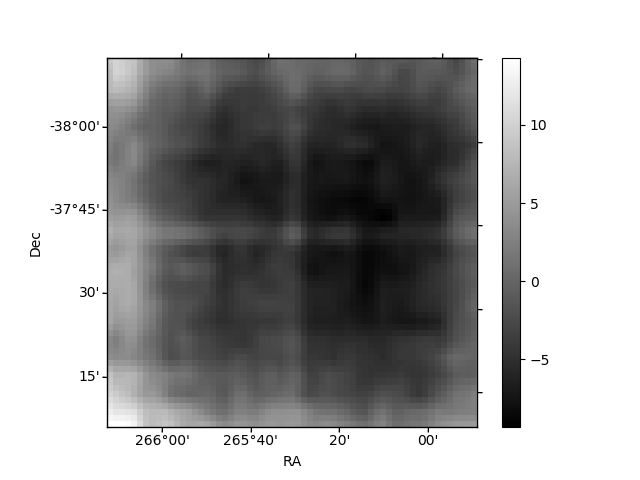
Quadrant B |
|---|---|---|---|
| Quadrant D | 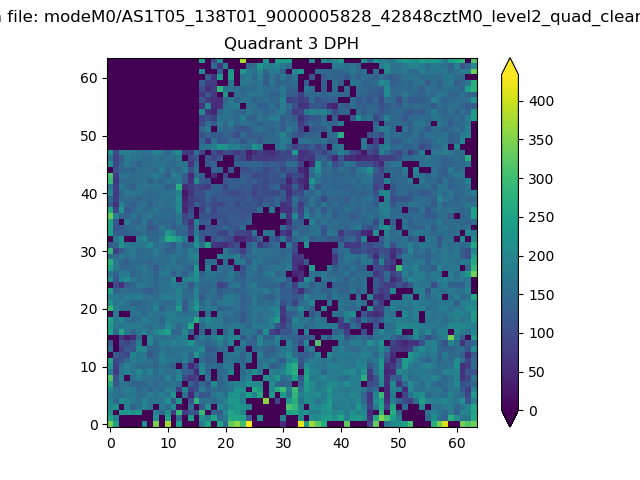 |
 |
Quadrant C |
| Plot type | Count rate plots | Images |
|---|---|---|
| Comparison with Poisson distribution Blue bars denote a histogram of data divided into 1 sec bins. Red curve is a Poisson curve with rate = median count rate of data. |
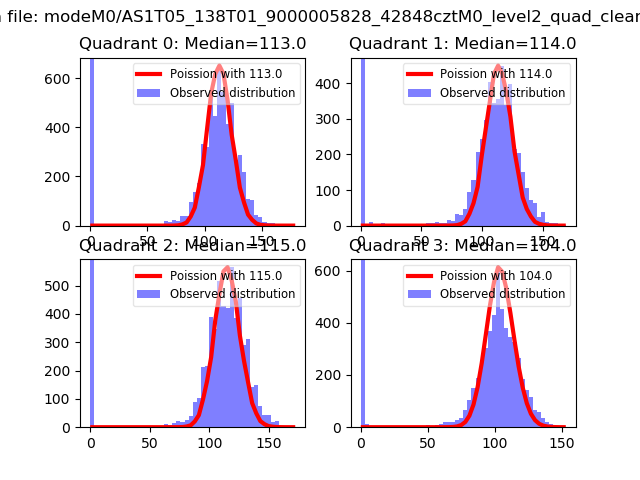 |
 |
| Quadrant-wise count rates Data is divided into 100 sec bins |
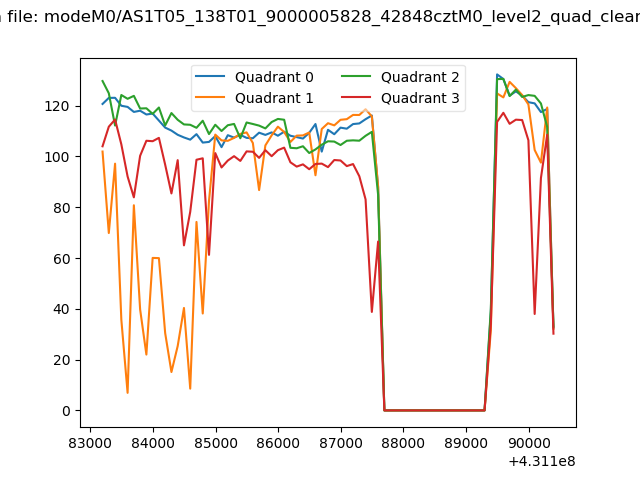 |
|
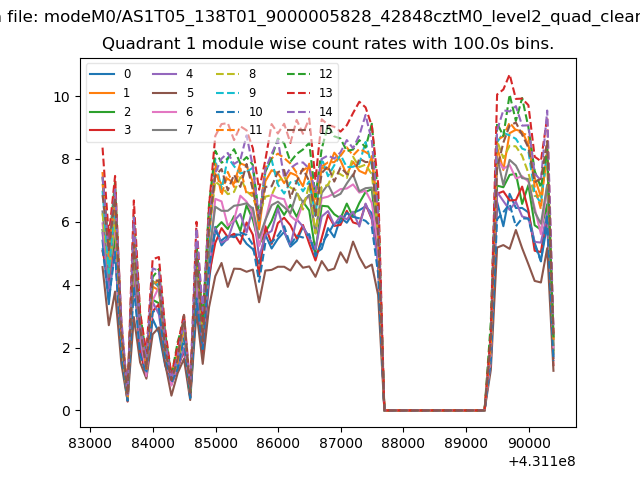
| Module-wise count rates for Quadrant A Data is divided into 100 sec bins |
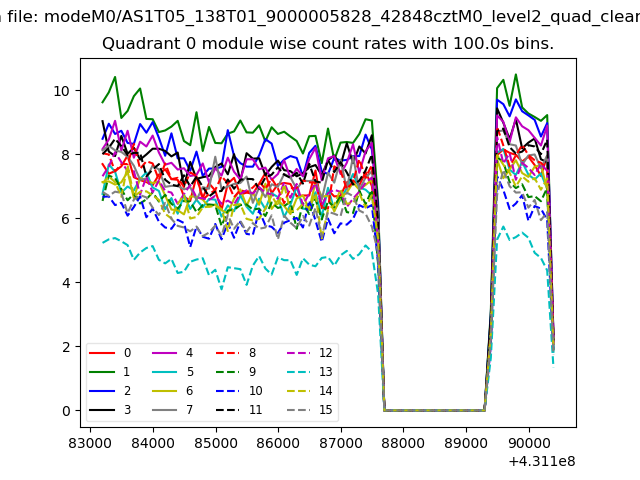 |
 |
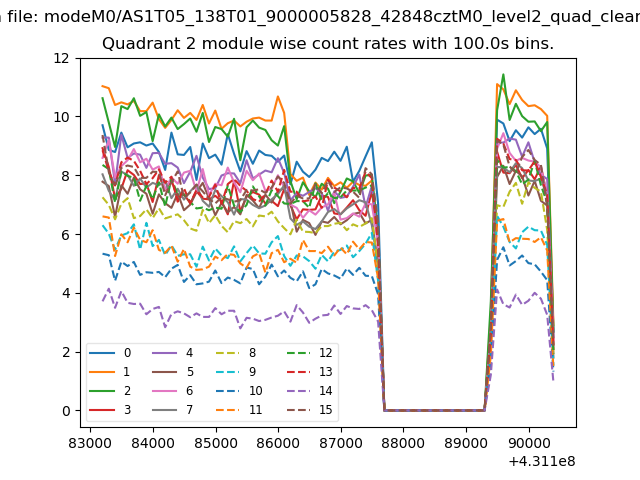
| Module-wise count rates for Quadrant B Data is divided into 100 sec bins |
 |
 |
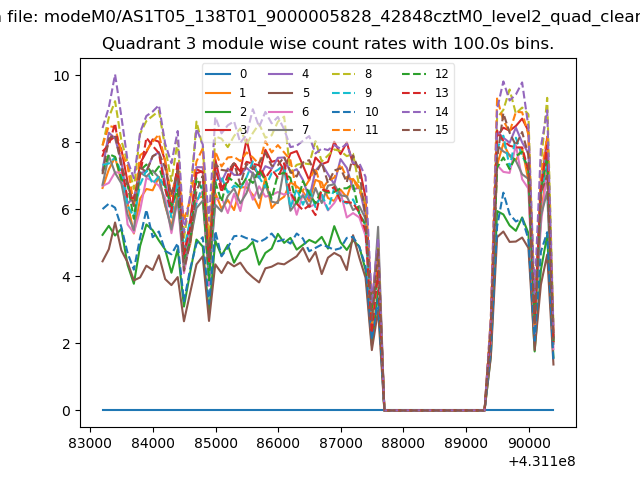
| Module-wise count rates for Quadrant C Data is divided into 100 sec bins |
 |
 |
| Module-wise count rates for Quadrant D Data is divided into 100 sec bins |
 |
 |
| Parameter | Plot |
|---|---|
| CZT HV Monitor | 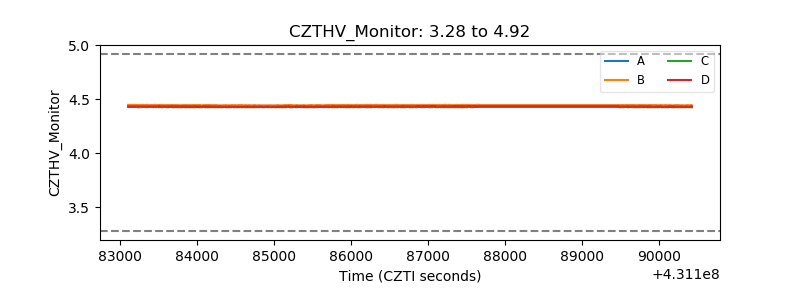 |
| D_VDD | 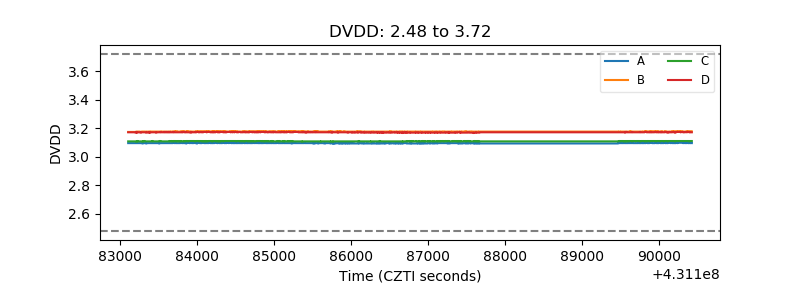 |
| Temperature 1 | 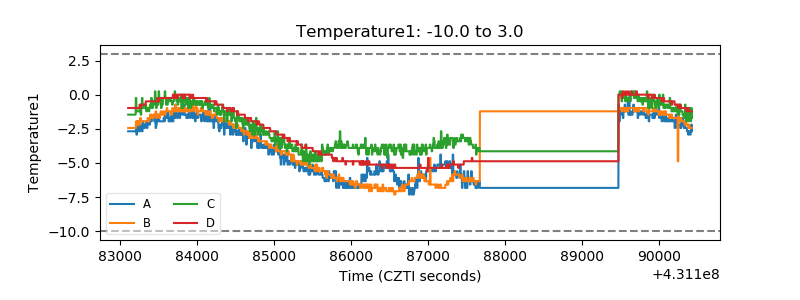 |
| Veto HV Monitor |  |
| Veto LLD | 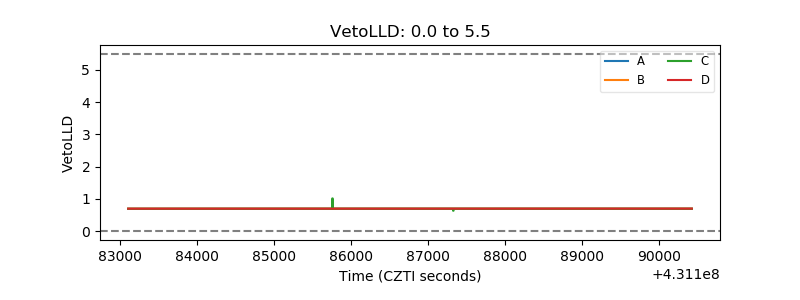 |
| Alpha Counter | 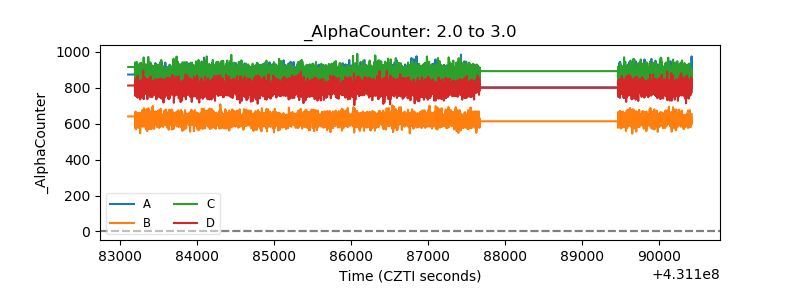 |
| _CPM_Rate | 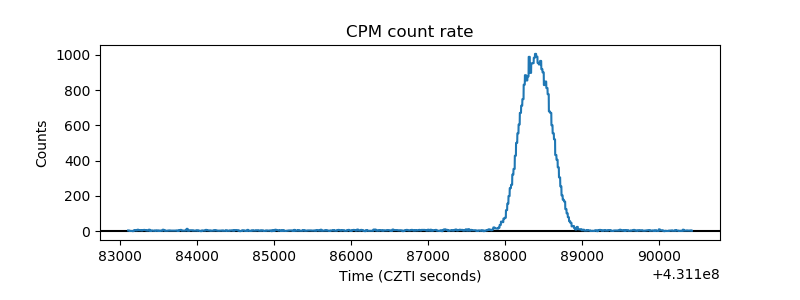 |
| CZT Counter | 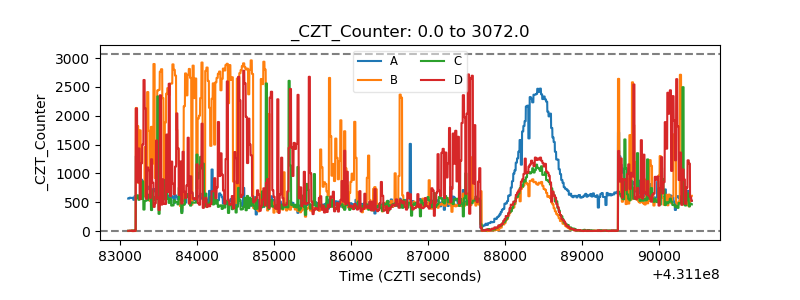 |
| +2.5 Volts monitor | 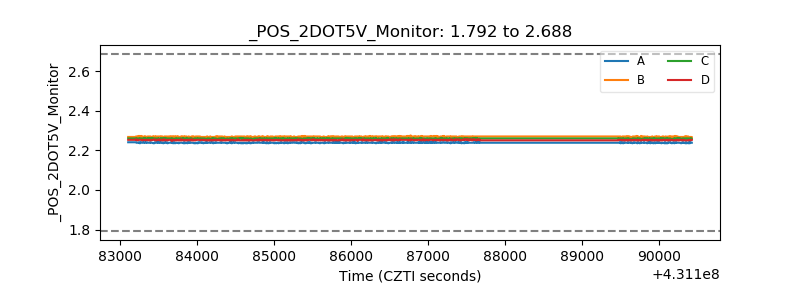 |
| +5 Volts monitor | 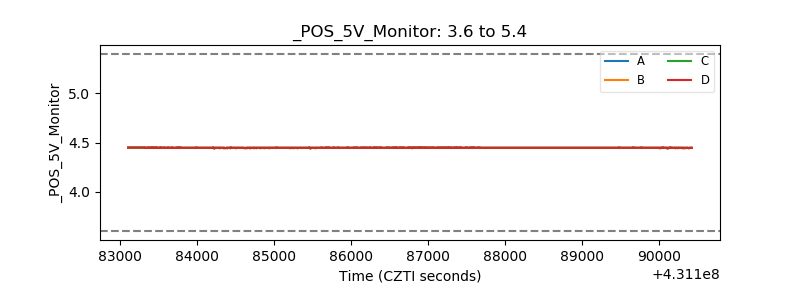 |
| _ROLL_ROT | 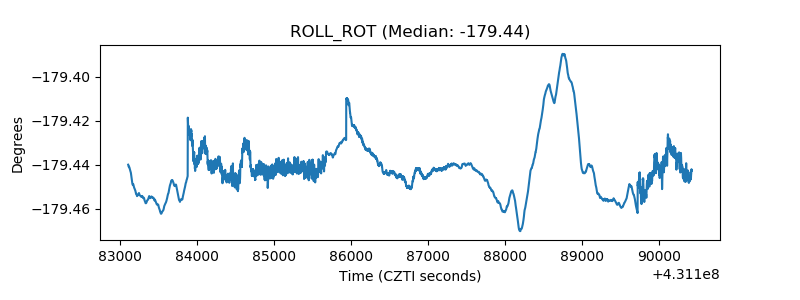 |
| _Roll_DEC | 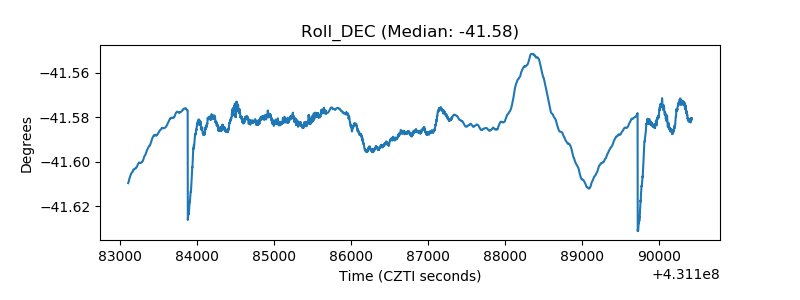 |
| _Roll_RA | 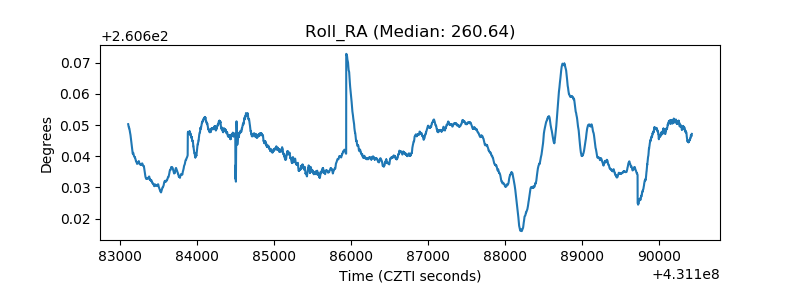 |
| Veto Counter |  |