| Param | Original file | Final file |
|---|---|---|
| Filename | modeM0/AS1T05_138T01_9000005828_42849cztM0_level2.fits | modeM0/AS1T05_138T01_9000005828_42849cztM0_level2_quad_clean.evt |
| Size (bytes) | 493,410,240 | 83,583,360 |
| Size | 470.6 MB | 79.7 MB |
| Events in quadrant A | 3,173,012 | 615,631 |
| Events in quadrant B | 7,063,433 | 419,240 |
| Events in quadrant C | 3,159,113 | 609,414 |
| Events in quadrant D | 4,457,944 | 515,524 |
| Mode M0 | |||
|---|---|---|---|
| Quadrant | BADHDUFLAG | Total packets | Discarded packets |
| A | 0 | 12716 | 2 |
| B | 0 | 24621 | 2 |
| C | 0 | 12783 | 2 |
| D | 0 | 16948 | 9 |
| Mode M9 | |||
|---|---|---|---|
| Quadrant | BADHDUFLAG | Total packets | Discarded packets |
| A | 0 | 18 | 0 |
| B | 0 | 19 | 0 |
| C | 0 | 19 | 0 |
| D | 0 | 19 | 0 |
| Mode SS | |||
|---|---|---|---|
| Quadrant | BADHDUFLAG | Total packets | Discarded packets |
| A | 0 | 110 | 0 |
| B | 0 | 110 | 0 |
| C | 0 | 110 | 0 |
| D | 0 | 110 | 0 |
| Quadrant | Total seconds | Saturated seconds | Saturation percentage |
|---|---|---|---|
| A | 5289 | 30 | 0.567215% |
| B | 5289 | 1791 | 33.862734% |
| C | 5289 | 122 | 2.306674% |
| D | 5288 | 551 | 10.419818% |
Noise dominated data is calculated using 1-second bins in cleaned event files. If a bin has >2000 counts, and if more than 50% of those come from <1% of pixels, then it is considered to be noise-dominated and hence unusable.
| Quadrant | # 1 sec bins | Bins with >0 counts | Bins with >2000 counts | High rate bins dominated by noise | Noise dominated (total time) | Noise dominated (detector-on time) | Marked lightcurve |
|---|---|---|---|---|---|---|---|
| A | 7172 | 5290 | 21 | 21 | 0.29% | 0.40% | 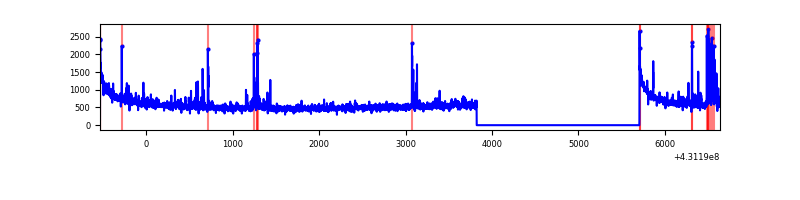 |
| B | 7171 | 5288 | 1724 | 1724 | 24.04% | 32.60% | 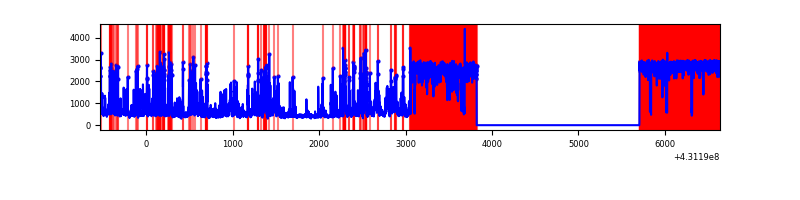 |
| C | 7172 | 5290 | 130 | 130 | 1.81% | 2.46% | 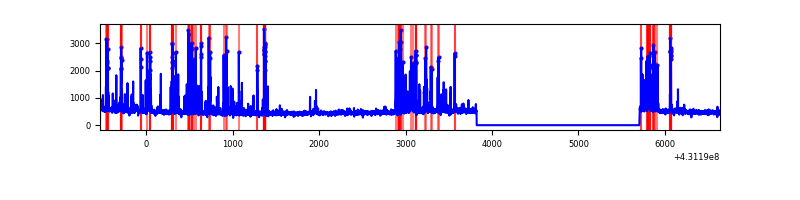 |
| D | 7170 | 5288 | 521 | 521 | 7.27% | 9.85% | 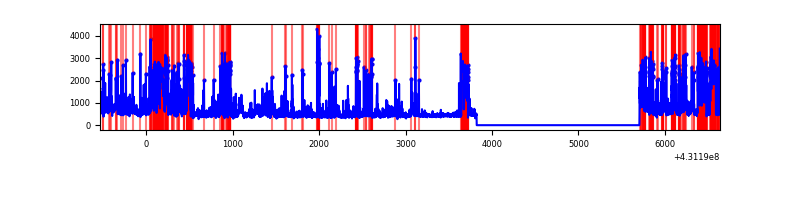 |
Top three noisy pixels from each quadrant. If the there are fewer than three noisy pixels in the level2.evt file, extra rows are filled as -1
| Pixel properties | Quadrant properties | ||||||
|---|---|---|---|---|---|---|---|
| Quadrant | DetID | PixID | Counts | Sigma | Mean | Median | Sigma |
| A | 10 | 83 | 625011 | 5146.47 | 593 | 581 | 121.3 |
| A | 13 | 248 | 149692 | 1228.95 | 593 | 581 | 121.3 |
| A | 12 | 189 | 61964 | 505.91 | 593 | 581 | 121.3 |
| B | 4 | 81 | 4806562 | 53632.48 | 461 | 449 | 89.6 |
| B | 4 | 171 | 299519 | 3337.39 | 461 | 449 | 89.6 |
| B | 15 | 85 | 60736 | 672.76 | 461 | 449 | 89.6 |
| C | 14 | 254 | 641462 | 4752.15 | 571 | 576 | 134.9 |
| C | 15 | 214 | 214830 | 1588.69 | 571 | 576 | 134.9 |
| C | 2 | 16 | 44000 | 321.99 | 571 | 576 | 134.9 |
| D | 10 | 118 | 800460 | 6026.09 | 542 | 529 | 132.7 |
| D | 1 | 52 | 715316 | 5384.68 | 542 | 529 | 132.7 |
| D | 2 | 249 | 236284 | 1776.0 | 542 | 529 | 132.7 |
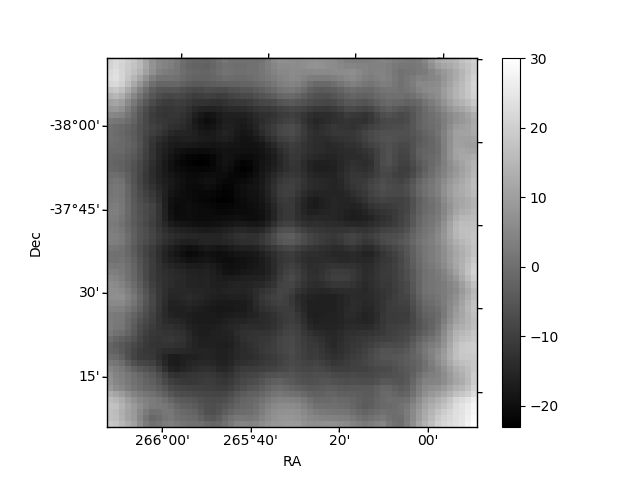
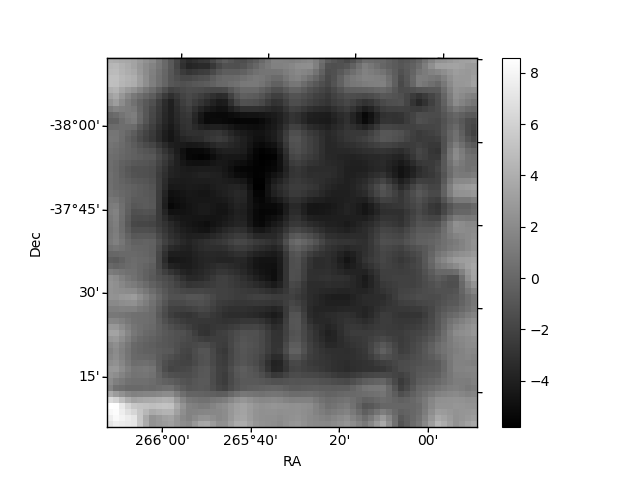
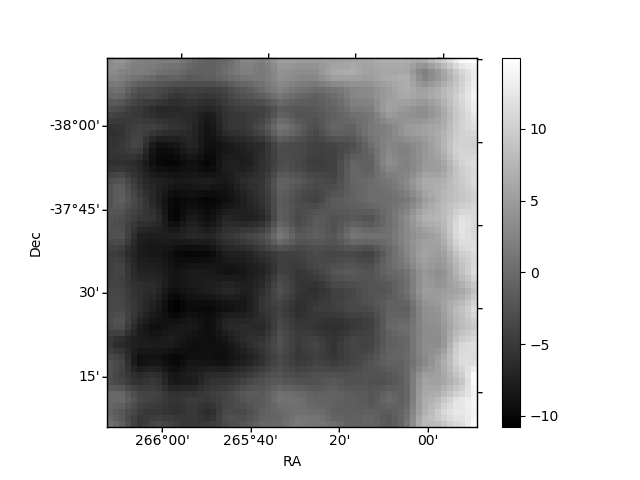
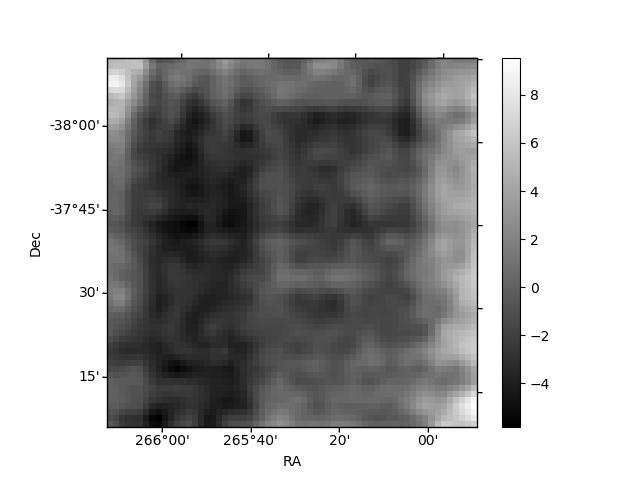
Histogram calculated using DETX and DETY for each event in the final _common_clean file
| Quadrant A | 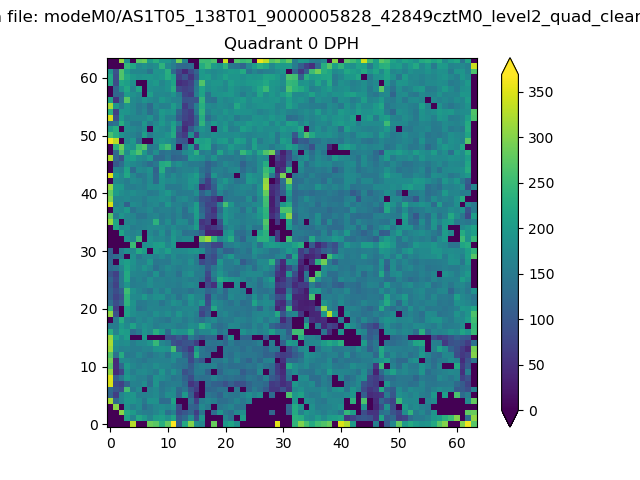 |
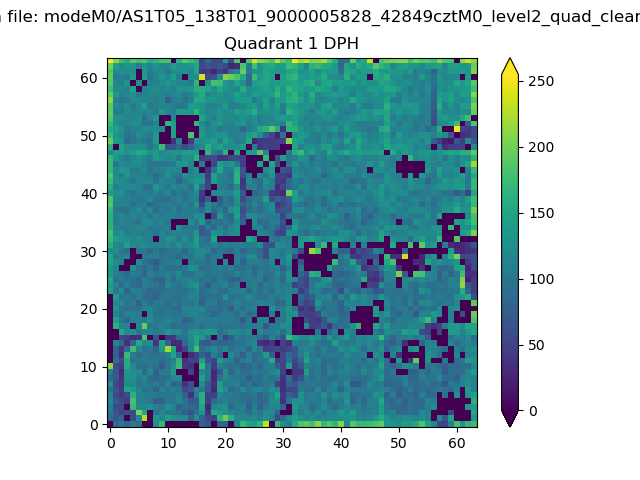 |
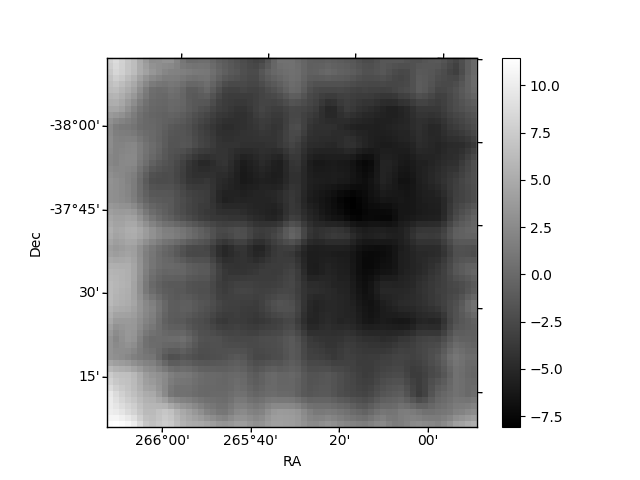
Quadrant B |
|---|---|---|---|
| Quadrant D | 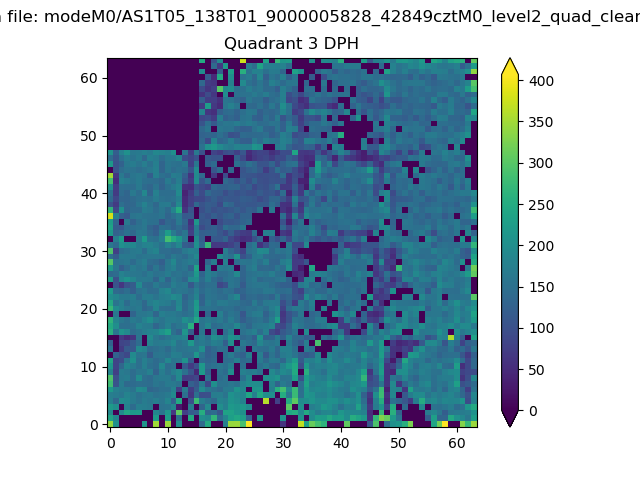 |
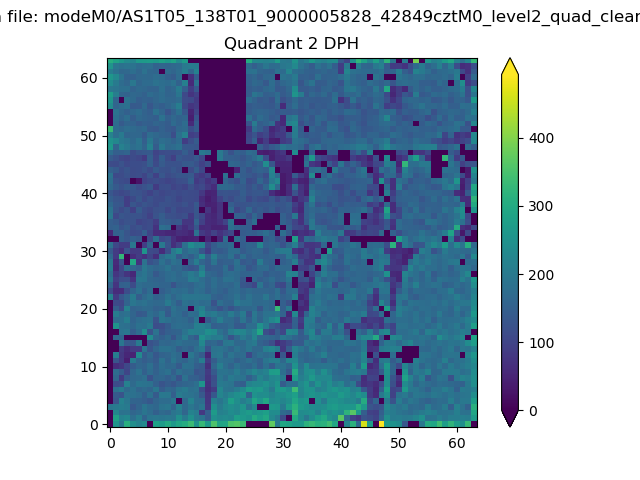 |
Quadrant C |
| Plot type | Count rate plots | Images |
|---|---|---|
| Comparison with Poisson distribution Blue bars denote a histogram of data divided into 1 sec bins. Red curve is a Poisson curve with rate = median count rate of data. |
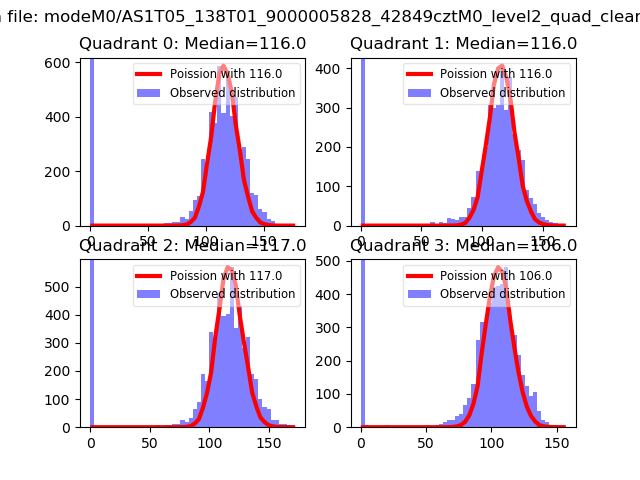 |
 |
| Quadrant-wise count rates Data is divided into 100 sec bins |
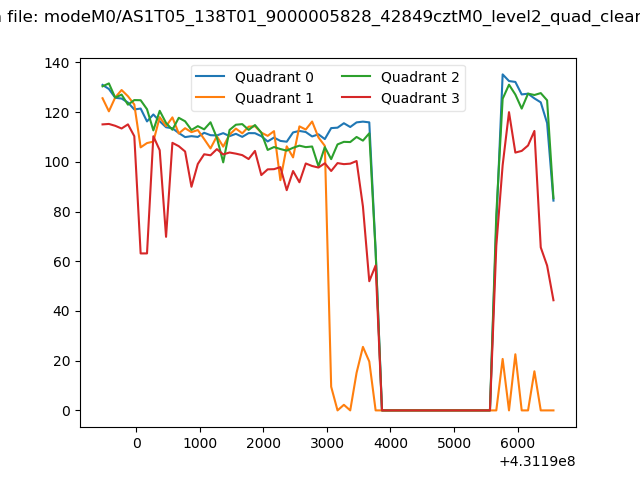 |
|
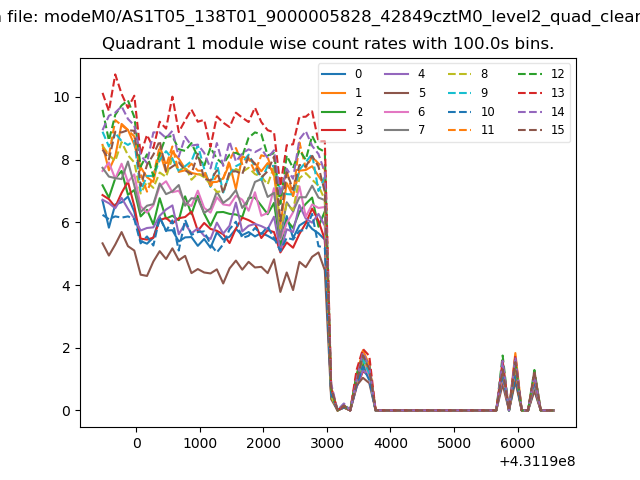
| Module-wise count rates for Quadrant A Data is divided into 100 sec bins |
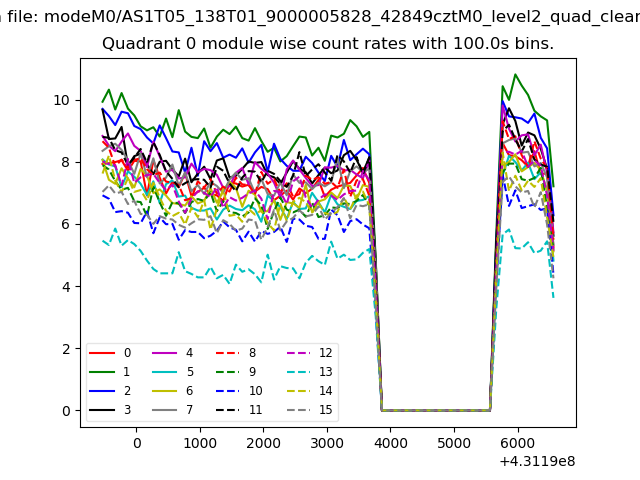 |
 |
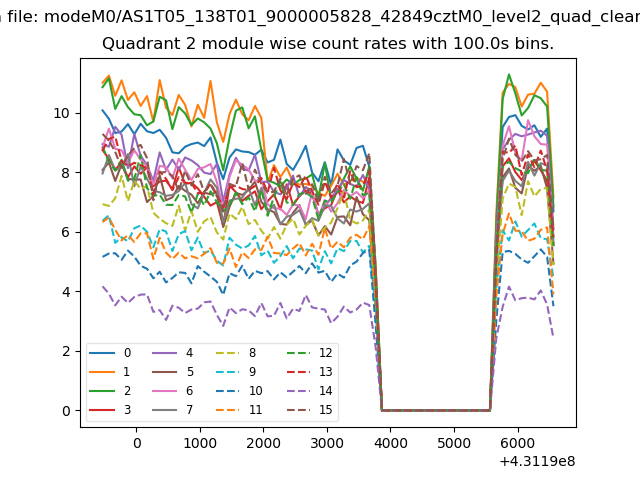
| Module-wise count rates for Quadrant B Data is divided into 100 sec bins |
 |
 |
| Module-wise count rates for Quadrant C Data is divided into 100 sec bins |
 |
 |
| Module-wise count rates for Quadrant D Data is divided into 100 sec bins |
 |
 |
| Parameter | Plot |
|---|---|
| CZT HV Monitor | 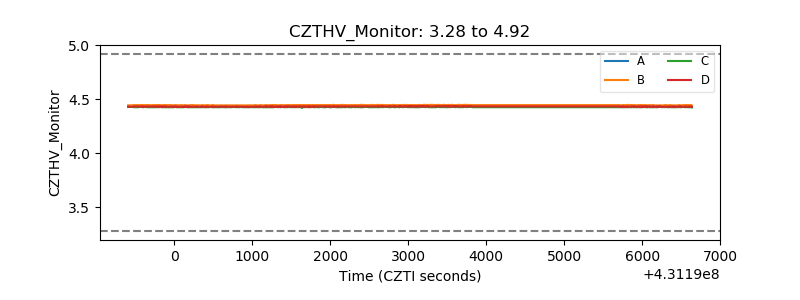 |
| D_VDD | 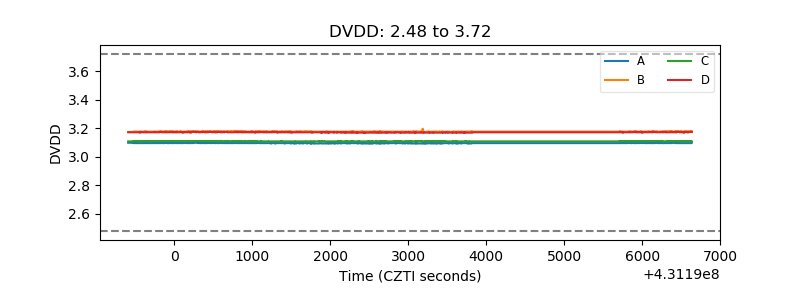 |
| Temperature 1 | 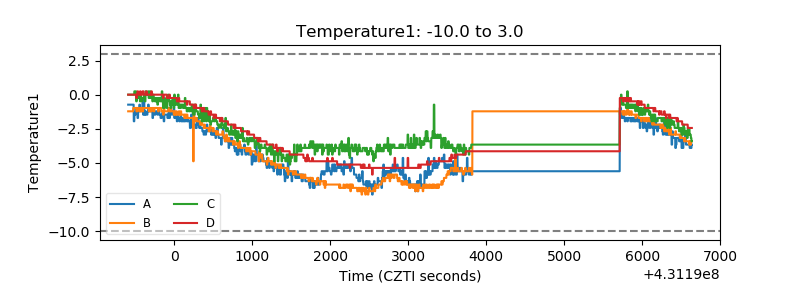 |
| Veto HV Monitor | 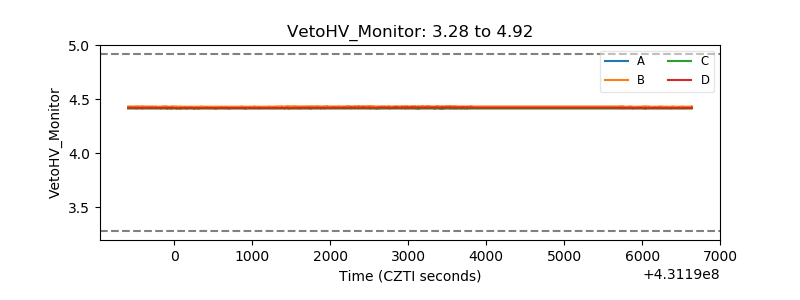 |
| Veto LLD | 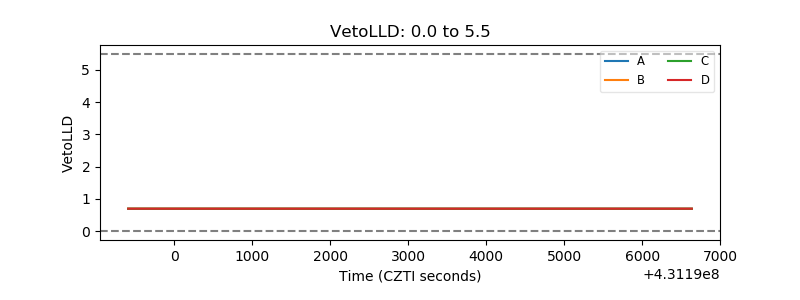 |
| Alpha Counter | 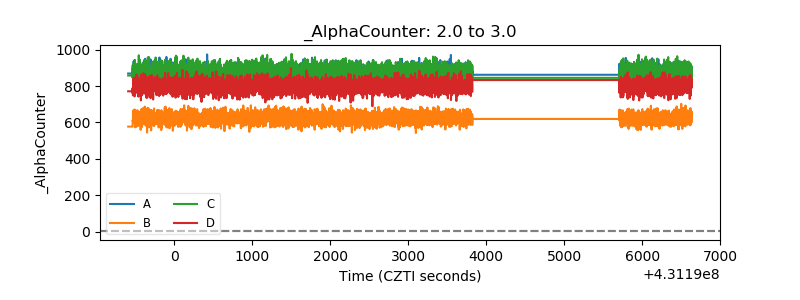 |
| _CPM_Rate | 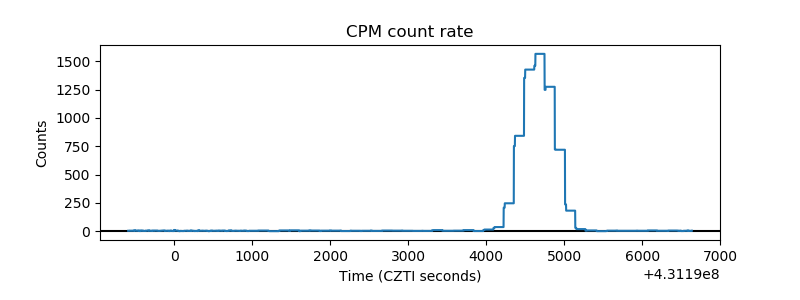 |
| CZT Counter | 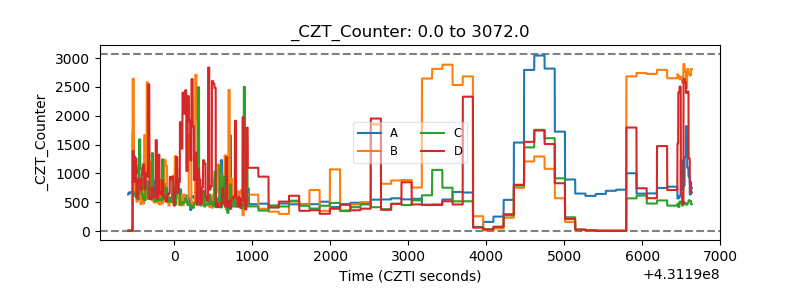 |
| +2.5 Volts monitor | 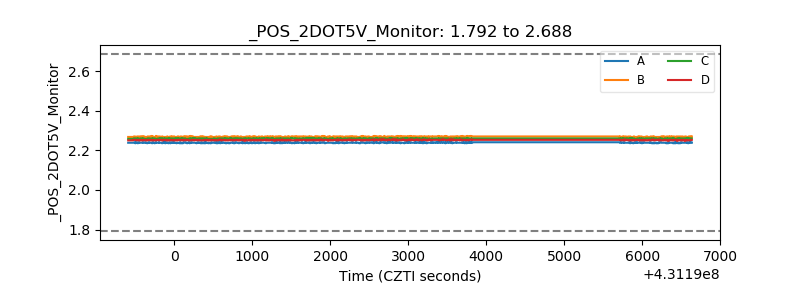 |
| +5 Volts monitor | 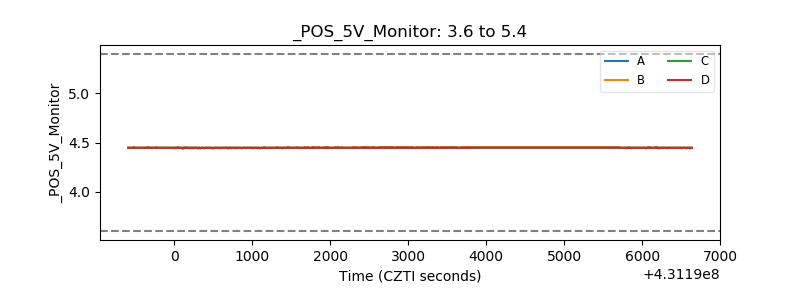 |
| _ROLL_ROT | 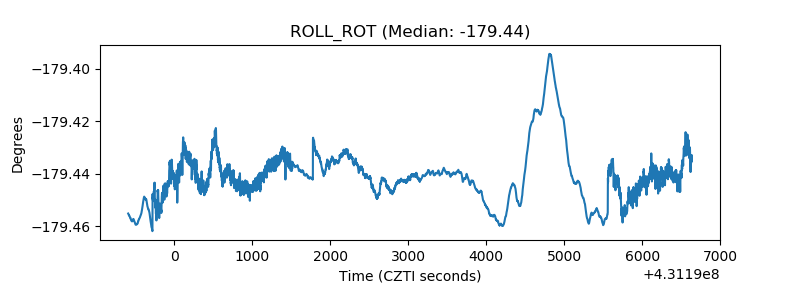 |
| _Roll_DEC | 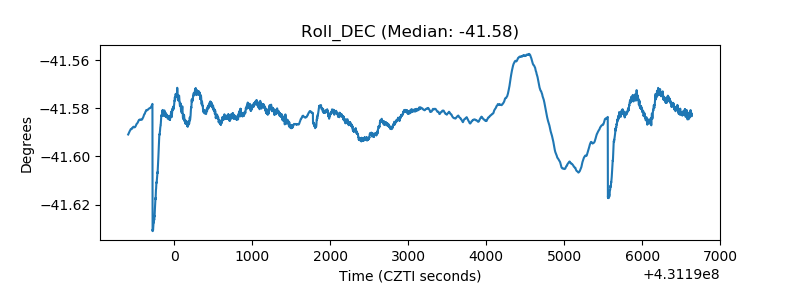 |
| _Roll_RA | 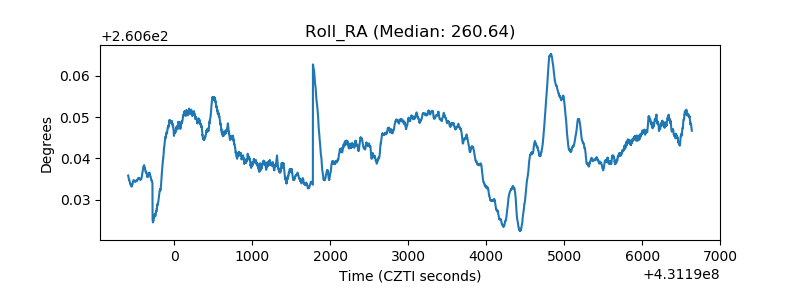 |
| Veto Counter | 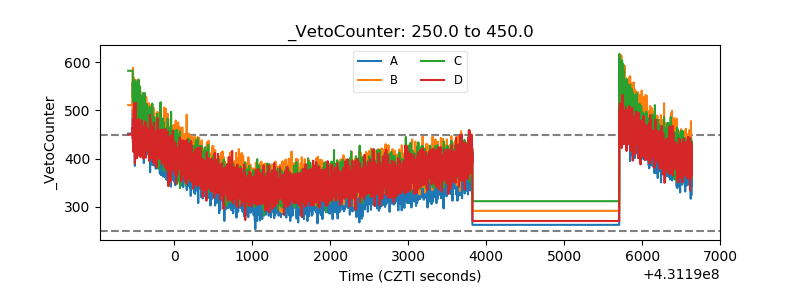 |