| Param | Original file | Final file |
|---|---|---|
| Filename | modeM0/AS1T05_138T01_9000005828_42850cztM0_level2.fits | modeM0/AS1T05_138T01_9000005828_42850cztM0_level2_quad_clean.evt |
| Size (bytes) | 510,272,640 | 77,238,720 |
| Size | 486.6 MB | 73.7 MB |
| Events in quadrant A | 3,014,536 | 592,471 |
| Events in quadrant B | 9,019,126 | 304,773 |
| Events in quadrant C | 2,777,447 | 583,637 |
| Events in quadrant D | 3,689,966 | 508,270 |
| Mode M0 | |||
|---|---|---|---|
| Quadrant | BADHDUFLAG | Total packets | Discarded packets |
| A | 0 | 12092 | 2 |
| B | 0 | 30146 | 1 |
| C | 0 | 11437 | 1 |
| D | 0 | 14345 | 1 |
| Mode M9 | |||
|---|---|---|---|
| Quadrant | BADHDUFLAG | Total packets | Discarded packets |
| A | 0 | 20 | 0 |
| B | 0 | 20 | 0 |
| C | 0 | 20 | 0 |
| D | 0 | 20 | 0 |
| Mode SS | |||
|---|---|---|---|
| Quadrant | BADHDUFLAG | Total packets | Discarded packets |
| A | 0 | 102 | 0 |
| B | 0 | 102 | 0 |
| C | 0 | 102 | 0 |
| D | 0 | 102 | 0 |
| Quadrant | Total seconds | Saturated seconds | Saturation percentage |
|---|---|---|---|
| A | 4983 | 24 | 0.481638% |
| B | 4983 | 2704 | 54.264499% |
| C | 4983 | 60 | 1.204094% |
| D | 4984 | 310 | 6.219904% |
Noise dominated data is calculated using 1-second bins in cleaned event files. If a bin has >2000 counts, and if more than 50% of those come from <1% of pixels, then it is considered to be noise-dominated and hence unusable.
| Quadrant | # 1 sec bins | Bins with >0 counts | Bins with >2000 counts | High rate bins dominated by noise | Noise dominated (total time) | Noise dominated (detector-on time) | Marked lightcurve |
|---|---|---|---|---|---|---|---|
| A | 6984 | 4984 | 21 | 21 | 0.30% | 0.42% | 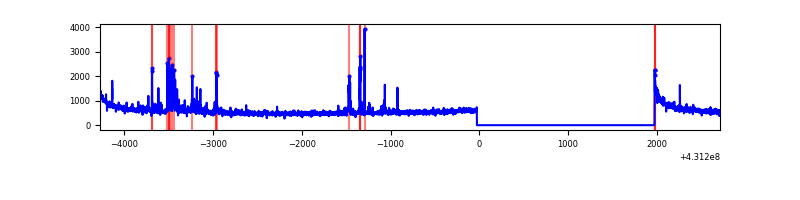 |
| B | 6984 | 4984 | 2574 | 2574 | 36.86% | 51.65% | 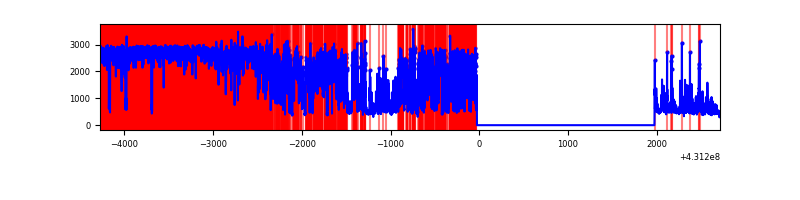 |
| C | 6984 | 4984 | 58 | 58 | 0.83% | 1.16% | 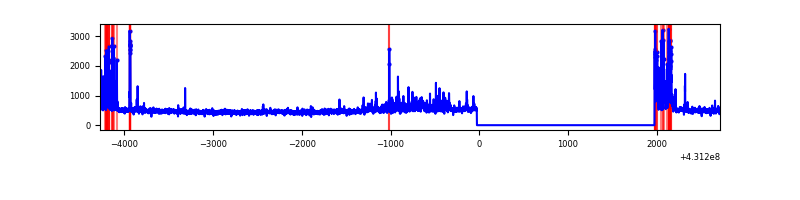 |
| D | 6985 | 4985 | 327 | 327 | 4.68% | 6.56% | 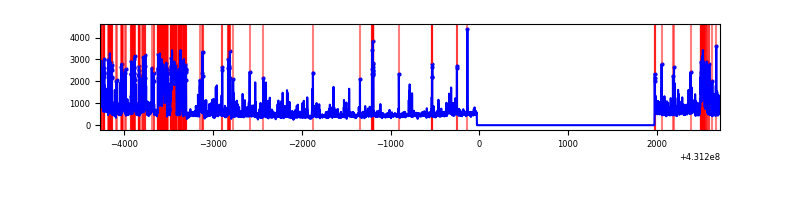 |
Top three noisy pixels from each quadrant. If the there are fewer than three noisy pixels in the level2.evt file, extra rows are filled as -1
| Pixel properties | Quadrant properties | ||||||
|---|---|---|---|---|---|---|---|
| Quadrant | DetID | PixID | Counts | Sigma | Mean | Median | Sigma |
| A | 10 | 83 | 562860 | 4854.02 | 563 | 552 | 115.8 |
| A | 13 | 248 | 111420 | 957.05 | 563 | 552 | 115.8 |
| A | 12 | 189 | 73048 | 625.81 | 563 | 552 | 115.8 |
| B | 4 | 81 | 7162010 | 89260.72 | 411 | 400 | 80.2 |
| B | 5 | 255 | 105971 | 1315.81 | 411 | 400 | 80.2 |
| B | 15 | 85 | 56933 | 704.61 | 411 | 400 | 80.2 |
| C | 14 | 254 | 299096 | 2321.52 | 546 | 551 | 128.6 |
| C | 15 | 214 | 200175 | 1552.3 | 546 | 551 | 128.6 |
| C | 12 | 2 | 104462 | 808.02 | 546 | 551 | 128.6 |
| D | 10 | 118 | 671910 | 5260.12 | 526 | 511 | 127.6 |
| D | 1 | 52 | 503638 | 3941.78 | 526 | 511 | 127.6 |
| D | 2 | 249 | 204048 | 1594.62 | 526 | 511 | 127.6 |
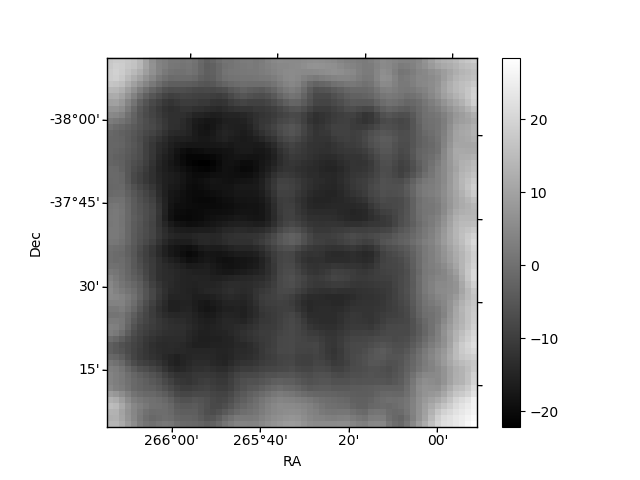
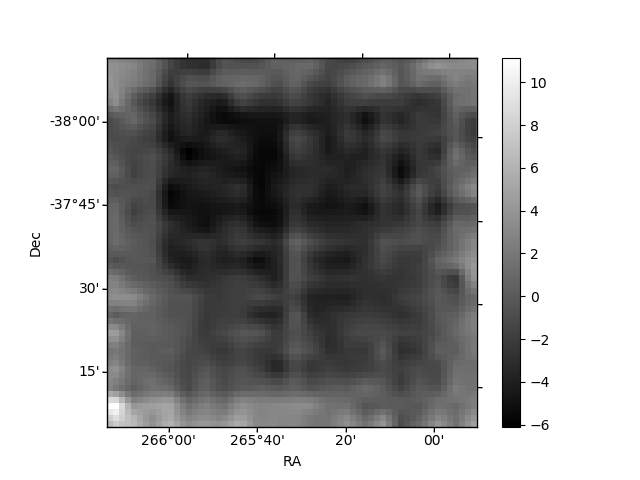
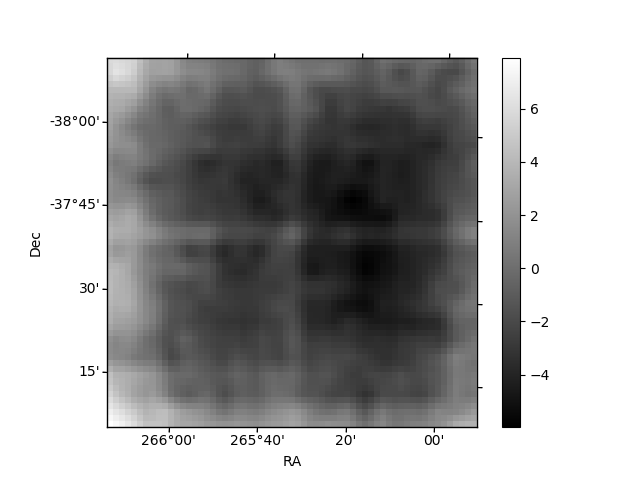
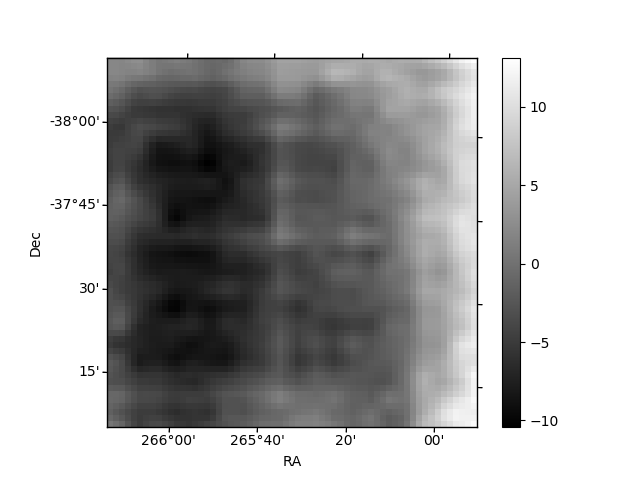
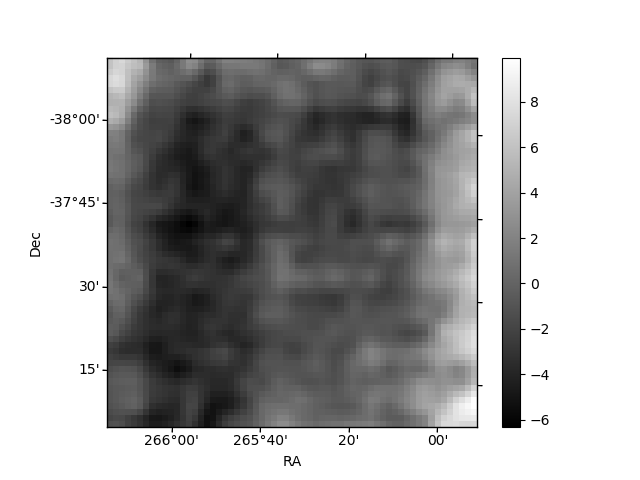
Histogram calculated using DETX and DETY for each event in the final _common_clean file
| Quadrant A | 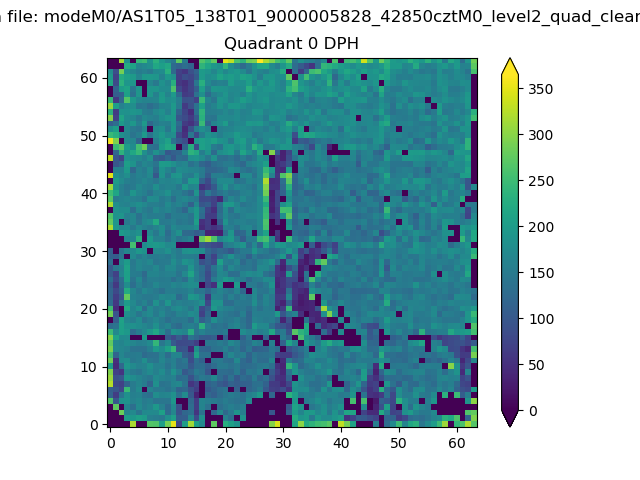 |
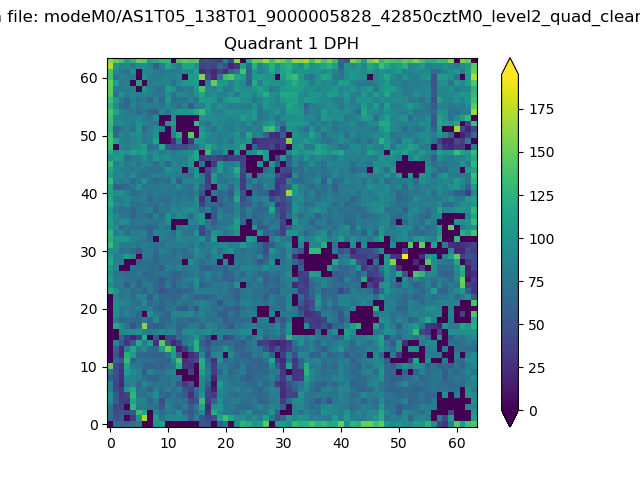 |
Quadrant B |
|---|---|---|---|
| Quadrant D | 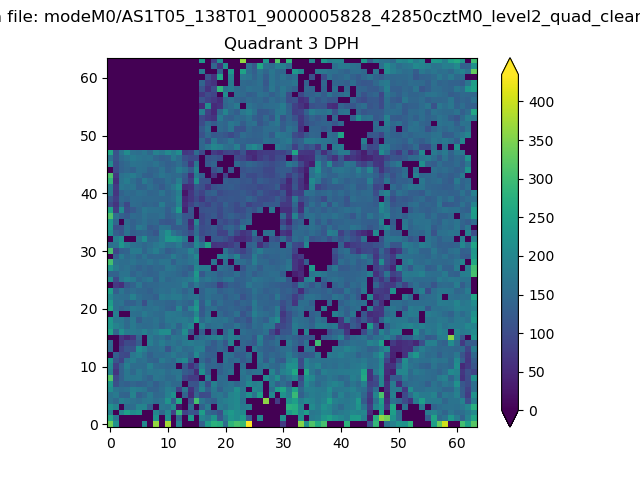 |
 |
Quadrant C |
| Plot type | Count rate plots | Images |
|---|---|---|
| Comparison with Poisson distribution Blue bars denote a histogram of data divided into 1 sec bins. Red curve is a Poisson curve with rate = median count rate of data. |
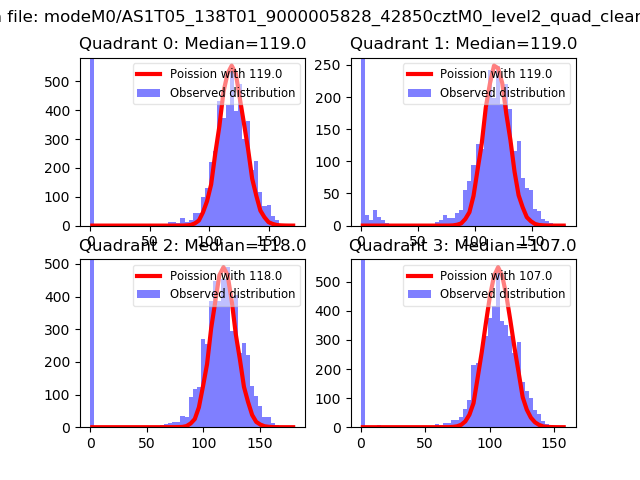 |
 |
| Quadrant-wise count rates Data is divided into 100 sec bins |
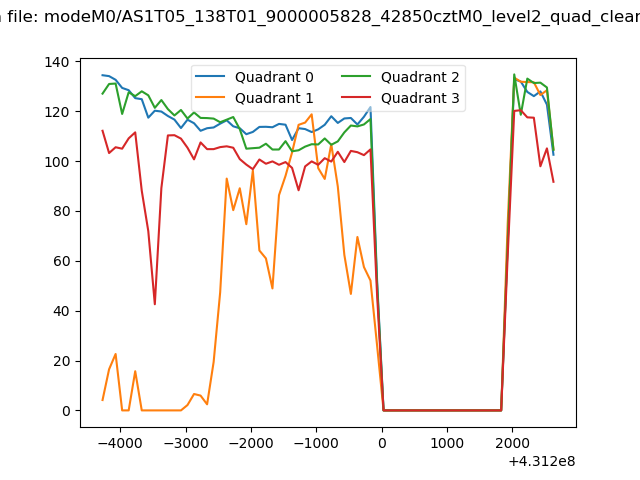 |
|
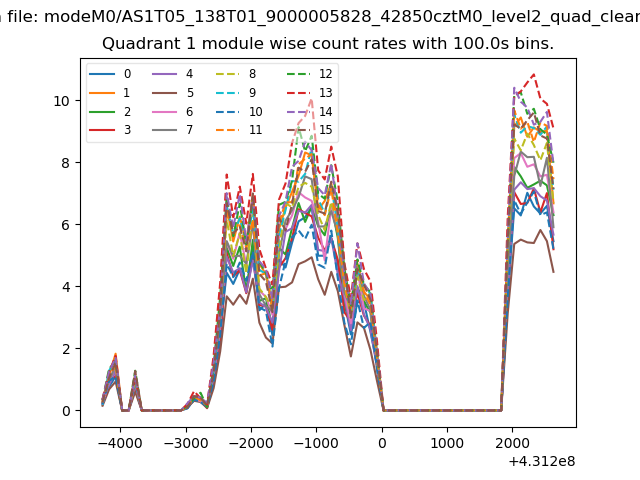
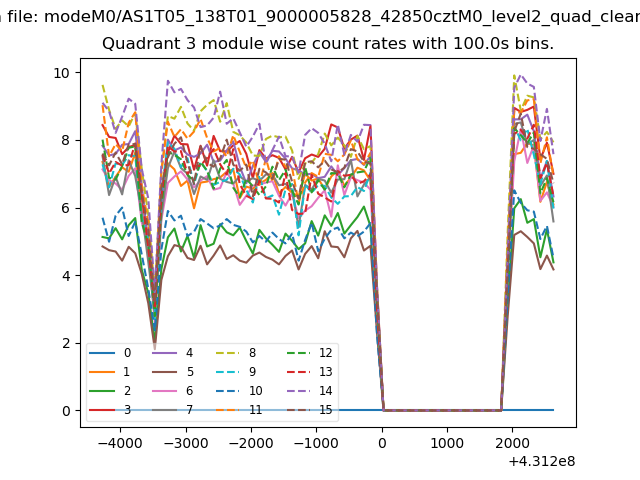
| Module-wise count rates for Quadrant A Data is divided into 100 sec bins |
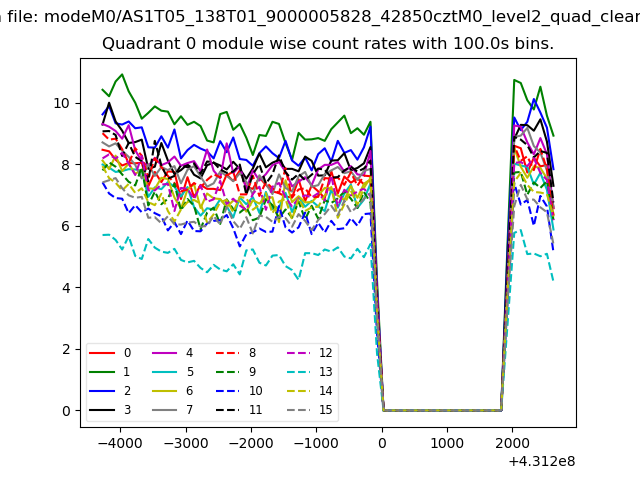 |
 |
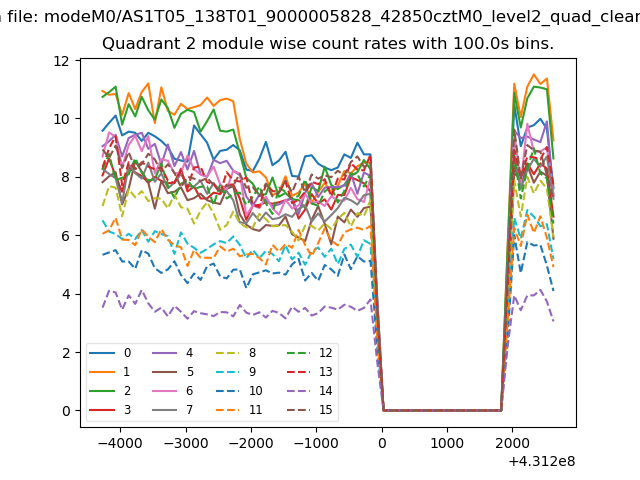
| Module-wise count rates for Quadrant B Data is divided into 100 sec bins |
 |
 |
| Module-wise count rates for Quadrant C Data is divided into 100 sec bins |
 |
 |
| Module-wise count rates for Quadrant D Data is divided into 100 sec bins |
 |
 |
| Parameter | Plot |
|---|---|
| CZT HV Monitor | 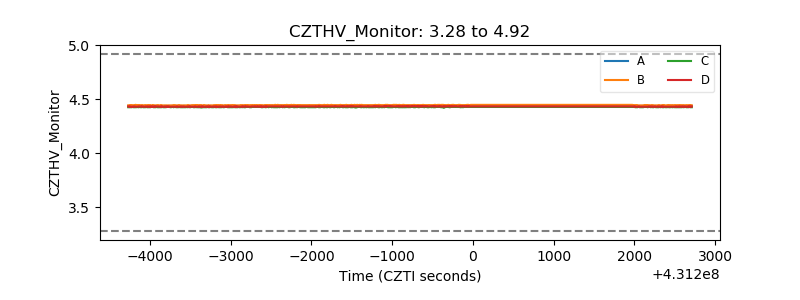 |
| D_VDD | 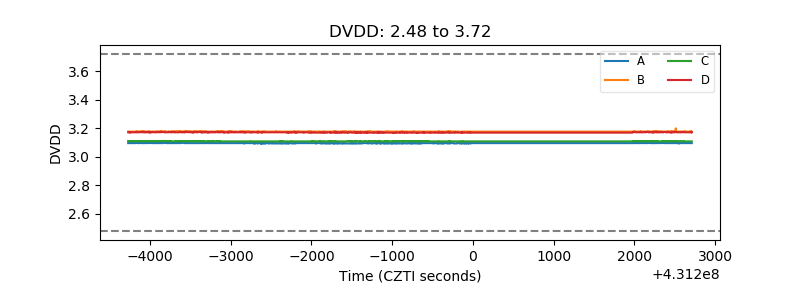 |
| Temperature 1 | 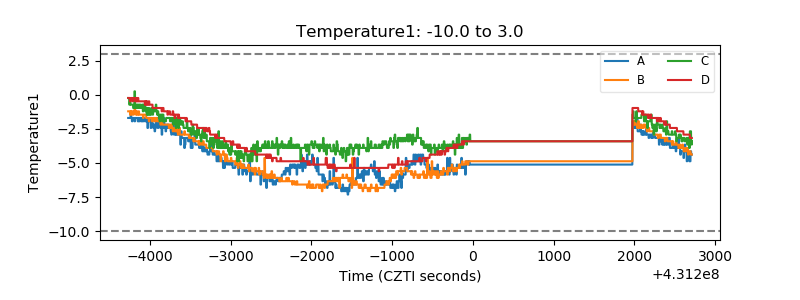 |
| Veto HV Monitor | 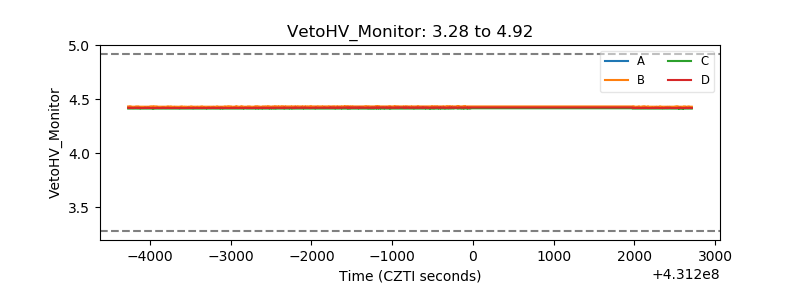 |
| Veto LLD | 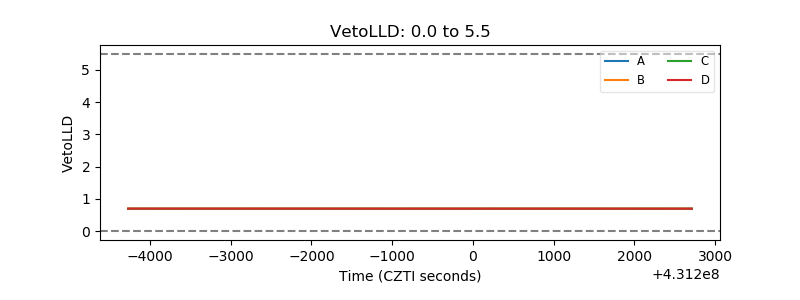 |
| Alpha Counter | 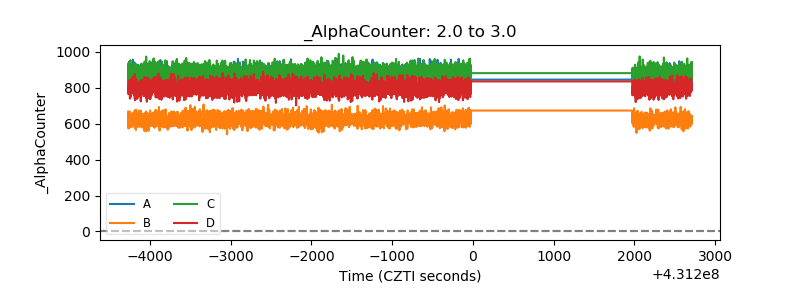 |
| _CPM_Rate | 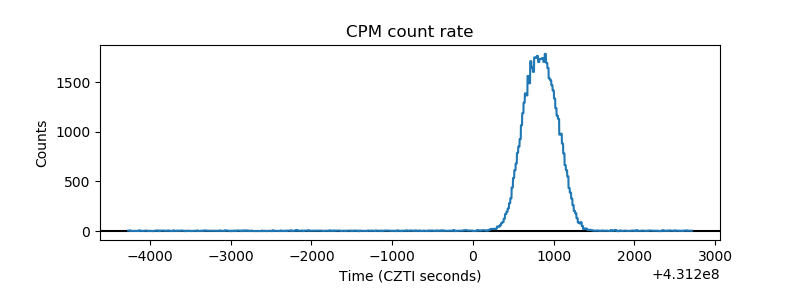 |
| CZT Counter |  |
| +2.5 Volts monitor | 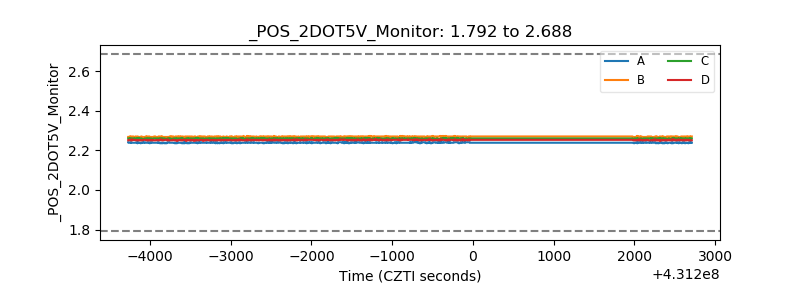 |
| +5 Volts monitor | 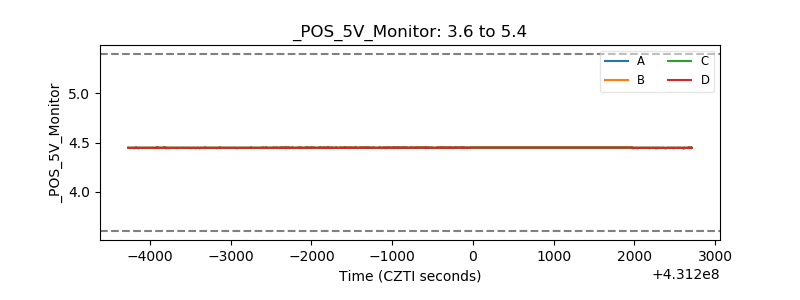 |
| _ROLL_ROT | 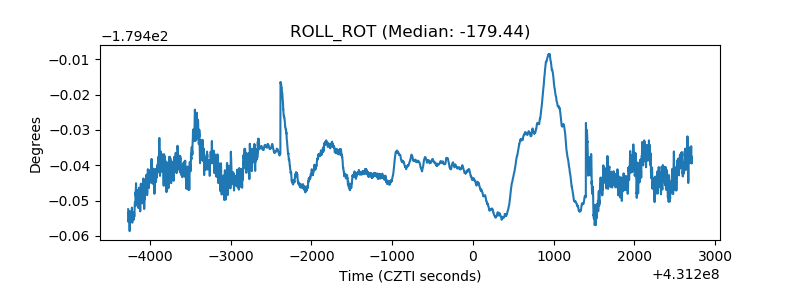 |
| _Roll_DEC | 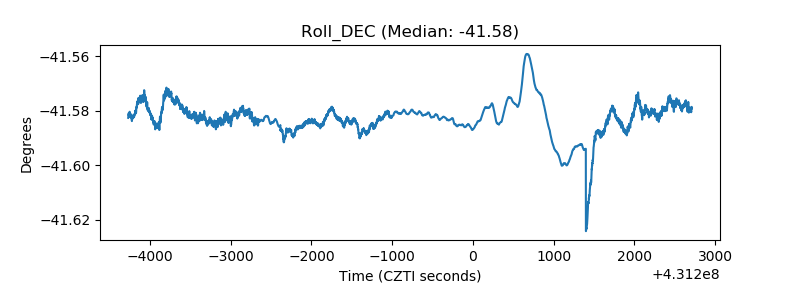 |
| _Roll_RA | 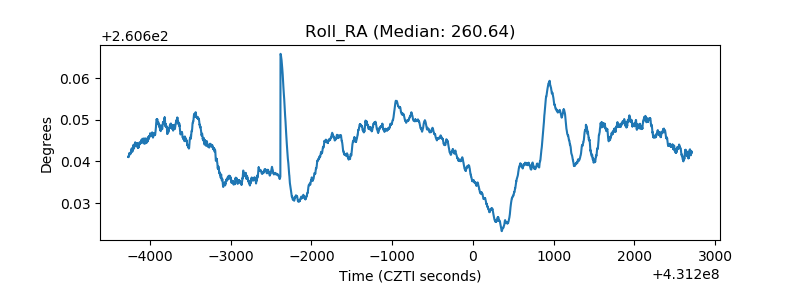 |
| Veto Counter | 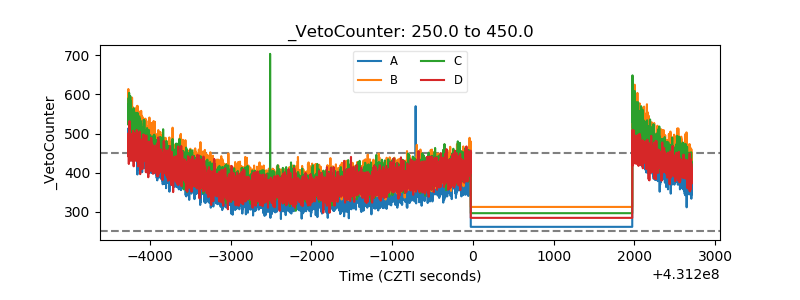 |