| Param | Original file | Final file |
|---|---|---|
| Filename | modeM0/AS1T05_138T01_9000005828_42852cztM0_level2.fits | modeM0/AS1T05_138T01_9000005828_42852cztM0_level2_quad_clean.evt |
| Size (bytes) | 294,693,120 | 82,707,840 |
| Size | 281.0 MB | 78.9 MB |
| Events in quadrant A | 2,698,925 | 553,012 |
| Events in quadrant B | 2,509,152 | 568,393 |
| Events in quadrant C | 2,508,787 | 554,316 |
| Events in quadrant D | 2,816,457 | 491,176 |
| Mode M0 | |||
|---|---|---|---|
| Quadrant | BADHDUFLAG | Total packets | Discarded packets |
| A | 0 | 10908 | 36 |
| B | 0 | 10764 | 18 |
| C | 0 | 10365 | 28 |
| D | 0 | 11821 | 57 |
| Mode M9 | |||
|---|---|---|---|
| Quadrant | BADHDUFLAG | Total packets | Discarded packets |
| A | 0 | 39 | 0 |
| B | 0 | 40 | 0 |
| C | 0 | 40 | 0 |
| D | 0 | 40 | 0 |
| Mode SS | |||
|---|---|---|---|
| Quadrant | BADHDUFLAG | Total packets | Discarded packets |
| A | 0 | 98 | 0 |
| B | 0 | 98 | 0 |
| C | 0 | 98 | 0 |
| D | 0 | 98 | 0 |
| Quadrant | Total seconds | Saturated seconds | Saturation percentage |
|---|---|---|---|
| A | 4807 | 26 | 0.540878% |
| B | 4820 | 80 | 1.659751% |
| C | 4813 | 37 | 0.768751% |
| D | 4805 | 153 | 3.184183% |
Noise dominated data is calculated using 1-second bins in cleaned event files. If a bin has >2000 counts, and if more than 50% of those come from <1% of pixels, then it is considered to be noise-dominated and hence unusable.
| Quadrant | # 1 sec bins | Bins with >0 counts | Bins with >2000 counts | High rate bins dominated by noise | Noise dominated (total time) | Noise dominated (detector-on time) | Marked lightcurve |
|---|---|---|---|---|---|---|---|
| A | 6984 | 4821 | 11 | 11 | 0.16% | 0.23% | 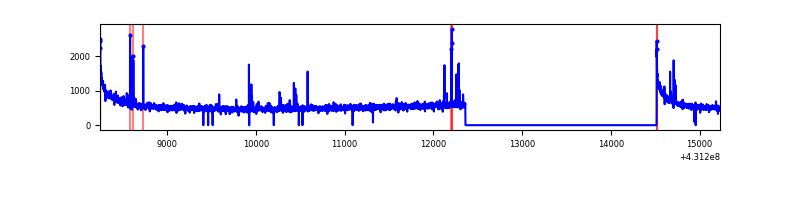 |
| B | 6984 | 4829 | 55 | 55 | 0.79% | 1.14% | 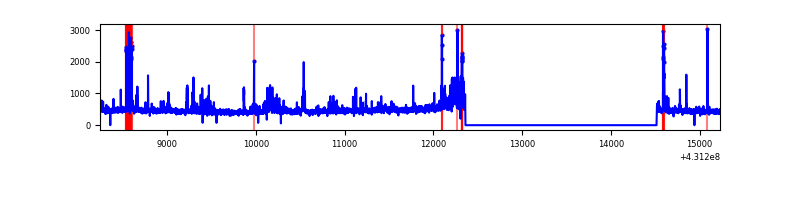 |
| C | 6984 | 4826 | 38 | 38 | 0.54% | 0.79% | 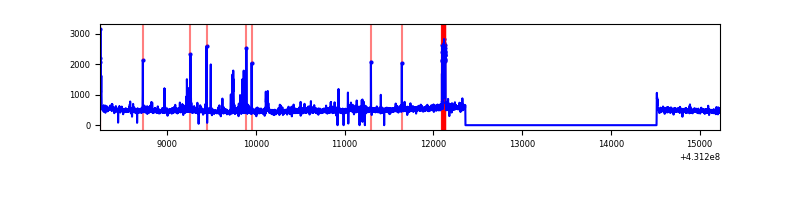 |
| D | 6983 | 4820 | 157 | 157 | 2.25% | 3.26% | 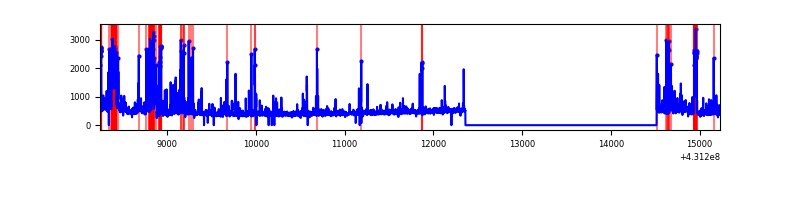 |
Top three noisy pixels from each quadrant. If the there are fewer than three noisy pixels in the level2.evt file, extra rows are filled as -1
| Pixel properties | Quadrant properties | ||||||
|---|---|---|---|---|---|---|---|
| Quadrant | DetID | PixID | Counts | Sigma | Mean | Median | Sigma |
| A | 10 | 83 | 528153 | 4831.78 | 530 | 520 | 109.2 |
| A | 12 | 189 | 49194 | 445.73 | 530 | 520 | 109.2 |
| A | 15 | 237 | 36160 | 326.37 | 530 | 520 | 109.2 |
| B | 4 | 171 | 232282 | 2240.14 | 531 | 516 | 103.5 |
| B | 5 | 255 | 130307 | 1254.5 | 531 | 516 | 103.5 |
| B | 0 | 245 | 26686 | 252.95 | 531 | 516 | 103.5 |
| C | 15 | 214 | 196807 | 1593.46 | 524 | 529 | 123.2 |
| C | 14 | 254 | 171953 | 1391.69 | 524 | 529 | 123.2 |
| C | 0 | 239 | 47768 | 383.5 | 524 | 529 | 123.2 |
| D | 2 | 249 | 391354 | 3158.8 | 507 | 493 | 123.7 |
| D | 1 | 52 | 159543 | 1285.38 | 507 | 493 | 123.7 |
| D | 10 | 118 | 131985 | 1062.67 | 507 | 493 | 123.7 |
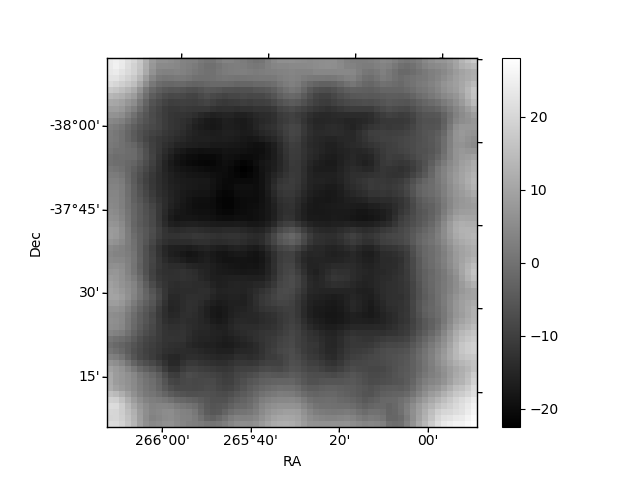
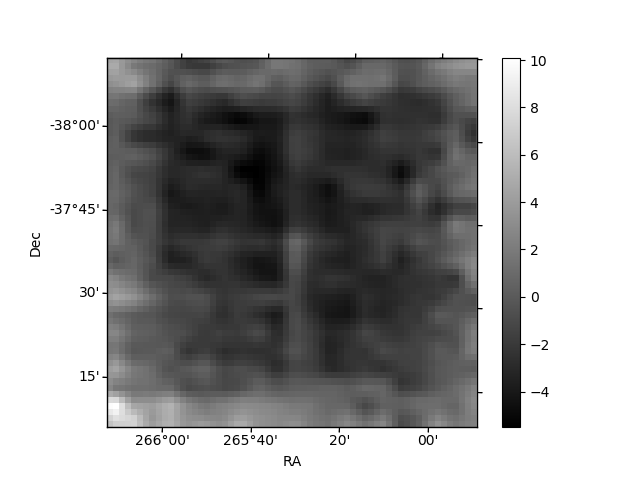
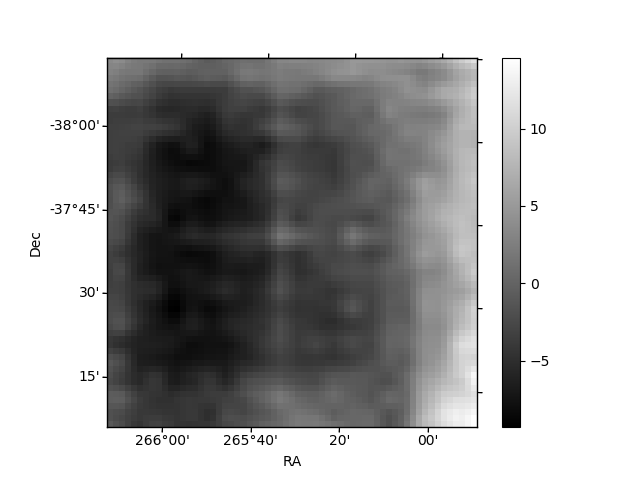
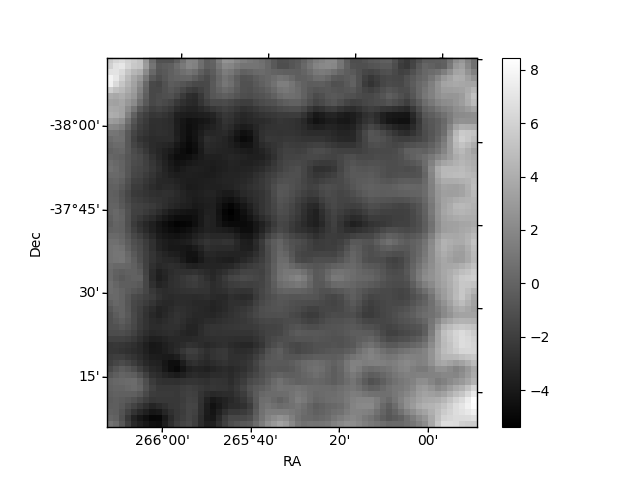
Histogram calculated using DETX and DETY for each event in the final _common_clean file
| Quadrant A | 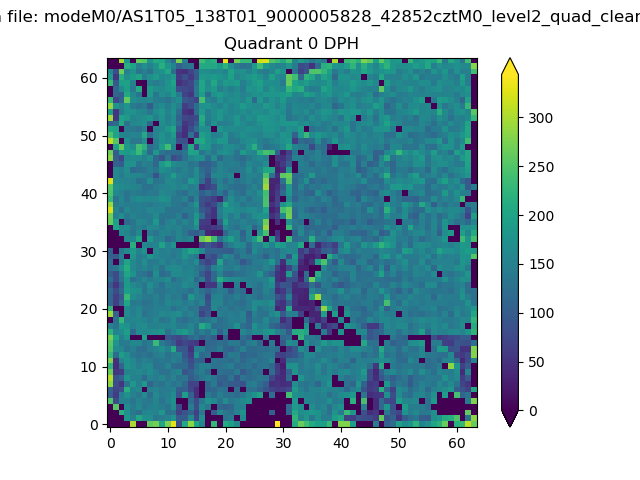 |
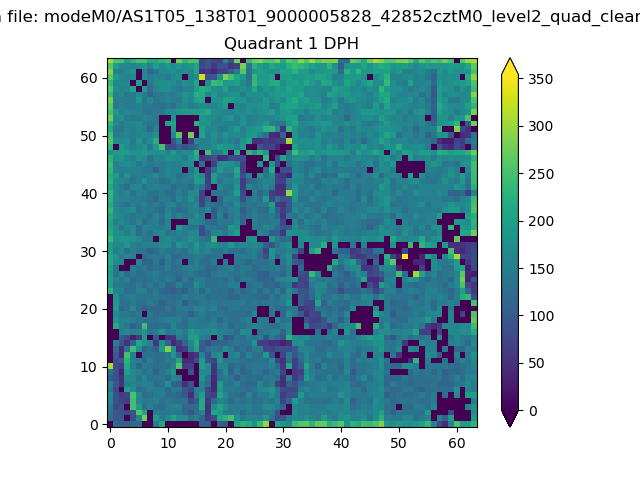 |
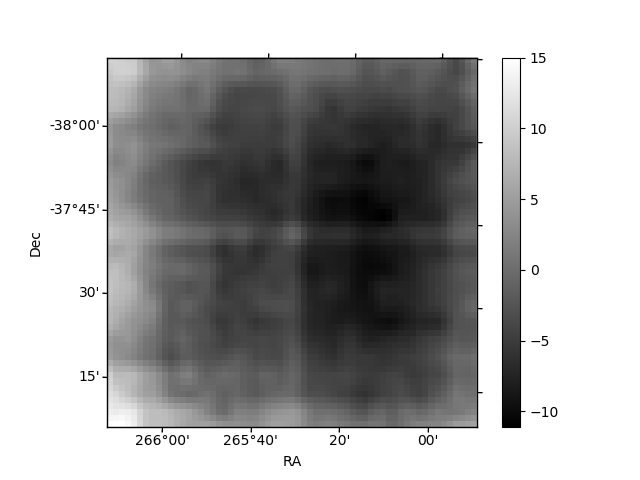
Quadrant B |
|---|---|---|---|
| Quadrant D | 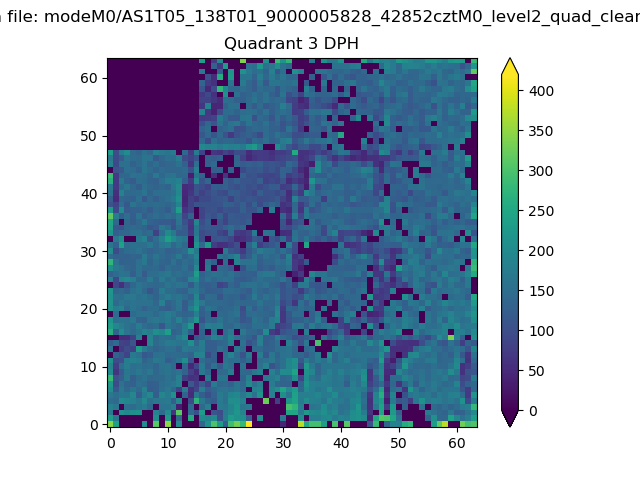 |
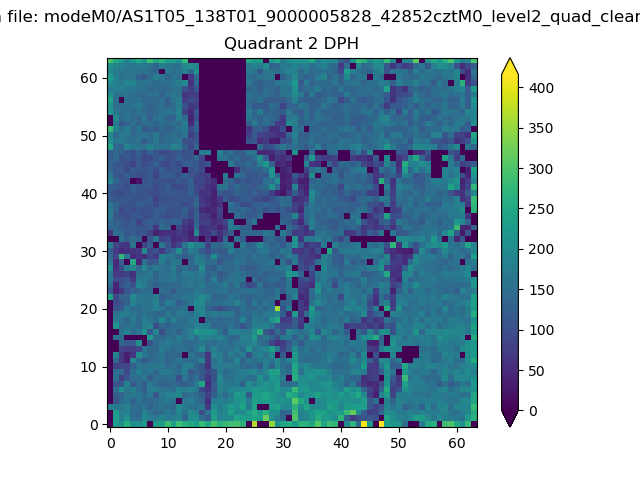 |
Quadrant C |
| Plot type | Count rate plots | Images |
|---|---|---|
| Comparison with Poisson distribution Blue bars denote a histogram of data divided into 1 sec bins. Red curve is a Poisson curve with rate = median count rate of data. |
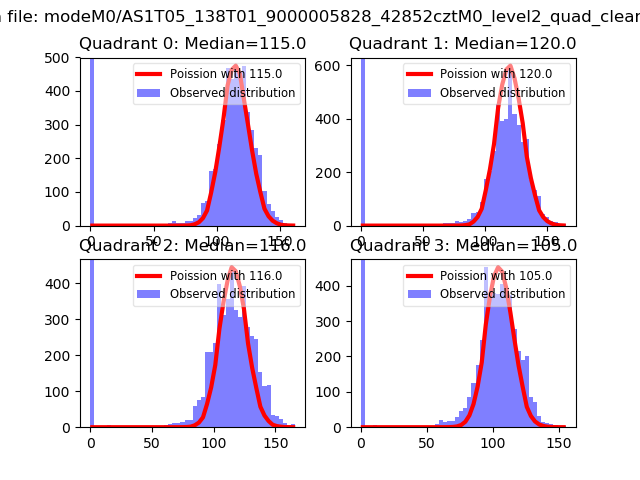 |
 |
| Quadrant-wise count rates Data is divided into 100 sec bins |
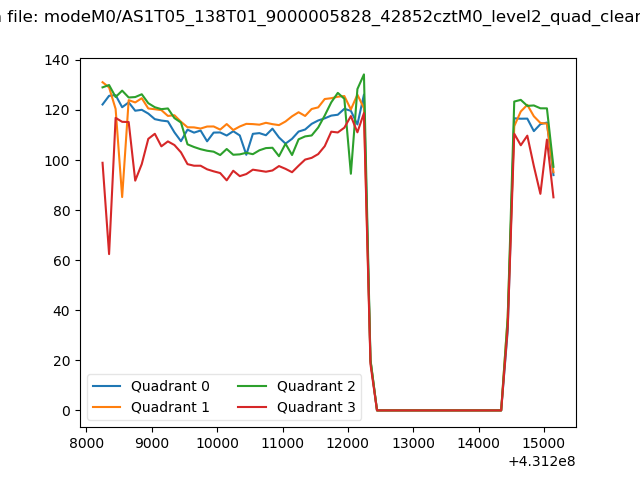 |
|
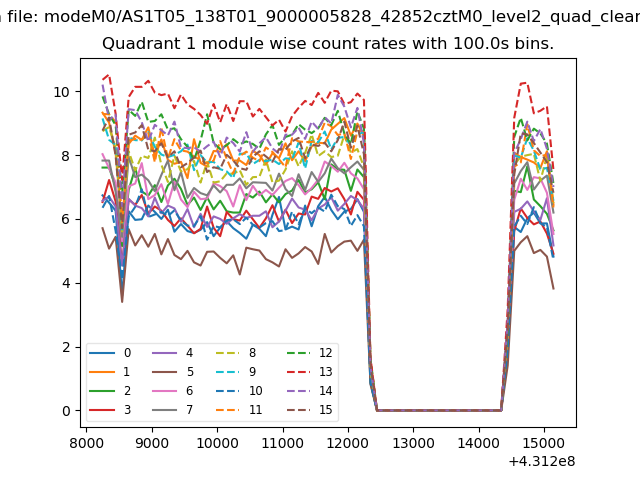
| Module-wise count rates for Quadrant A Data is divided into 100 sec bins |
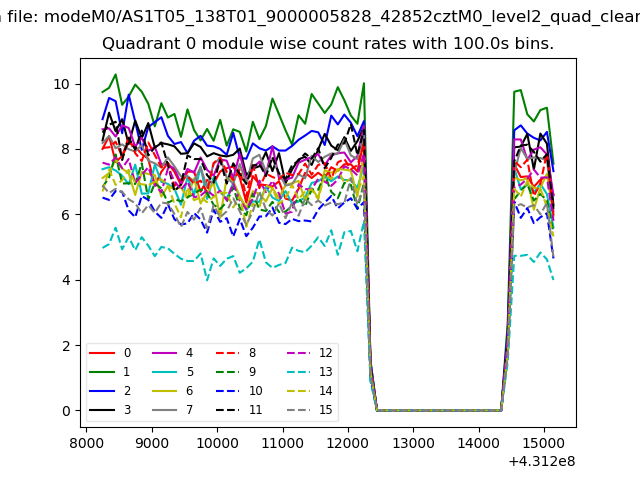 |
 |
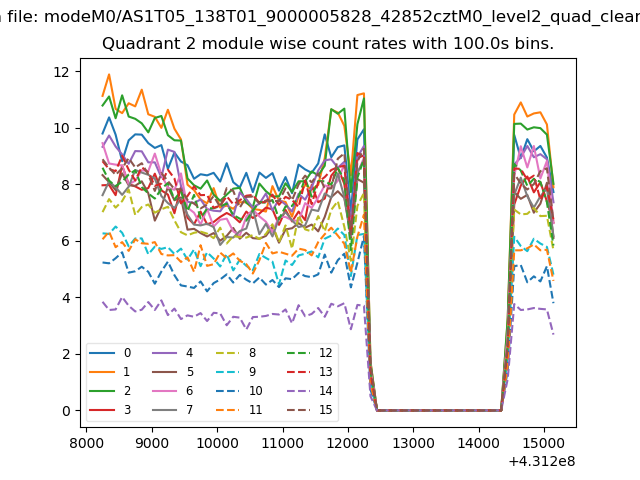
| Module-wise count rates for Quadrant B Data is divided into 100 sec bins |
 |
 |
| Module-wise count rates for Quadrant C Data is divided into 100 sec bins |
 |
 |
| Module-wise count rates for Quadrant D Data is divided into 100 sec bins |
 |
 |
| Parameter | Plot |
|---|---|
| CZT HV Monitor | 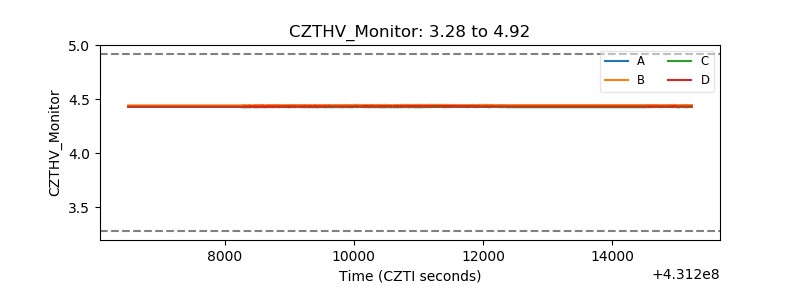 |
| D_VDD | 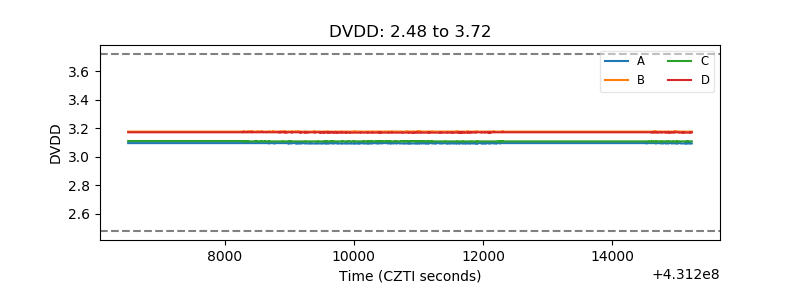 |
| Temperature 1 | 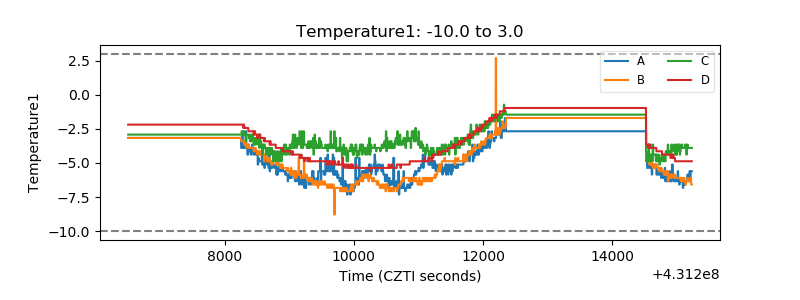 |
| Veto HV Monitor | 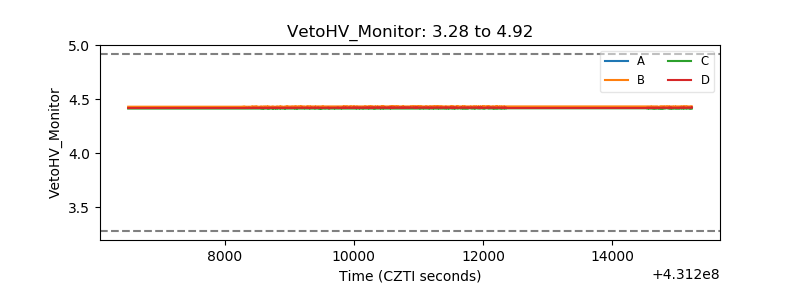 |
| Veto LLD | 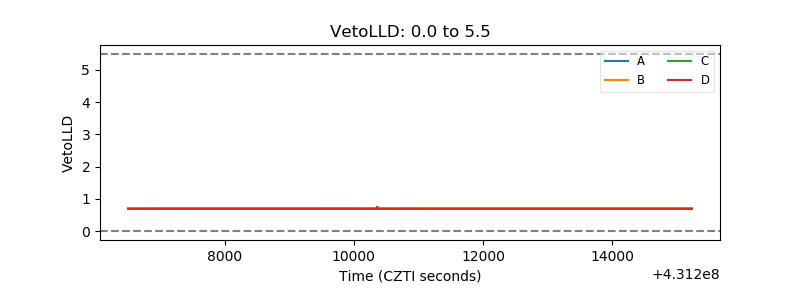 |
| Alpha Counter | 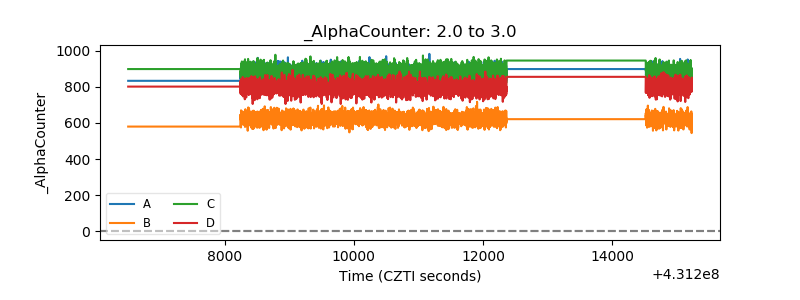 |
| _CPM_Rate | 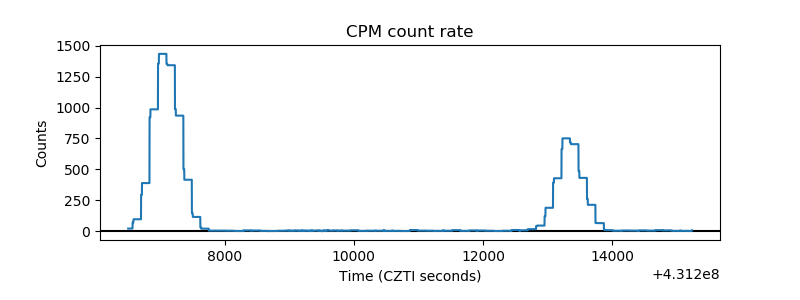 |
| CZT Counter | 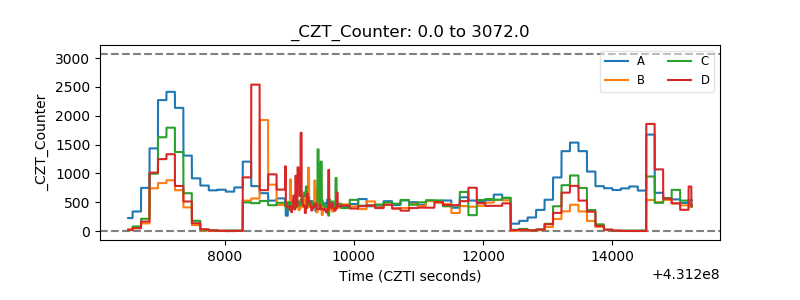 |
| +2.5 Volts monitor | 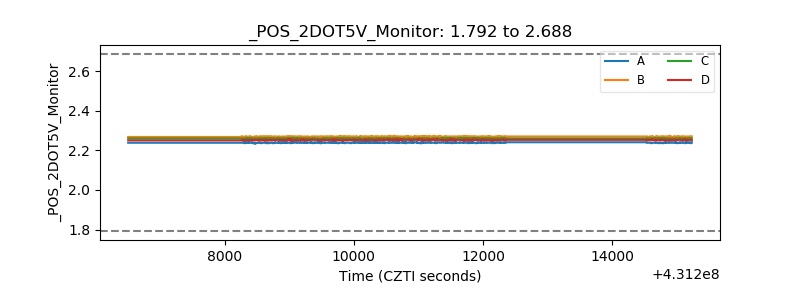 |
| +5 Volts monitor |  |
| _ROLL_ROT | 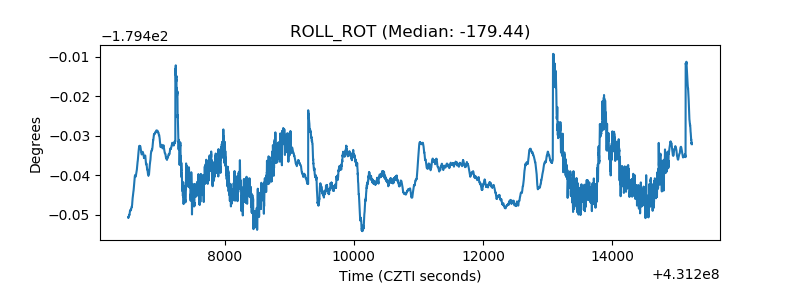 |
| _Roll_DEC | 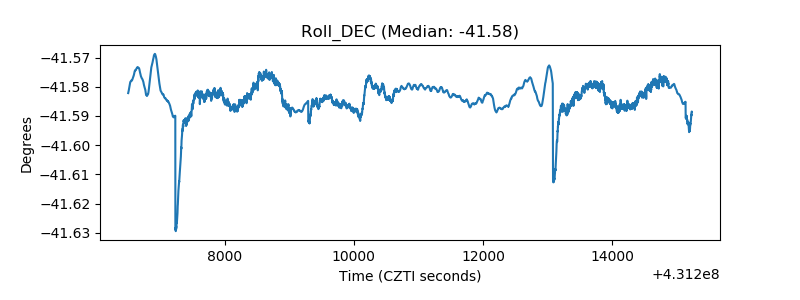 |
| _Roll_RA | 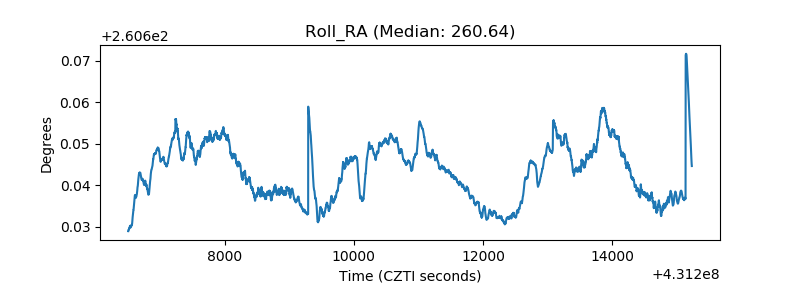 |
| Veto Counter | 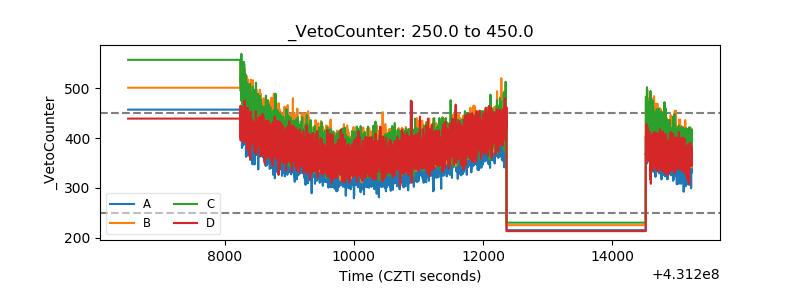 |