| Param | Original file | Final file |
|---|---|---|
| Filename | modeM0/AS1T05_138T01_9000005828_42853cztM0_level2.fits | modeM0/AS1T05_138T01_9000005828_42853cztM0_level2_quad_clean.evt |
| Size (bytes) | 294,986,880 | 82,068,480 |
| Size | 281.3 MB | 78.3 MB |
| Events in quadrant A | 2,687,399 | 547,948 |
| Events in quadrant B | 2,855,255 | 546,524 |
| Events in quadrant C | 2,430,913 | 552,164 |
| Events in quadrant D | 2,562,640 | 493,937 |
| Mode M0 | |||
|---|---|---|---|
| Quadrant | BADHDUFLAG | Total packets | Discarded packets |
| A | 0 | 10962 | 2 |
| B | 0 | 11980 | 6 |
| C | 0 | 10242 | 2 |
| D | 0 | 11221 | 2 |
| Mode M9 | |||
|---|---|---|---|
| Quadrant | BADHDUFLAG | Total packets | Discarded packets |
| A | 0 | 33 | 0 |
| B | 0 | 34 | 0 |
| C | 0 | 34 | 0 |
| D | 0 | 34 | 0 |
| Mode SS | |||
|---|---|---|---|
| Quadrant | BADHDUFLAG | Total packets | Discarded packets |
| A | 0 | 100 | 0 |
| B | 0 | 100 | 0 |
| C | 0 | 100 | 0 |
| D | 0 | 100 | 0 |
| Quadrant | Total seconds | Saturated seconds | Saturation percentage |
|---|---|---|---|
| A | 4913 | 16 | 0.325667% |
| B | 4912 | 224 | 4.560261% |
| C | 4912 | 7 | 0.142508% |
| D | 4912 | 63 | 1.282573% |
Noise dominated data is calculated using 1-second bins in cleaned event files. If a bin has >2000 counts, and if more than 50% of those come from <1% of pixels, then it is considered to be noise-dominated and hence unusable.
| Quadrant | # 1 sec bins | Bins with >0 counts | Bins with >2000 counts | High rate bins dominated by noise | Noise dominated (total time) | Noise dominated (detector-on time) | Marked lightcurve |
|---|---|---|---|---|---|---|---|
| A | 7006 | 4914 | 8 | 8 | 0.11% | 0.16% | 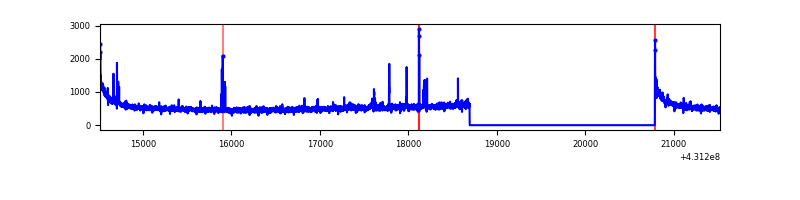 |
| B | 7005 | 4913 | 193 | 193 | 2.76% | 3.93% | 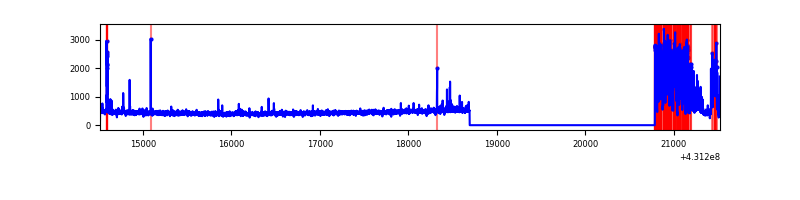 |
| C | 7005 | 4913 | 3 | 3 | 0.04% | 0.06% | 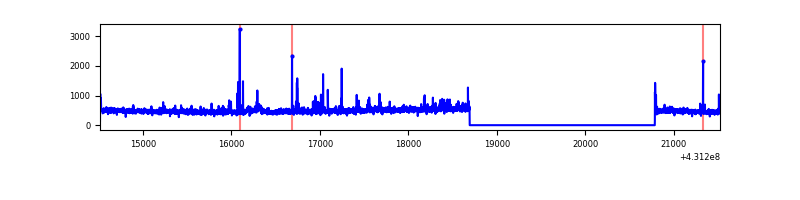 |
| D | 7005 | 4913 | 60 | 60 | 0.86% | 1.22% | 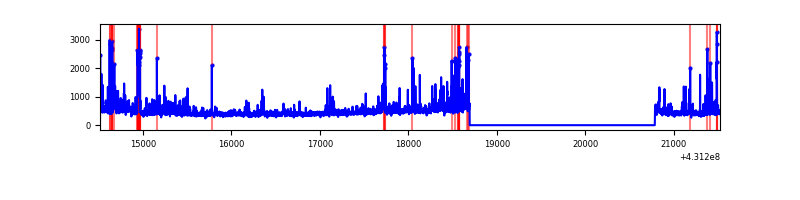 |
Top three noisy pixels from each quadrant. If the there are fewer than three noisy pixels in the level2.evt file, extra rows are filled as -1
| Pixel properties | Quadrant properties | ||||||
|---|---|---|---|---|---|---|---|
| Quadrant | DetID | PixID | Counts | Sigma | Mean | Median | Sigma |
| A | 10 | 83 | 522113 | 4694.96 | 536 | 525 | 111.1 |
| A | 15 | 237 | 36140 | 320.58 | 536 | 525 | 111.1 |
| A | 12 | 189 | 32173 | 284.87 | 536 | 525 | 111.1 |
| B | 4 | 81 | 689881 | 6713.4 | 529 | 514 | 102.7 |
| B | 5 | 255 | 40215 | 386.63 | 529 | 514 | 102.7 |
| B | 4 | 171 | 15702 | 147.91 | 529 | 514 | 102.7 |
| C | 15 | 214 | 200281 | 1601.93 | 529 | 533 | 124.7 |
| C | 14 | 254 | 66394 | 528.19 | 529 | 533 | 124.7 |
| C | 0 | 239 | 46496 | 368.61 | 529 | 533 | 124.7 |
| D | 1 | 52 | 288935 | 2247.57 | 520 | 505 | 128.3 |
| D | 2 | 249 | 140046 | 1087.36 | 520 | 505 | 128.3 |
| D | 12 | 233 | 32712 | 250.97 | 520 | 505 | 128.3 |
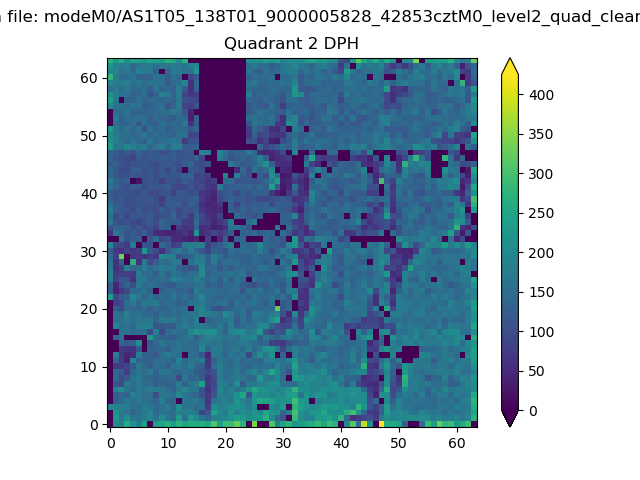
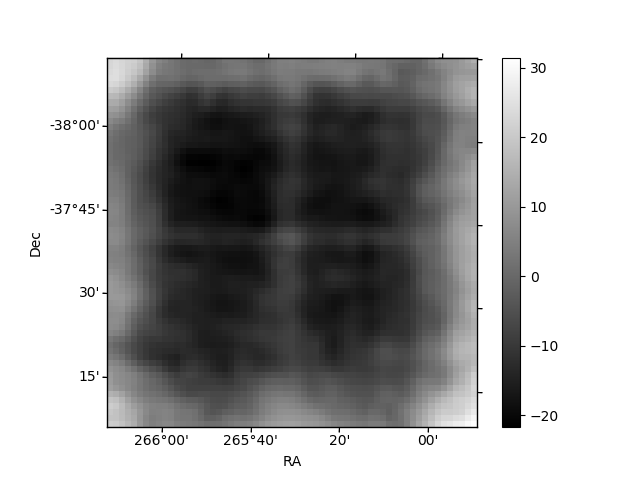
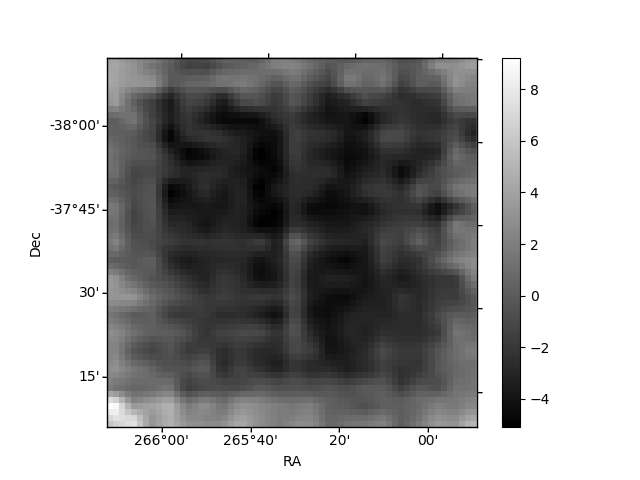
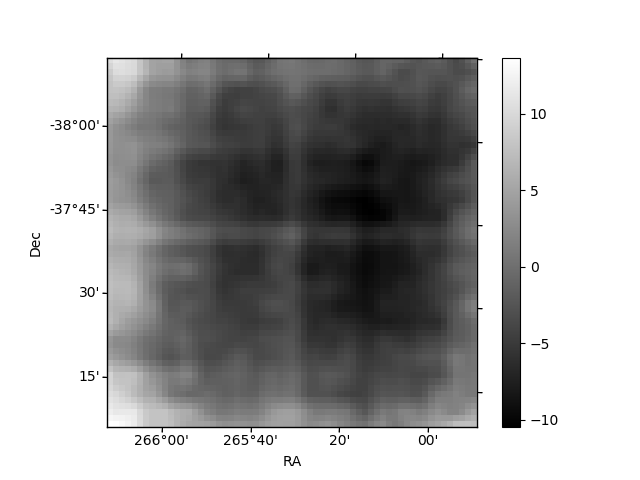
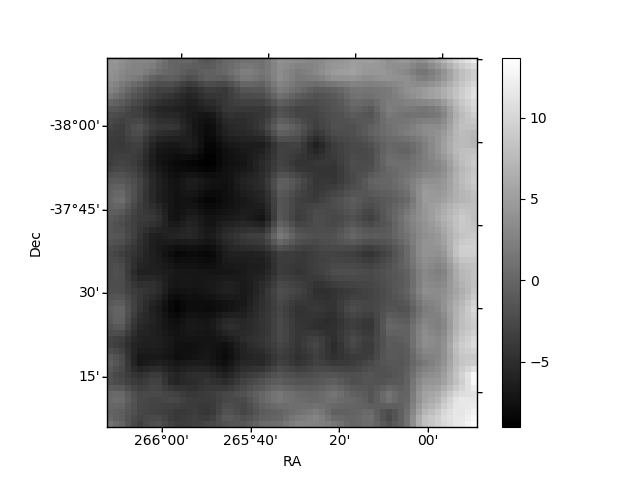
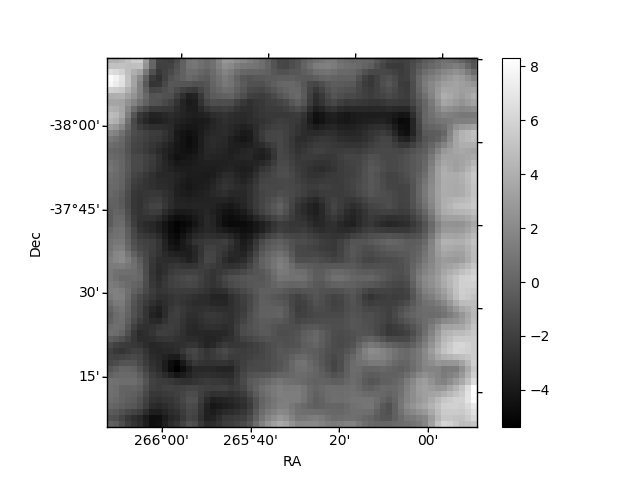
Histogram calculated using DETX and DETY for each event in the final _common_clean file
| Quadrant A | 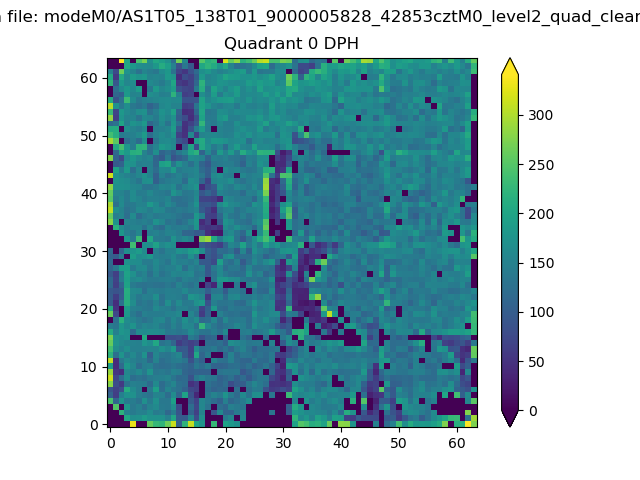 |
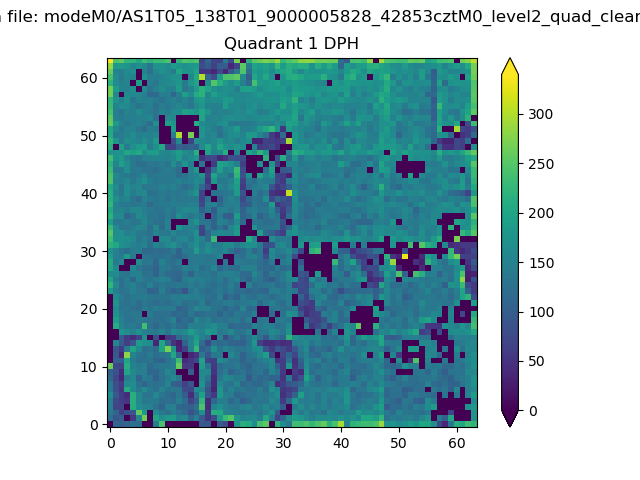 |
Quadrant B |
|---|---|---|---|
| Quadrant D | 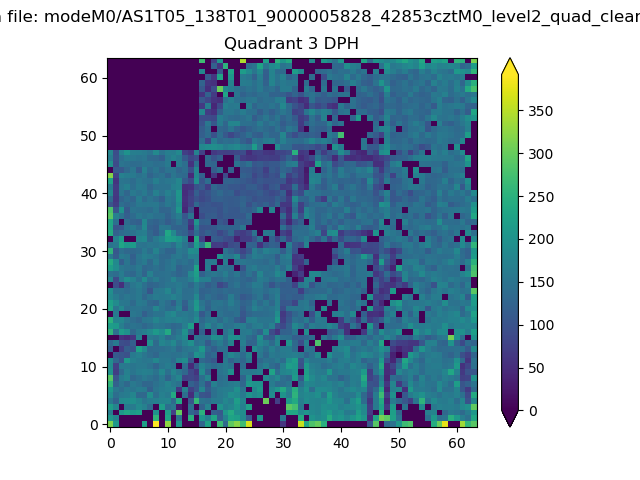 |
 |
Quadrant C |
| Plot type | Count rate plots | Images |
|---|---|---|
| Comparison with Poisson distribution Blue bars denote a histogram of data divided into 1 sec bins. Red curve is a Poisson curve with rate = median count rate of data. |
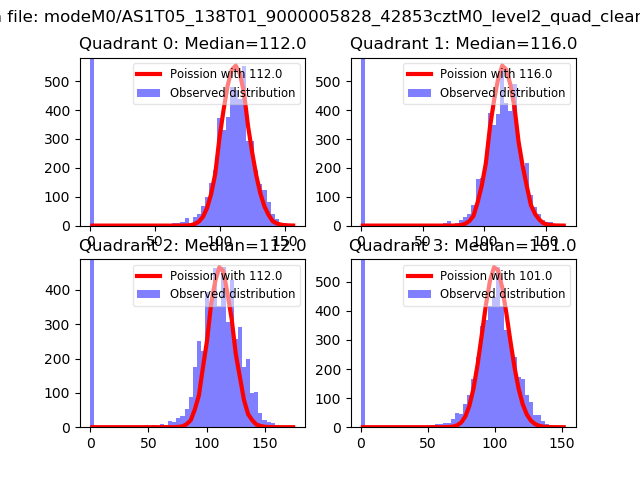 |
 |
| Quadrant-wise count rates Data is divided into 100 sec bins |
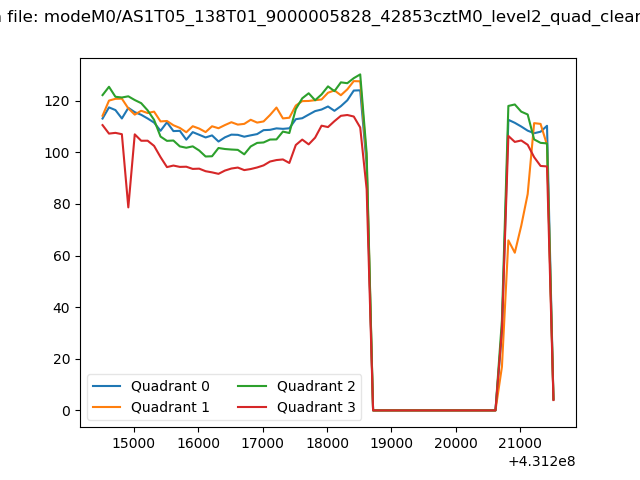 |
|
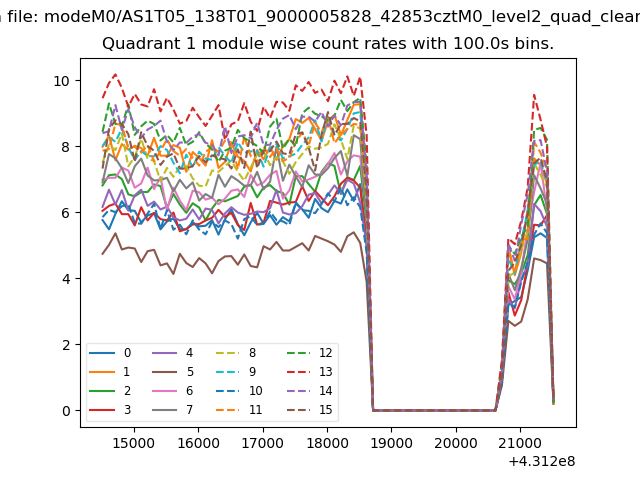
| Module-wise count rates for Quadrant A Data is divided into 100 sec bins |
 |
 |
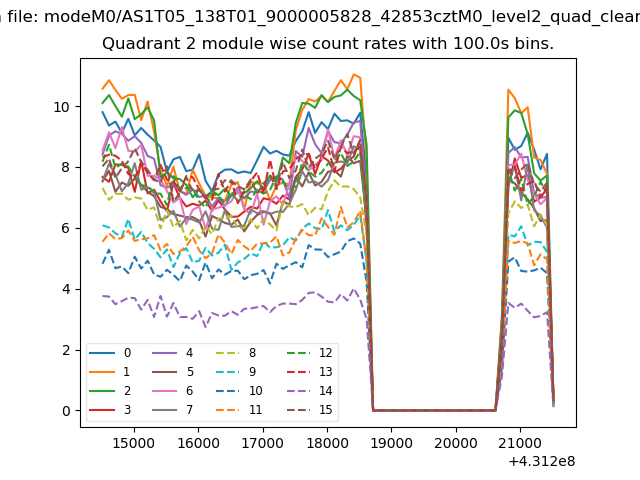
| Module-wise count rates for Quadrant B Data is divided into 100 sec bins |
 |
 |
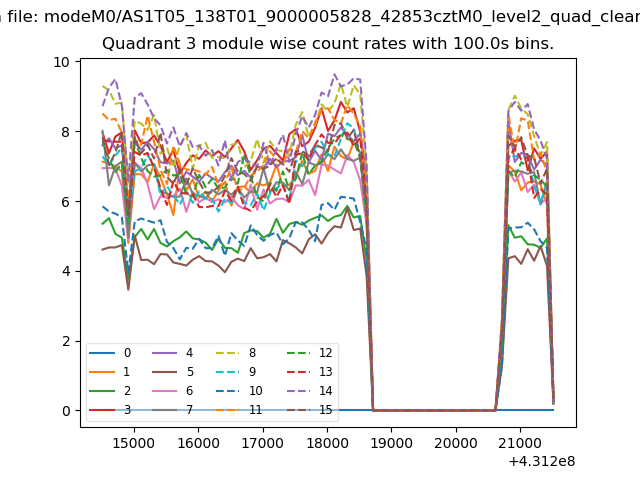
| Module-wise count rates for Quadrant C Data is divided into 100 sec bins |
 |
 |
| Module-wise count rates for Quadrant D Data is divided into 100 sec bins |
 |
 |
| Parameter | Plot |
|---|---|
| CZT HV Monitor | 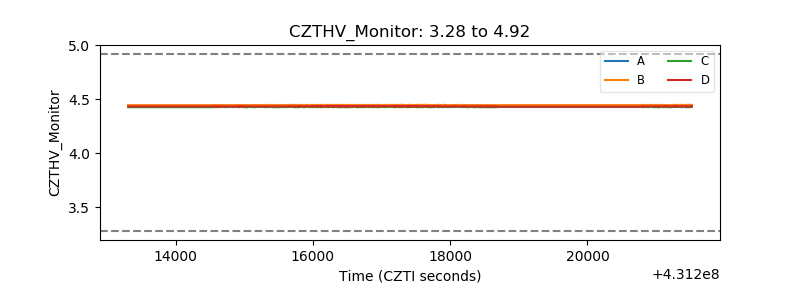 |
| D_VDD | 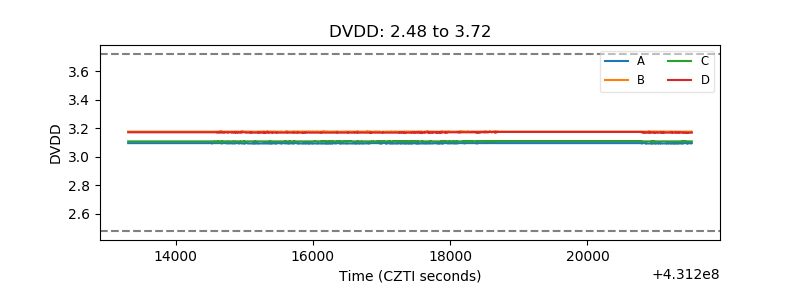 |
| Temperature 1 | 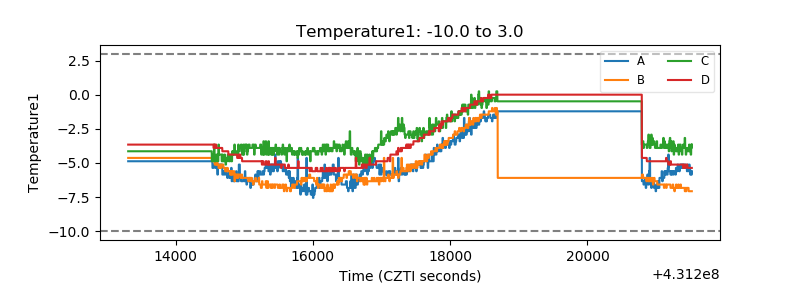 |
| Veto HV Monitor | 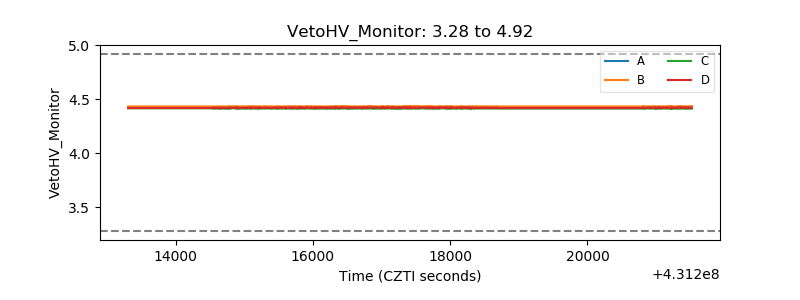 |
| Veto LLD | 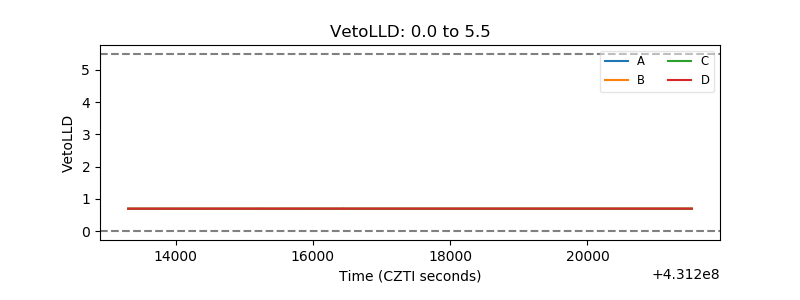 |
| Alpha Counter | 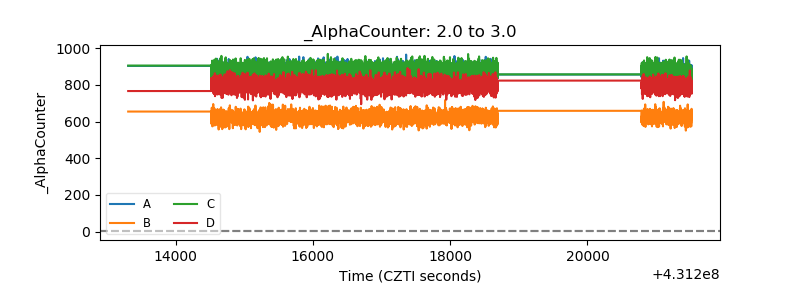 |
| _CPM_Rate | 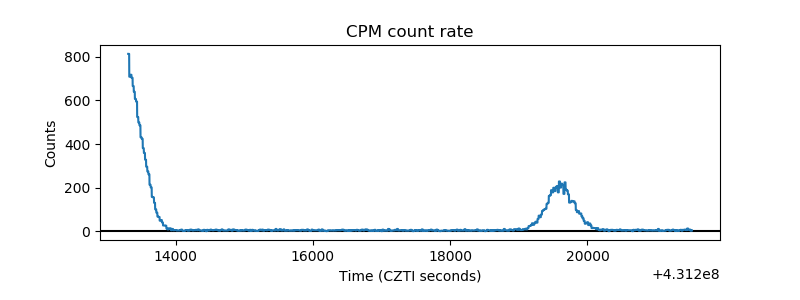 |
| CZT Counter | 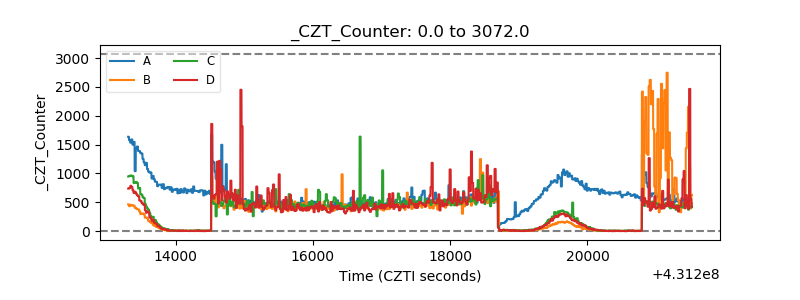 |
| +2.5 Volts monitor | 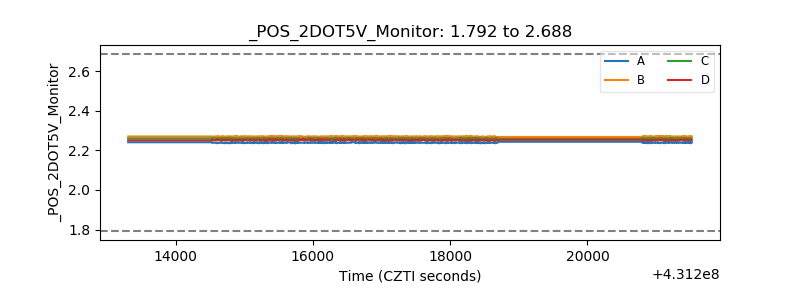 |
| +5 Volts monitor |  |
| _ROLL_ROT | 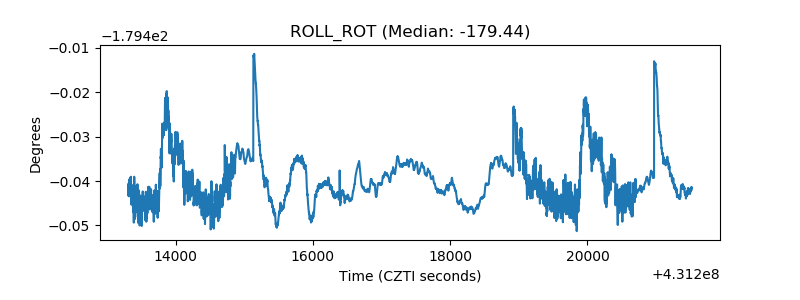 |
| _Roll_DEC | 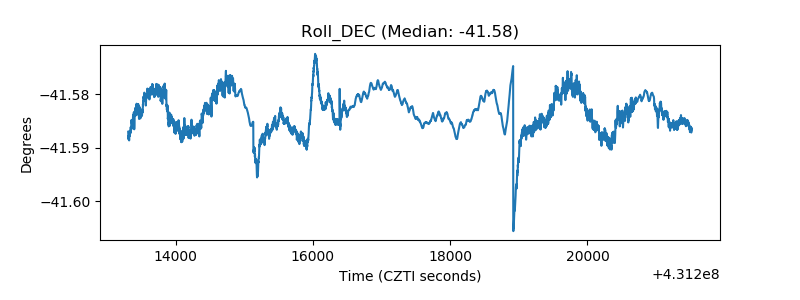 |
| _Roll_RA | 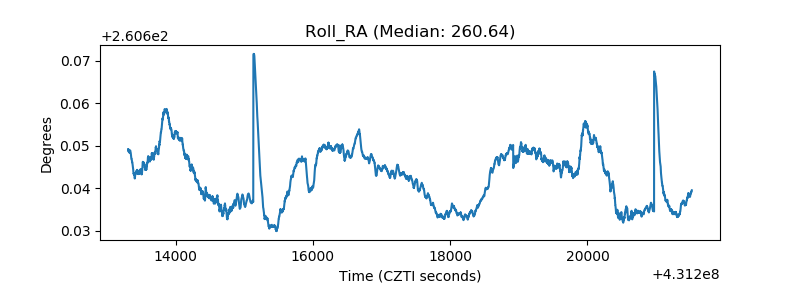 |
| Veto Counter | 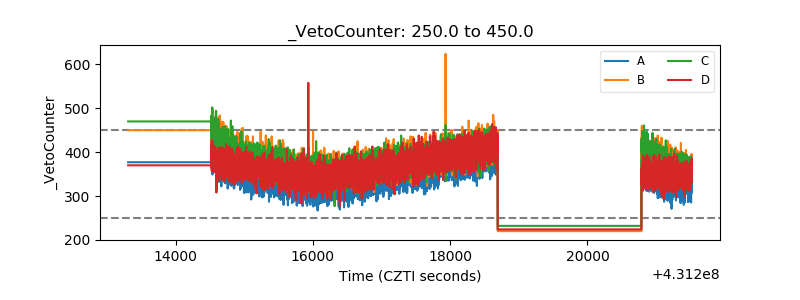 |