| Param | Original file | Final file |
|---|---|---|
| Filename | modeM0/AS1T05_138T01_9000005828_42854cztM0_level2.fits | modeM0/AS1T05_138T01_9000005828_42854cztM0_level2_quad_clean.evt |
| Size (bytes) | 400,190,400 | 82,592,640 |
| Size | 381.7 MB | 78.8 MB |
| Events in quadrant A | 2,866,203 | 568,317 |
| Events in quadrant B | 5,288,789 | 498,523 |
| Events in quadrant C | 3,064,884 | 557,298 |
| Events in quadrant D | 3,188,592 | 511,954 |
| Mode M0 | |||
|---|---|---|---|
| Quadrant | BADHDUFLAG | Total packets | Discarded packets |
| A | 0 | 11729 | 2 |
| B | 0 | 19347 | 2 |
| C | 0 | 12372 | 2 |
| D | 0 | 13026 | 2 |
| Mode M9 | |||
|---|---|---|---|
| Quadrant | BADHDUFLAG | Total packets | Discarded packets |
| A | 0 | 36 | 0 |
| B | 0 | 37 | 0 |
| C | 0 | 37 | 0 |
| D | 0 | 37 | 0 |
| Mode SS | |||
|---|---|---|---|
| Quadrant | BADHDUFLAG | Total packets | Discarded packets |
| A | 0 | 106 | 0 |
| B | 0 | 106 | 0 |
| C | 0 | 106 | 0 |
| D | 0 | 106 | 0 |
| Quadrant | Total seconds | Saturated seconds | Saturation percentage |
|---|---|---|---|
| A | 5207 | 18 | 0.345688% |
| B | 5207 | 916 | 17.591703% |
| C | 5207 | 156 | 2.995967% |
| D | 5207 | 77 | 1.478779% |
Noise dominated data is calculated using 1-second bins in cleaned event files. If a bin has >2000 counts, and if more than 50% of those come from <1% of pixels, then it is considered to be noise-dominated and hence unusable.
| Quadrant | # 1 sec bins | Bins with >0 counts | Bins with >2000 counts | High rate bins dominated by noise | Noise dominated (total time) | Noise dominated (detector-on time) | Marked lightcurve |
|---|---|---|---|---|---|---|---|
| A | 7030 | 5208 | 10 | 10 | 0.14% | 0.19% | 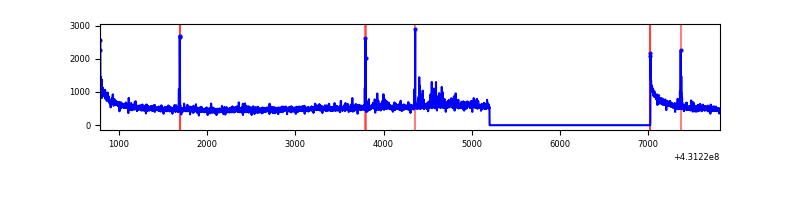 |
| B | 7030 | 5208 | 801 | 801 | 11.39% | 15.38% | 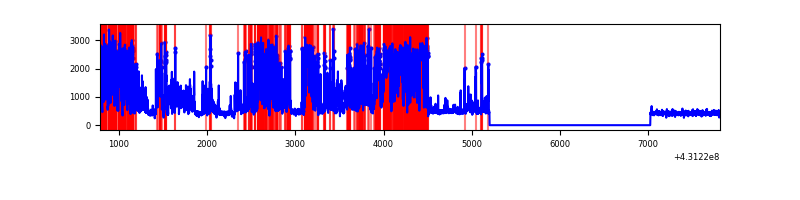 |
| C | 7030 | 5208 | 158 | 158 | 2.25% | 3.03% | 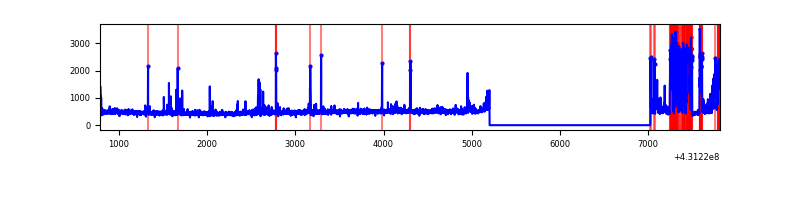 |
| D | 7030 | 5208 | 74 | 74 | 1.05% | 1.42% | 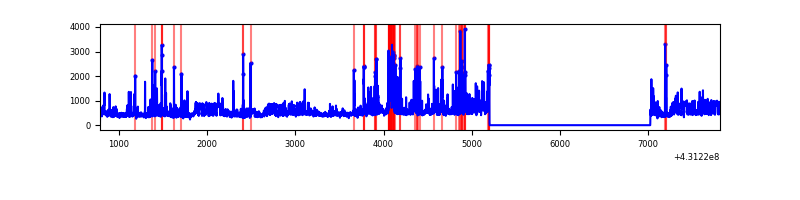 |
Top three noisy pixels from each quadrant. If the there are fewer than three noisy pixels in the level2.evt file, extra rows are filled as -1
| Pixel properties | Quadrant properties | ||||||
|---|---|---|---|---|---|---|---|
| Quadrant | DetID | PixID | Counts | Sigma | Mean | Median | Sigma |
| A | 10 | 83 | 556628 | 4740.19 | 565 | 553 | 117.3 |
| A | 12 | 189 | 65524 | 553.84 | 565 | 553 | 117.3 |
| A | 15 | 237 | 31518 | 263.96 | 565 | 553 | 117.3 |
| B | 4 | 81 | 3110711 | 29975.94 | 530 | 515 | 103.8 |
| B | 5 | 255 | 37807 | 359.42 | 530 | 515 | 103.8 |
| B | 4 | 171 | 20713 | 194.67 | 530 | 515 | 103.8 |
| C | 12 | 2 | 539916 | 4176.78 | 551 | 556 | 129.1 |
| C | 15 | 214 | 208908 | 1613.47 | 551 | 556 | 129.1 |
| C | 14 | 254 | 119244 | 919.11 | 551 | 556 | 129.1 |
| D | 12 | 6 | 444651 | 3278.68 | 548 | 533 | 135.5 |
| D | 1 | 52 | 203987 | 1501.99 | 548 | 533 | 135.5 |
| D | 2 | 249 | 115065 | 845.53 | 548 | 533 | 135.5 |
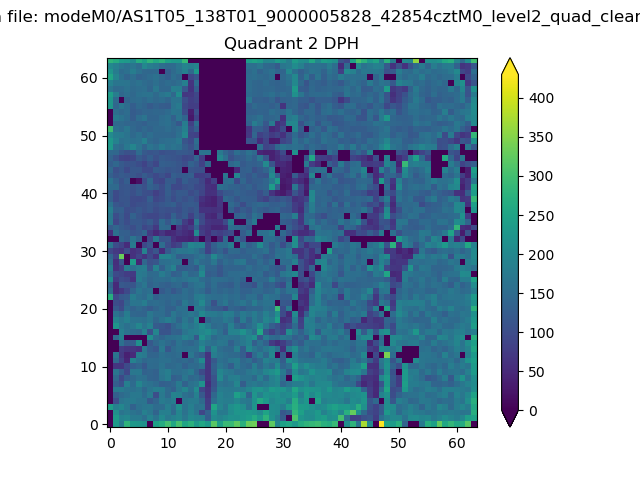
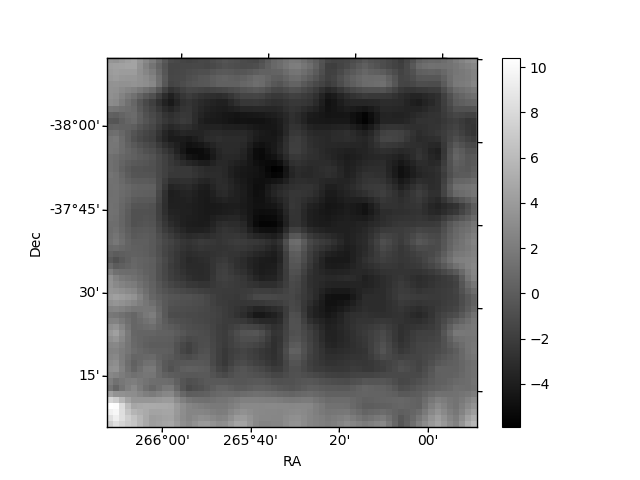
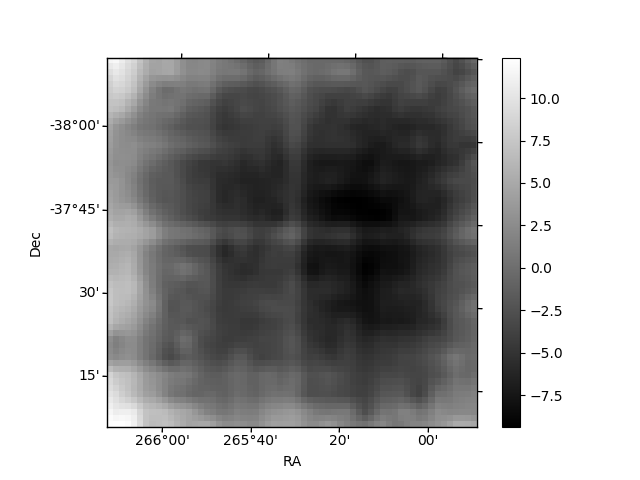
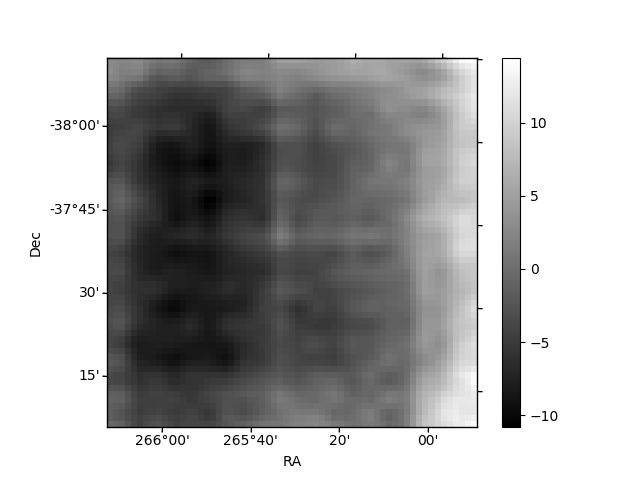
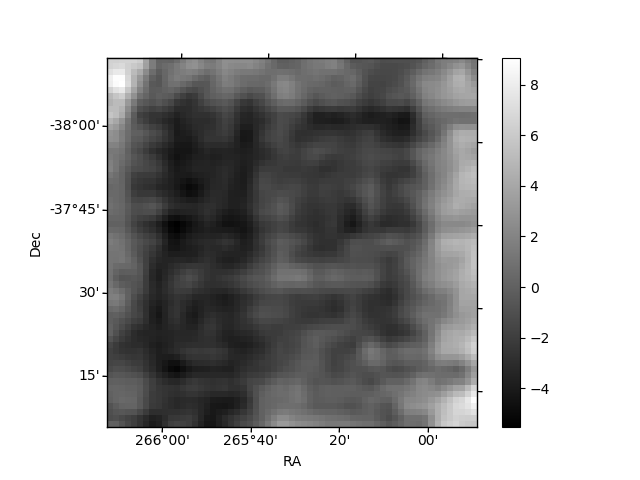
Histogram calculated using DETX and DETY for each event in the final _common_clean file
| Quadrant A | 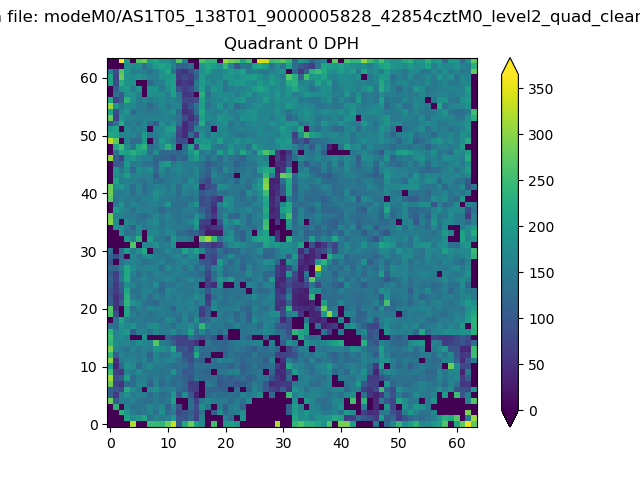 |
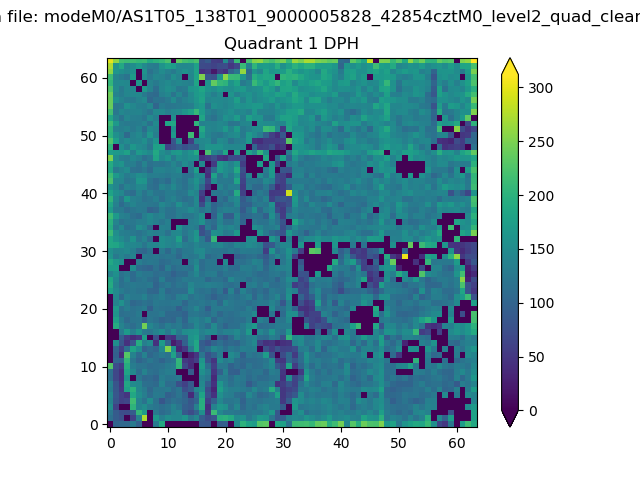 |
Quadrant B |
|---|---|---|---|
| Quadrant D | 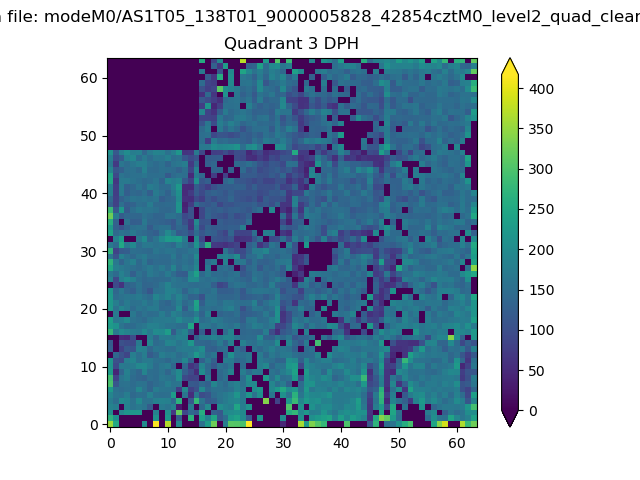 |
 |
Quadrant C |
| Plot type | Count rate plots | Images |
|---|---|---|
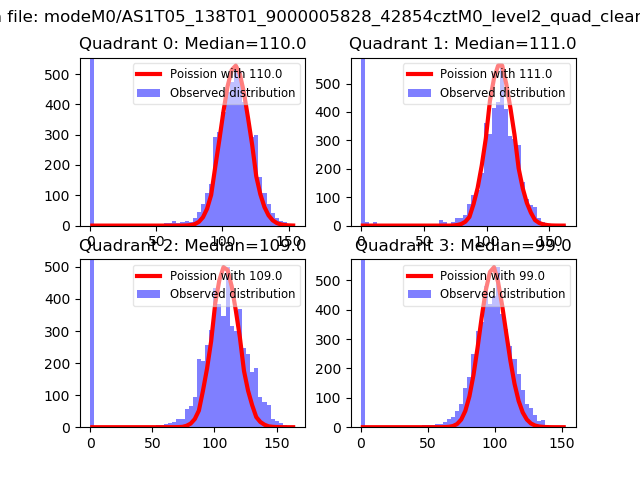
| Comparison with Poisson distribution Blue bars denote a histogram of data divided into 1 sec bins. Red curve is a Poisson curve with rate = median count rate of data. |
 |
 |
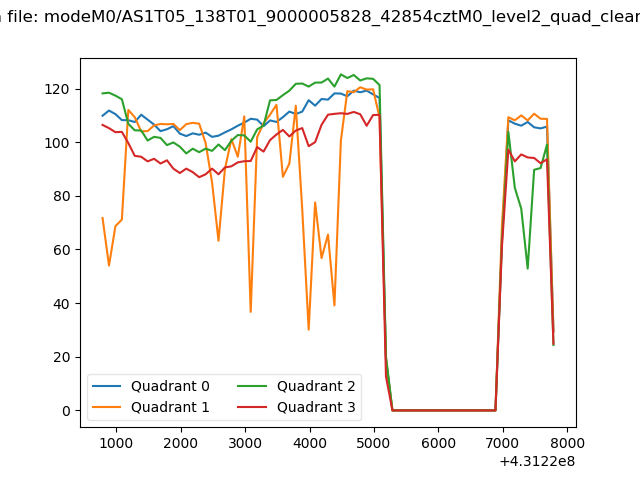
| Quadrant-wise count rates Data is divided into 100 sec bins |
 |
|
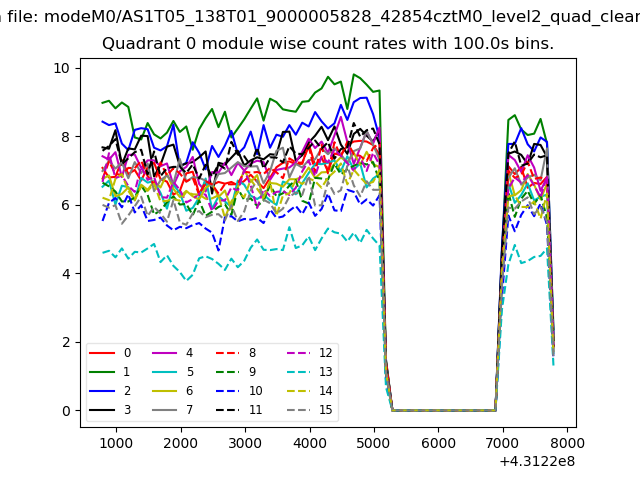
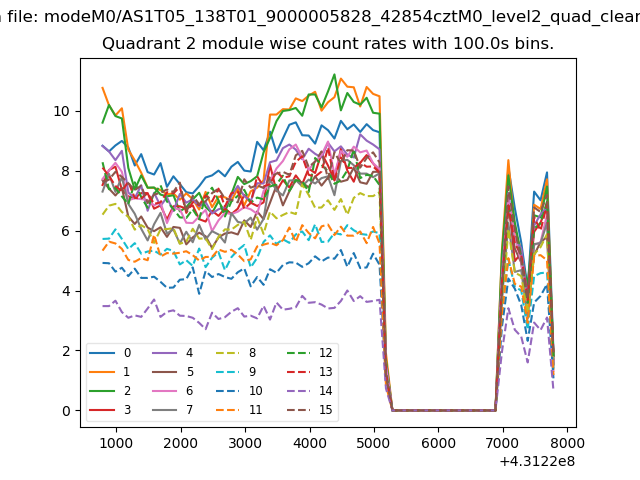
| Module-wise count rates for Quadrant A Data is divided into 100 sec bins |
 |
 |
| Module-wise count rates for Quadrant B Data is divided into 100 sec bins |
 |
 |
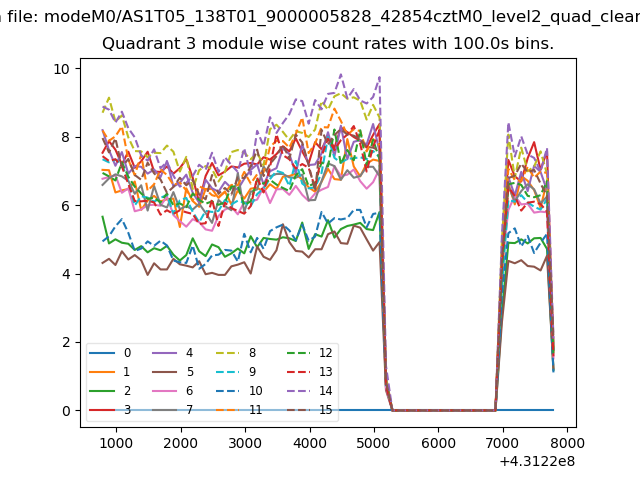
| Module-wise count rates for Quadrant C Data is divided into 100 sec bins |
 |
 |
| Module-wise count rates for Quadrant D Data is divided into 100 sec bins |
 |
 |
| Parameter | Plot |
|---|---|
| CZT HV Monitor | 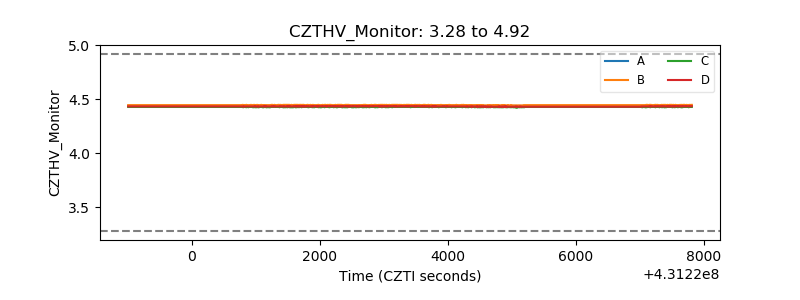 |
| D_VDD | 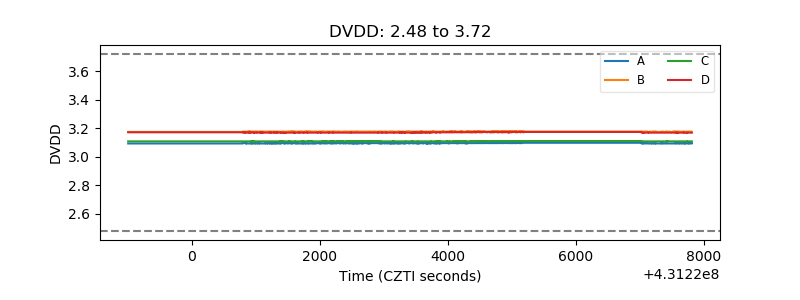 |
| Temperature 1 | 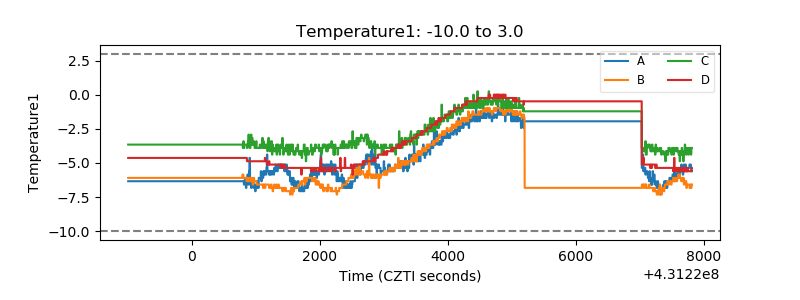 |
| Veto HV Monitor | 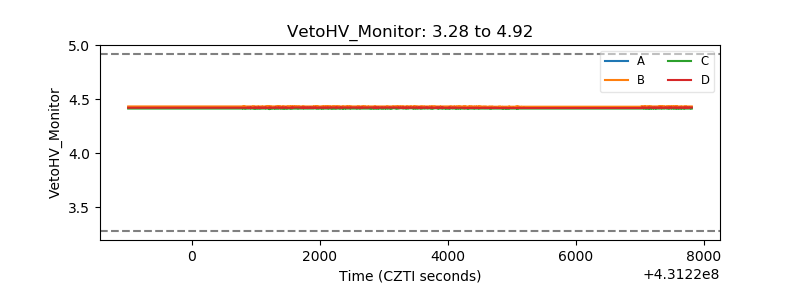 |
| Veto LLD | 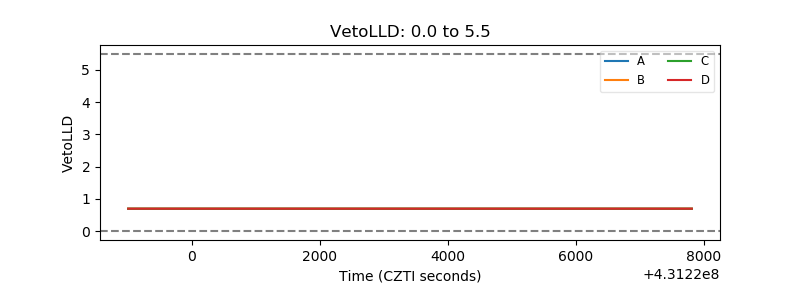 |
| Alpha Counter | 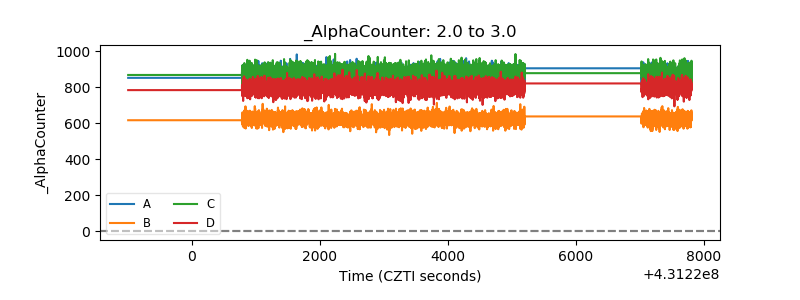 |
| _CPM_Rate | 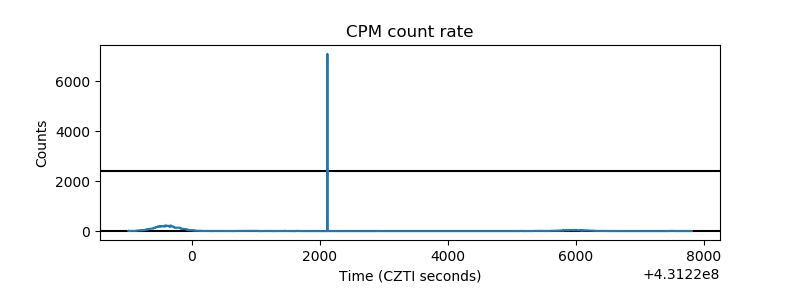 |
| CZT Counter | 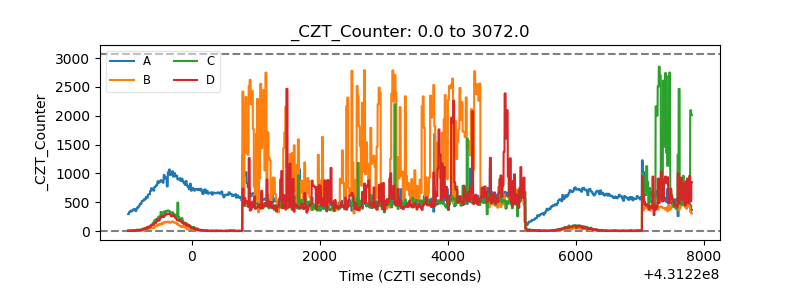 |
| +2.5 Volts monitor |  |
| +5 Volts monitor | 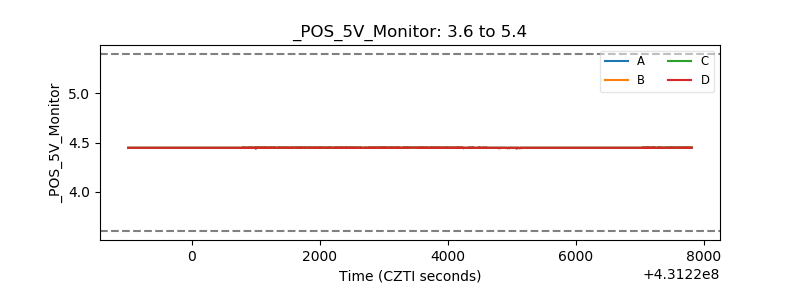 |
| _ROLL_ROT | 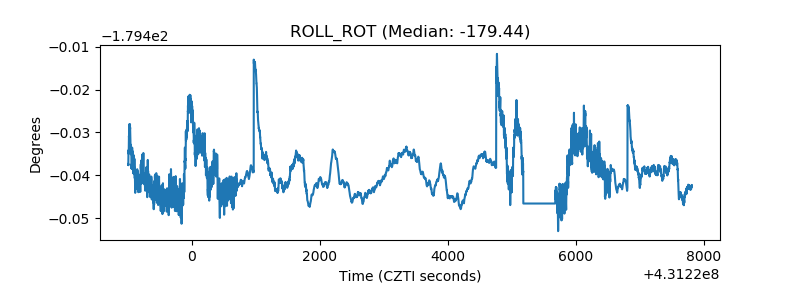 |
| _Roll_DEC | 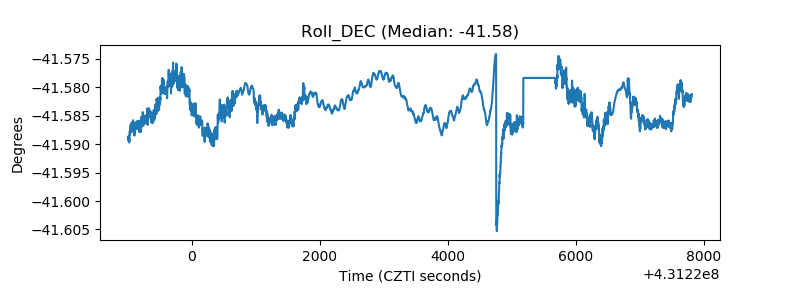 |
| _Roll_RA | 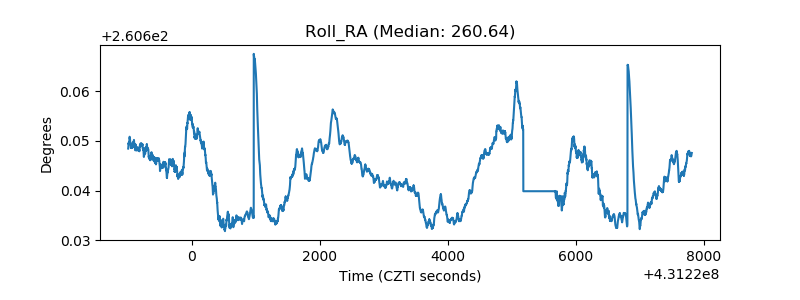 |
| Veto Counter | 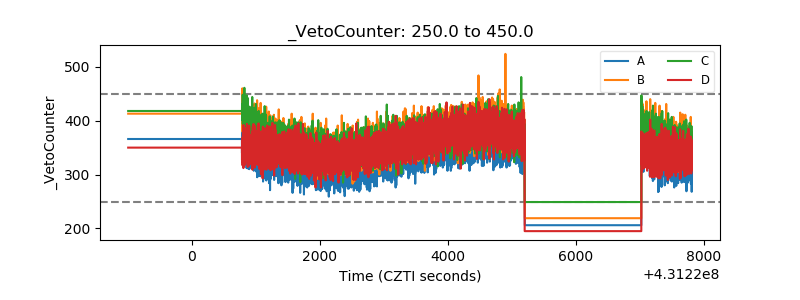 |