| Param | Original file | Final file |
|---|---|---|
| Filename | modeM0/AS1T05_138T01_9000005828_42855cztM0_level2.fits | modeM0/AS1T05_138T01_9000005828_42855cztM0_level2_quad_clean.evt |
| Size (bytes) | 374,788,800 | 92,234,880 |
| Size | 357.4 MB | 88.0 MB |
| Events in quadrant A | 3,193,826 | 620,318 |
| Events in quadrant B | 2,577,765 | 642,194 |
| Events in quadrant C | 3,596,372 | 604,930 |
| Events in quadrant D | 4,055,405 | 521,584 |
| Mode M0 | |||
|---|---|---|---|
| Quadrant | BADHDUFLAG | Total packets | Discarded packets |
| A | 0 | 12961 | 2 |
| B | 0 | 11865 | 2 |
| C | 0 | 14345 | 3 |
| D | 0 | 15958 | 2 |
| Mode M9 | |||
|---|---|---|---|
| Quadrant | BADHDUFLAG | Total packets | Discarded packets |
| A | 0 | 28 | 0 |
| B | 0 | 29 | 0 |
| C | 0 | 29 | 0 |
| D | 0 | 29 | 0 |
| Mode SS | |||
|---|---|---|---|
| Quadrant | BADHDUFLAG | Total packets | Discarded packets |
| A | 0 | 116 | 0 |
| B | 0 | 116 | 0 |
| C | 0 | 116 | 0 |
| D | 0 | 116 | 0 |
| Quadrant | Total seconds | Saturated seconds | Saturation percentage |
|---|---|---|---|
| A | 5782 | 27 | 0.466966% |
| B | 5782 | 10 | 0.172951% |
| C | 5781 | 197 | 3.407715% |
| D | 5781 | 422 | 7.299775% |
Noise dominated data is calculated using 1-second bins in cleaned event files. If a bin has >2000 counts, and if more than 50% of those come from <1% of pixels, then it is considered to be noise-dominated and hence unusable.
| Quadrant | # 1 sec bins | Bins with >0 counts | Bins with >2000 counts | High rate bins dominated by noise | Noise dominated (total time) | Noise dominated (detector-on time) | Marked lightcurve |
|---|---|---|---|---|---|---|---|
| A | 7274 | 5783 | 21 | 21 | 0.29% | 0.36% | 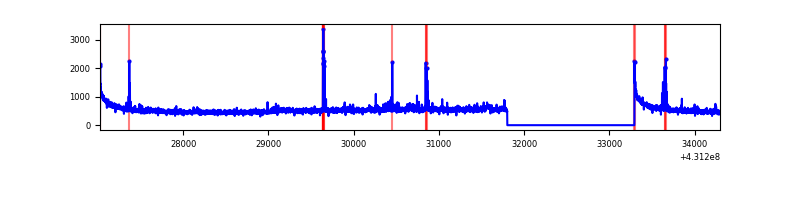 |
| B | 7274 | 5783 | 2 | 2 | 0.03% | 0.03% | 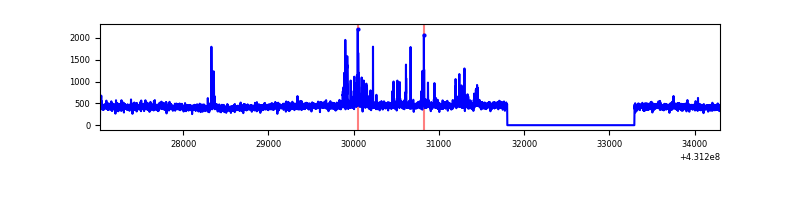 |
| C | 7273 | 5782 | 190 | 190 | 2.61% | 3.29% | 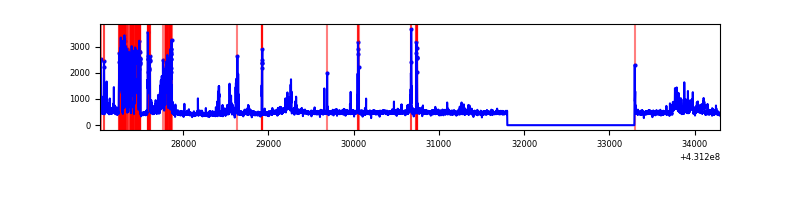 |
| D | 7273 | 5782 | 388 | 388 | 5.33% | 6.71% | 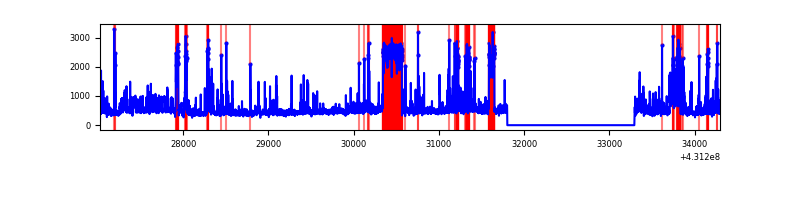 |
Top three noisy pixels from each quadrant. If the there are fewer than three noisy pixels in the level2.evt file, extra rows are filled as -1
| Pixel properties | Quadrant properties | ||||||
|---|---|---|---|---|---|---|---|
| Quadrant | DetID | PixID | Counts | Sigma | Mean | Median | Sigma |
| A | 10 | 83 | 614825 | 4700.78 | 624 | 611 | 130.7 |
| A | 12 | 189 | 66624 | 505.22 | 624 | 611 | 130.7 |
| A | 15 | 237 | 58162 | 440.46 | 624 | 611 | 130.7 |
| B | 4 | 171 | 78858 | 644.54 | 624 | 605 | 121.4 |
| B | 5 | 255 | 17138 | 136.17 | 624 | 605 | 121.4 |
| B | 12 | 111 | 15452 | 122.29 | 624 | 605 | 121.4 |
| C | 12 | 2 | 820920 | 5749.97 | 608 | 611 | 142.7 |
| C | 15 | 214 | 234367 | 1638.52 | 608 | 611 | 142.7 |
| C | 14 | 254 | 104437 | 727.77 | 608 | 611 | 142.7 |
| D | 2 | 249 | 709498 | 4935.17 | 583 | 566 | 143.6 |
| D | 12 | 6 | 532760 | 3704.83 | 583 | 566 | 143.6 |
| D | 10 | 118 | 265743 | 1846.01 | 583 | 566 | 143.6 |
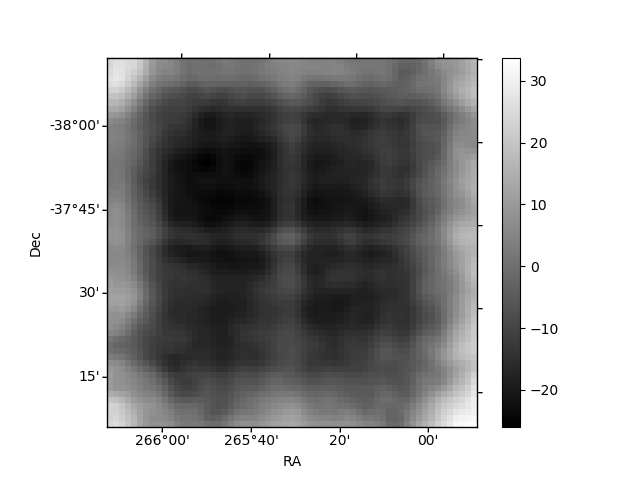
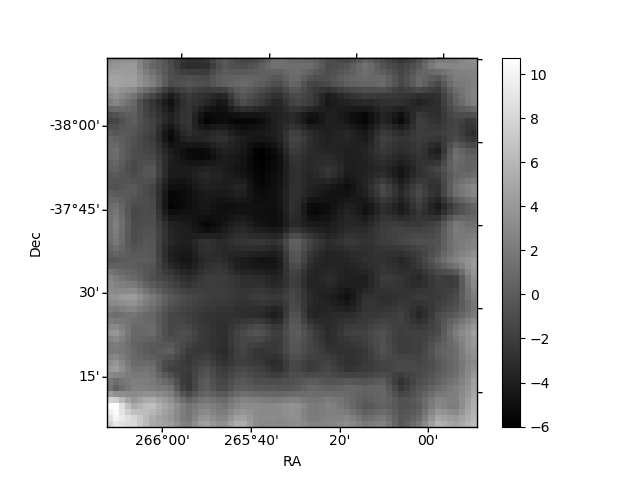
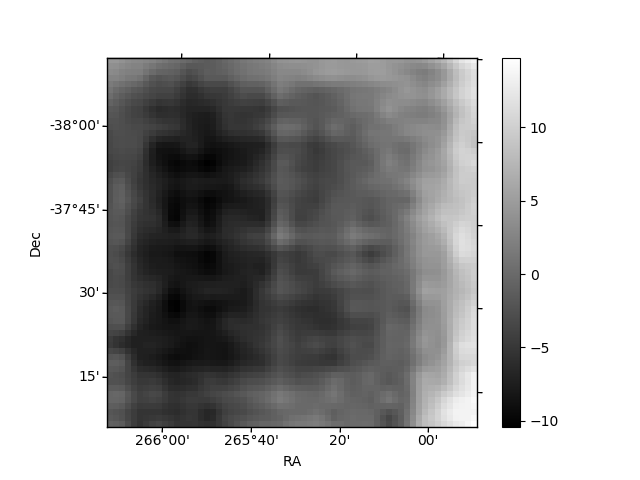
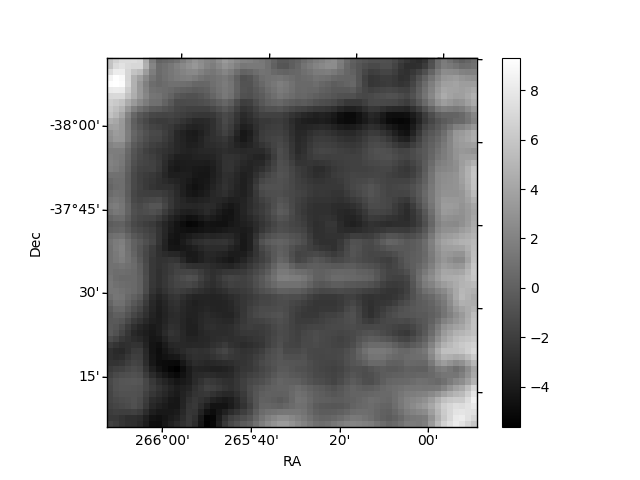
Histogram calculated using DETX and DETY for each event in the final _common_clean file
| Quadrant A | 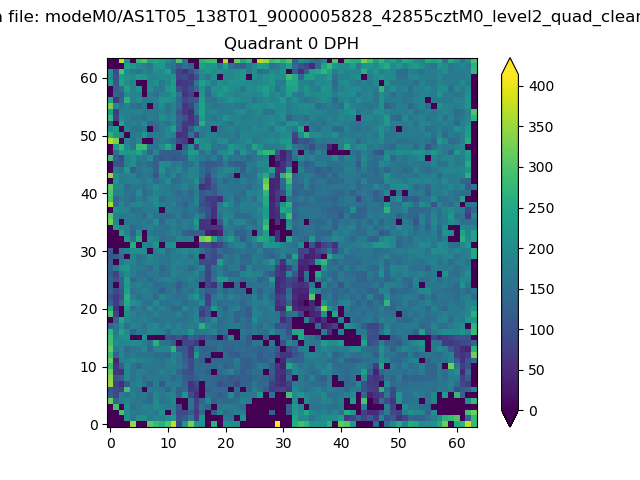 |
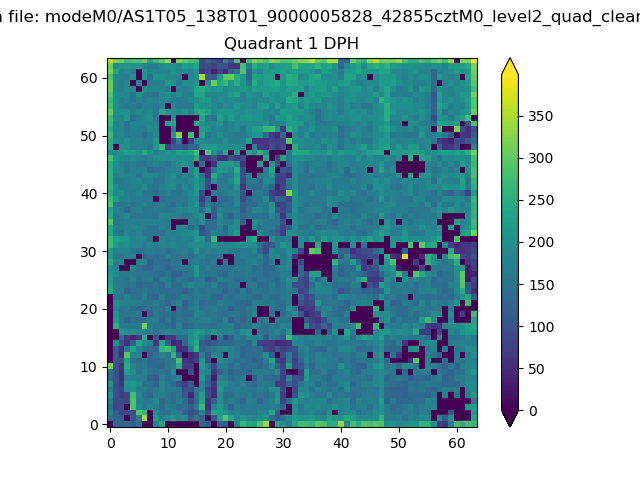 |
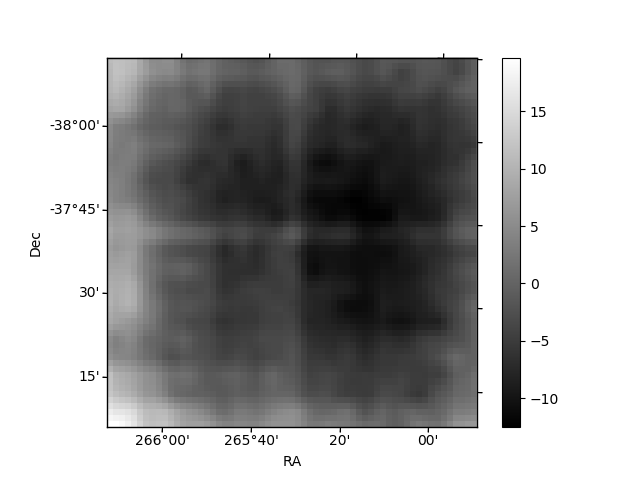
Quadrant B |
|---|---|---|---|
| Quadrant D | 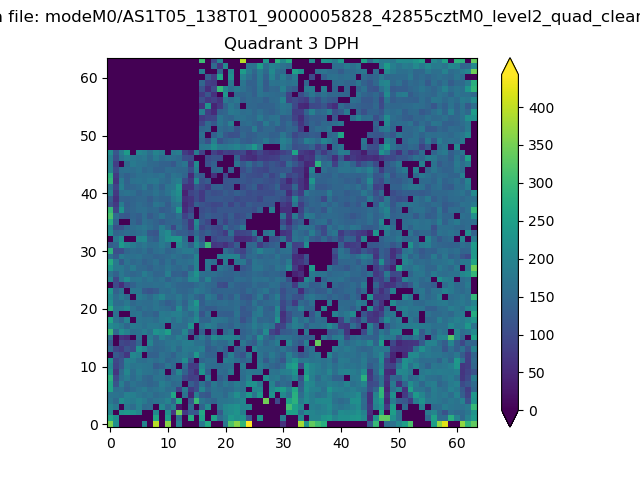 |
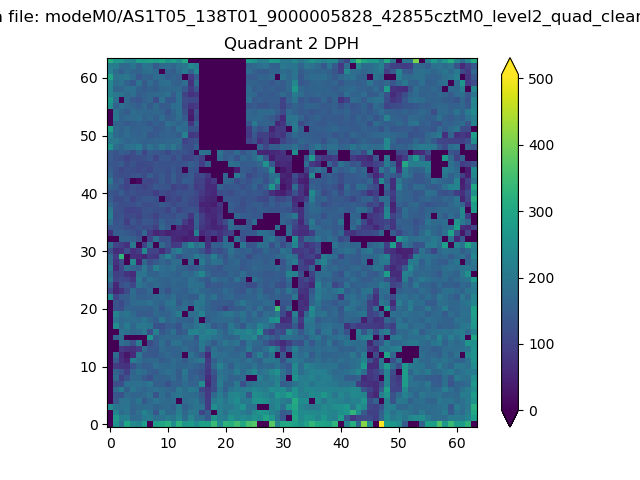 |
Quadrant C |
| Plot type | Count rate plots | Images |
|---|---|---|
| Comparison with Poisson distribution Blue bars denote a histogram of data divided into 1 sec bins. Red curve is a Poisson curve with rate = median count rate of data. |
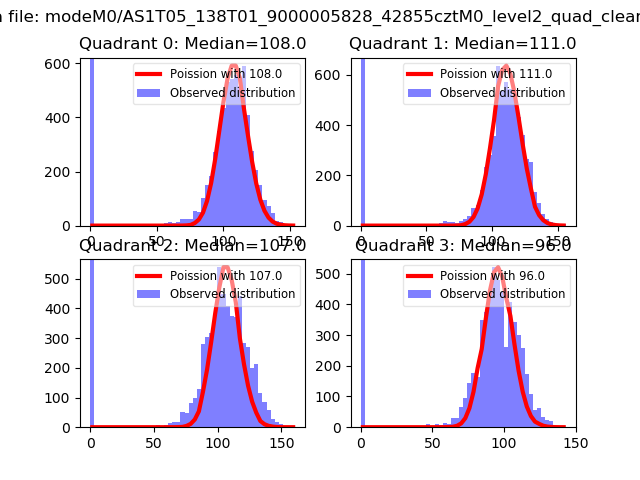 |
 |
| Quadrant-wise count rates Data is divided into 100 sec bins |
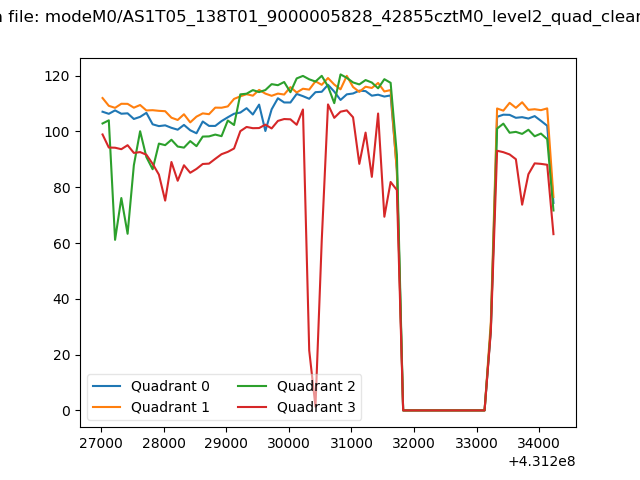 |
|
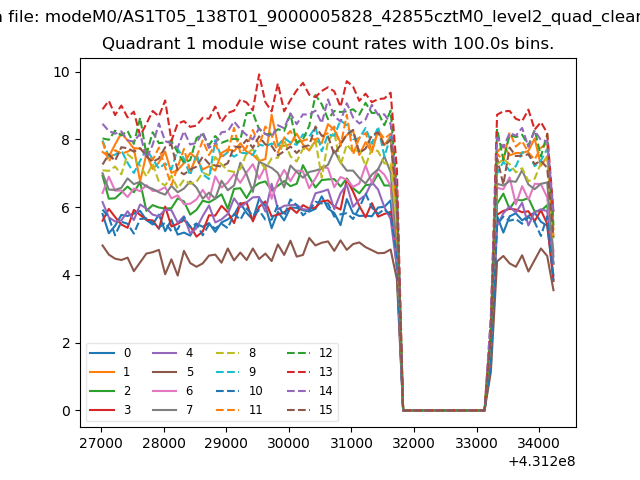
| Module-wise count rates for Quadrant A Data is divided into 100 sec bins |
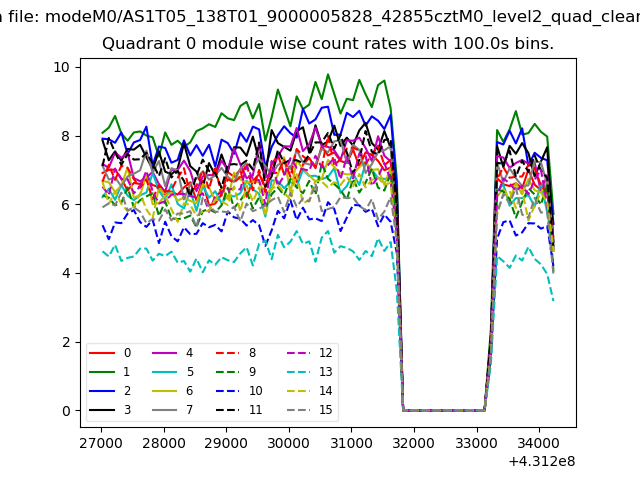 |
 |
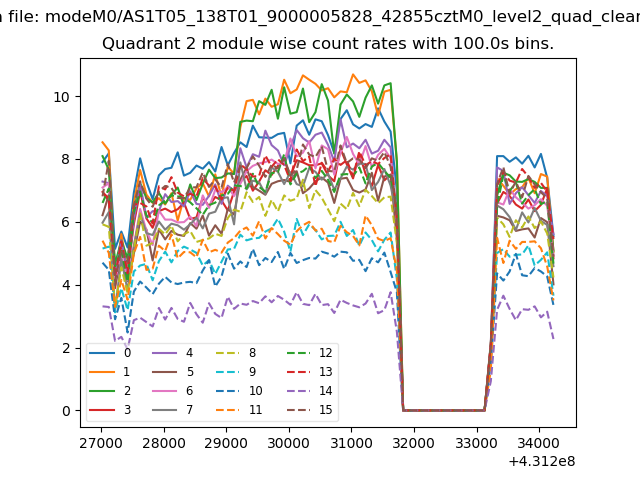
| Module-wise count rates for Quadrant B Data is divided into 100 sec bins |
 |
 |
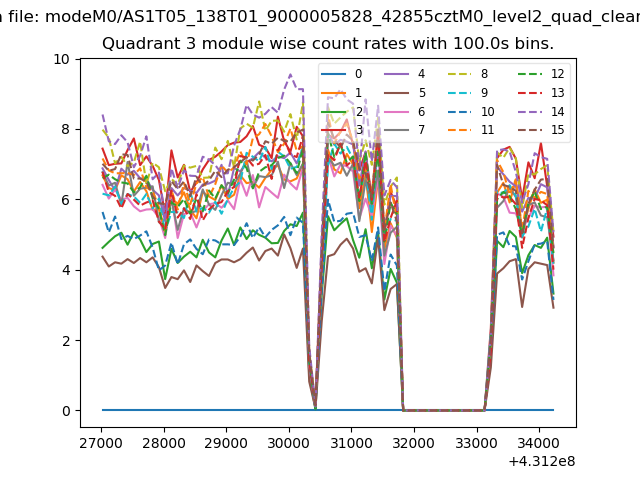
| Module-wise count rates for Quadrant C Data is divided into 100 sec bins |
 |
 |
| Module-wise count rates for Quadrant D Data is divided into 100 sec bins |
 |
 |
| Parameter | Plot |
|---|---|
| CZT HV Monitor | 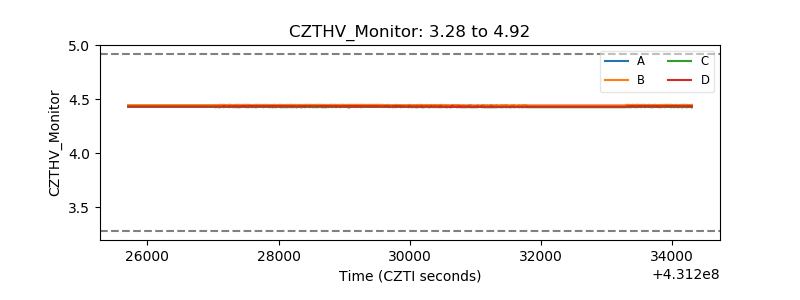 |
| D_VDD | 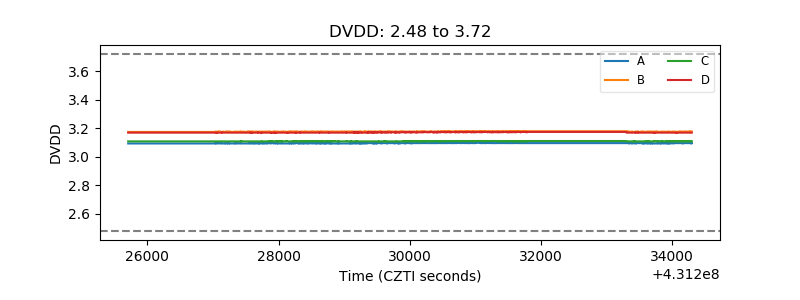 |
| Temperature 1 | 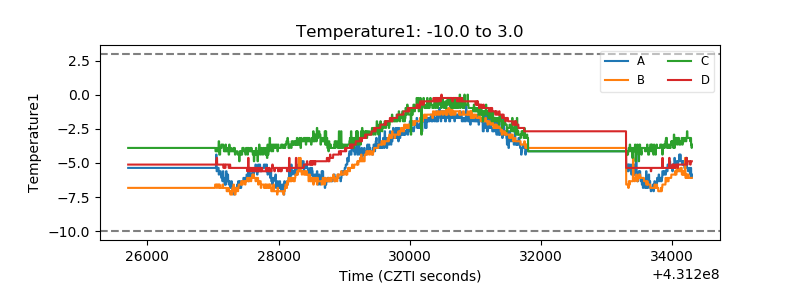 |
| Veto HV Monitor | 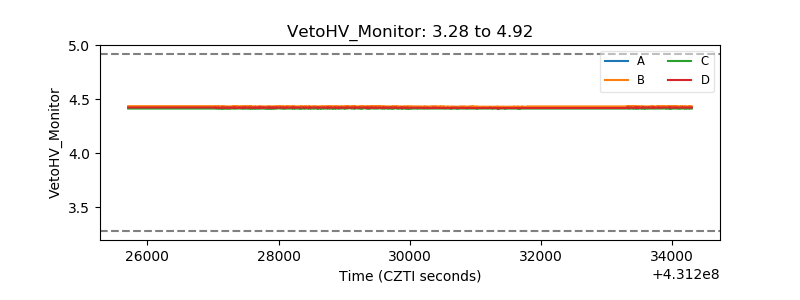 |
| Veto LLD | 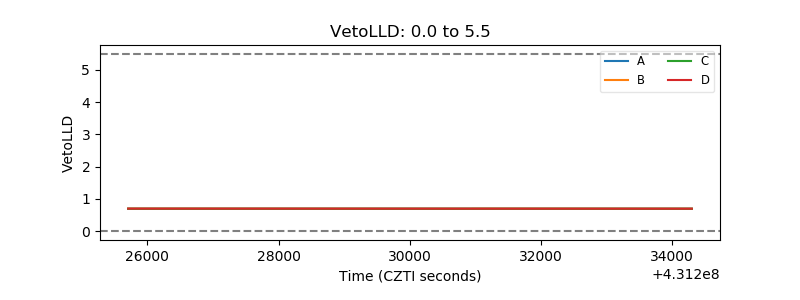 |
| Alpha Counter | 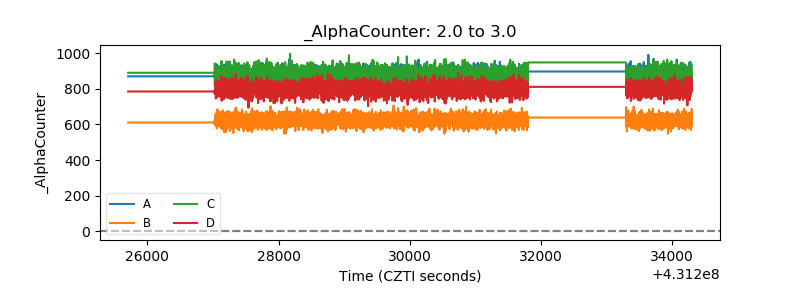 |
| _CPM_Rate | 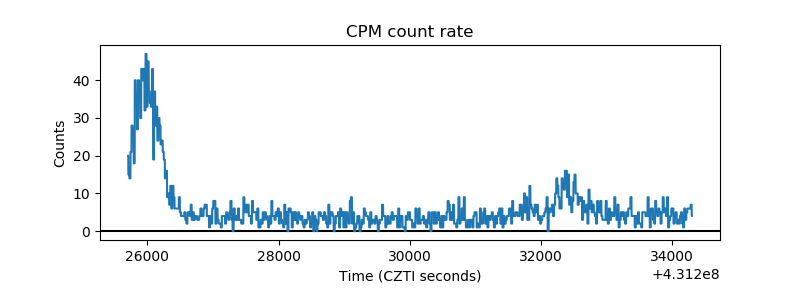 |
| CZT Counter | 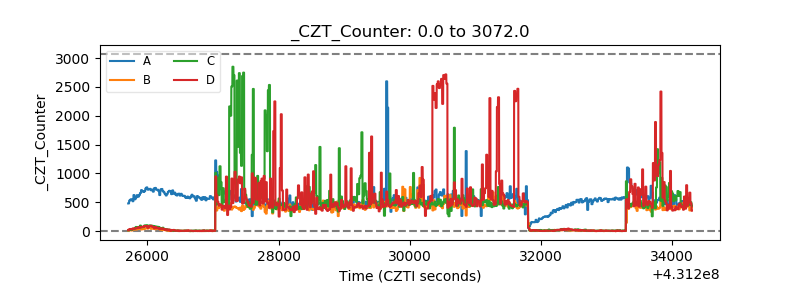 |
| +2.5 Volts monitor | 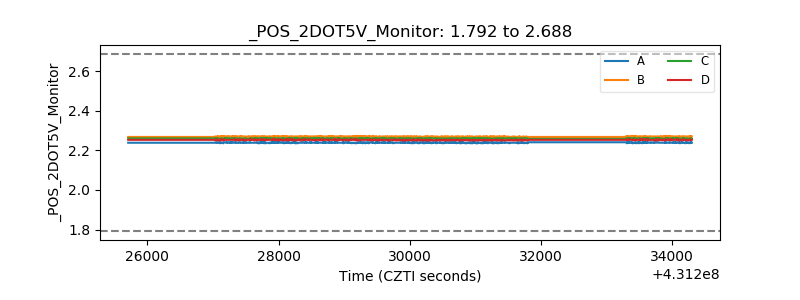 |
| +5 Volts monitor | 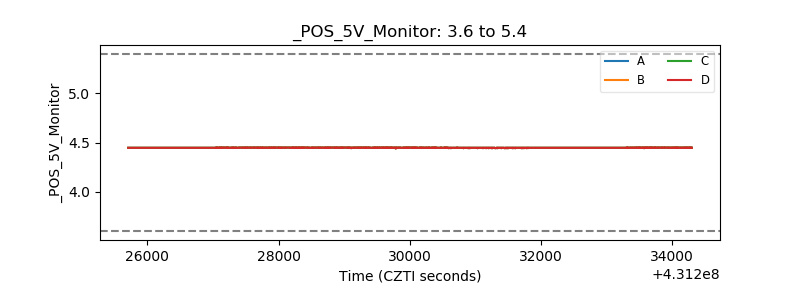 |
| _ROLL_ROT | 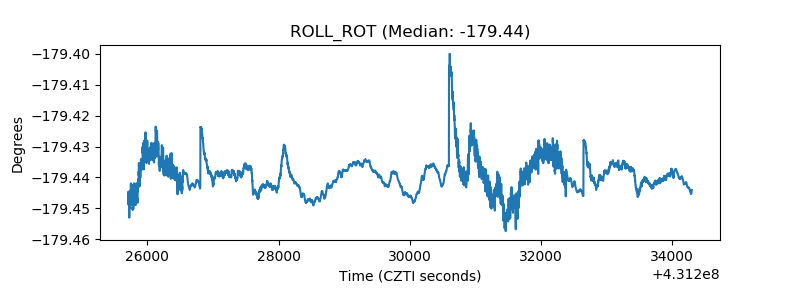 |
| _Roll_DEC | 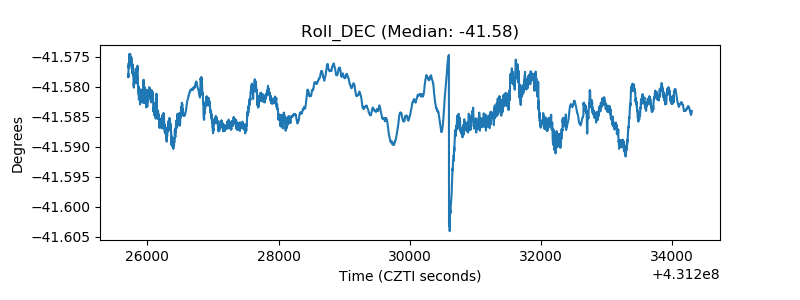 |
| _Roll_RA | 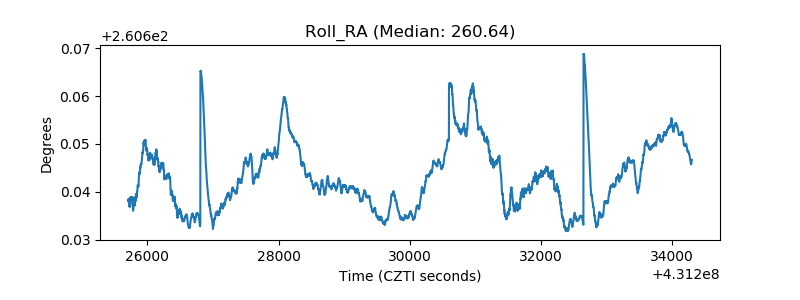 |
| Veto Counter | 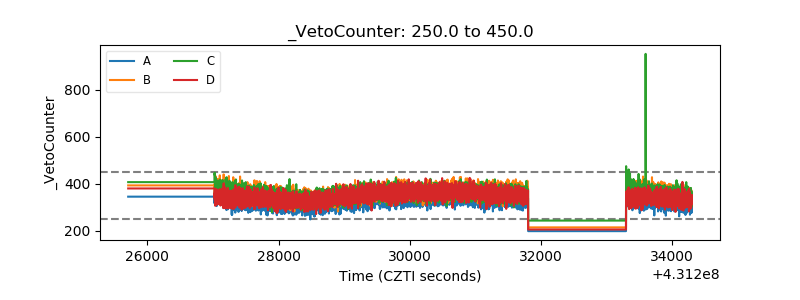 |