| Param | Original file | Final file |
|---|---|---|
| Filename | modeM0/AS1T05_138T01_9000005828_42856cztM0_level2.fits | modeM0/AS1T05_138T01_9000005828_42856cztM0_level2_quad_clean.evt |
| Size (bytes) | 347,676,480 | 92,672,640 |
| Size | 331.6 MB | 88.4 MB |
| Events in quadrant A | 3,216,815 | 609,626 |
| Events in quadrant B | 2,633,906 | 626,288 |
| Events in quadrant C | 3,013,635 | 615,842 |
| Events in quadrant D | 3,559,192 | 553,093 |
| Mode M0 | |||
|---|---|---|---|
| Quadrant | BADHDUFLAG | Total packets | Discarded packets |
| A | 0 | 12908 | 2 |
| B | 0 | 11926 | 2 |
| C | 0 | 12495 | 3 |
| D | 0 | 14496 | 2 |
| Mode M9 | |||
|---|---|---|---|
| Quadrant | BADHDUFLAG | Total packets | Discarded packets |
| A | 0 | 13 | 0 |
| B | 0 | 14 | 0 |
| C | 0 | 14 | 0 |
| D | 0 | 14 | 0 |
| Mode SS | |||
|---|---|---|---|
| Quadrant | BADHDUFLAG | Total packets | Discarded packets |
| A | 0 | 118 | 0 |
| B | 0 | 118 | 0 |
| C | 0 | 118 | 0 |
| D | 0 | 118 | 0 |
| Quadrant | Total seconds | Saturated seconds | Saturation percentage |
|---|---|---|---|
| A | 5733 | 25 | 0.436072% |
| B | 5733 | 32 | 0.558172% |
| C | 5732 | 16 | 0.279135% |
| D | 5732 | 144 | 2.512212% |
Noise dominated data is calculated using 1-second bins in cleaned event files. If a bin has >2000 counts, and if more than 50% of those come from <1% of pixels, then it is considered to be noise-dominated and hence unusable.
| Quadrant | # 1 sec bins | Bins with >0 counts | Bins with >2000 counts | High rate bins dominated by noise | Noise dominated (total time) | Noise dominated (detector-on time) | Marked lightcurve |
|---|---|---|---|---|---|---|---|
| A | 7075 | 5734 | 15 | 15 | 0.21% | 0.26% | 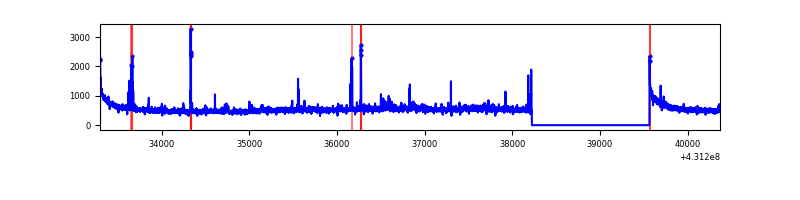 |
| B | 7075 | 5734 | 19 | 19 | 0.27% | 0.33% | 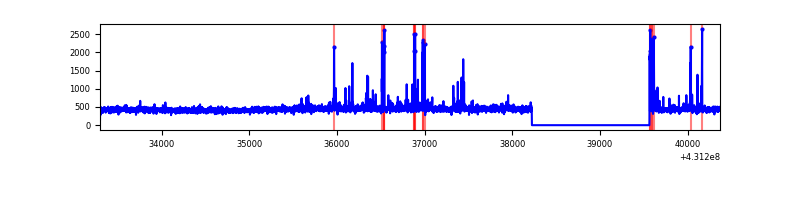 |
| C | 7074 | 5733 | 15 | 15 | 0.21% | 0.26% | 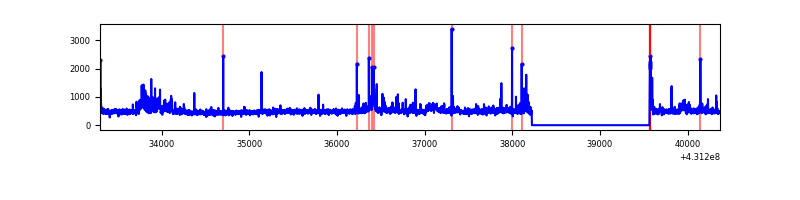 |
| D | 7074 | 5733 | 137 | 137 | 1.94% | 2.39% | 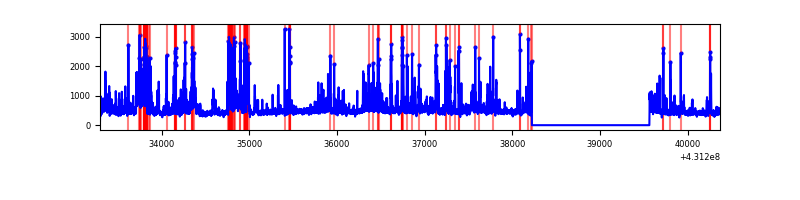 |
Top three noisy pixels from each quadrant. If the there are fewer than three noisy pixels in the level2.evt file, extra rows are filled as -1
| Pixel properties | Quadrant properties | ||||||
|---|---|---|---|---|---|---|---|
| Quadrant | DetID | PixID | Counts | Sigma | Mean | Median | Sigma |
| A | 10 | 83 | 623807 | 4855.26 | 622 | 609 | 128.4 |
| A | 12 | 189 | 108734 | 842.39 | 622 | 609 | 128.4 |
| A | 15 | 237 | 54504 | 419.89 | 622 | 609 | 128.4 |
| B | 5 | 255 | 110260 | 918.79 | 619 | 603 | 119.3 |
| B | 4 | 171 | 38407 | 316.75 | 619 | 603 | 119.3 |
| B | 15 | 85 | 23308 | 190.24 | 619 | 603 | 119.3 |
| C | 12 | 2 | 251542 | 1747.52 | 611 | 615 | 143.6 |
| C | 15 | 214 | 235266 | 1634.17 | 611 | 615 | 143.6 |
| C | 14 | 254 | 53690 | 369.63 | 611 | 615 | 143.6 |
| D | 2 | 249 | 446471 | 3001.63 | 602 | 585 | 148.5 |
| D | 12 | 6 | 364410 | 2449.21 | 602 | 585 | 148.5 |
| D | 1 | 52 | 84064 | 561.96 | 602 | 585 | 148.5 |
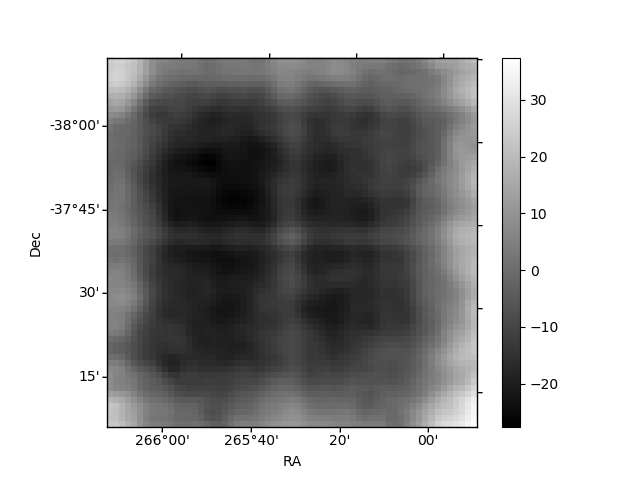
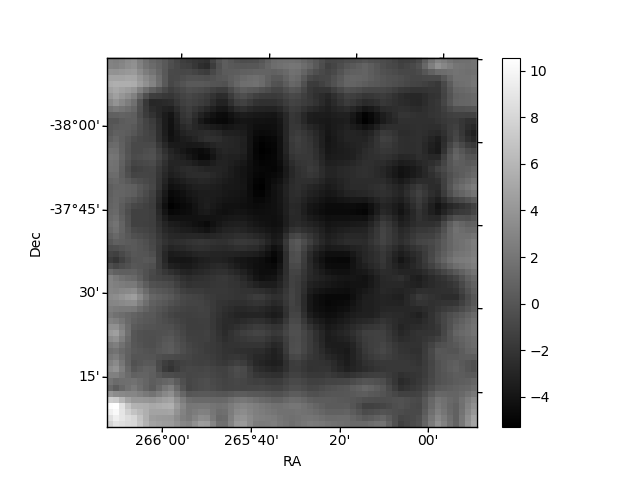
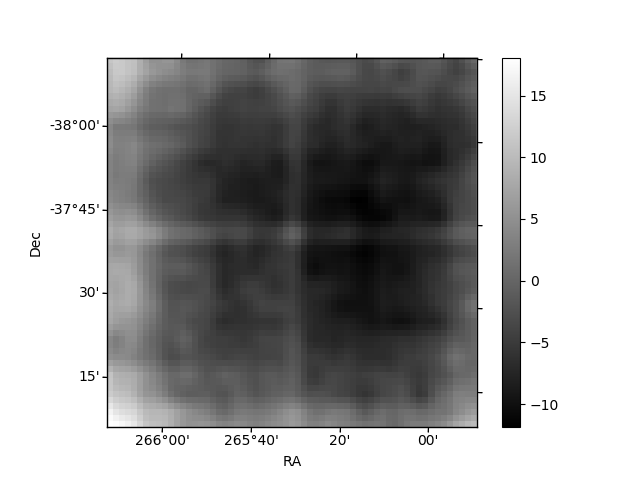
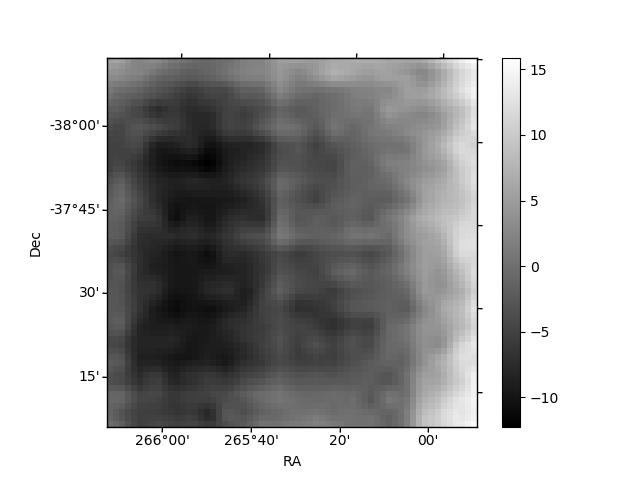
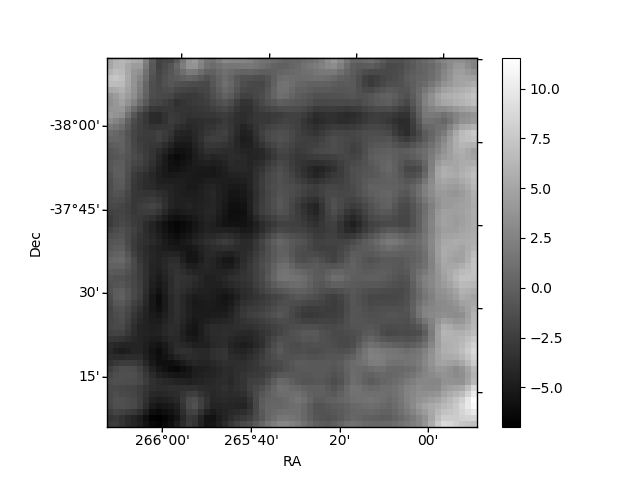
Histogram calculated using DETX and DETY for each event in the final _common_clean file
| Quadrant A | 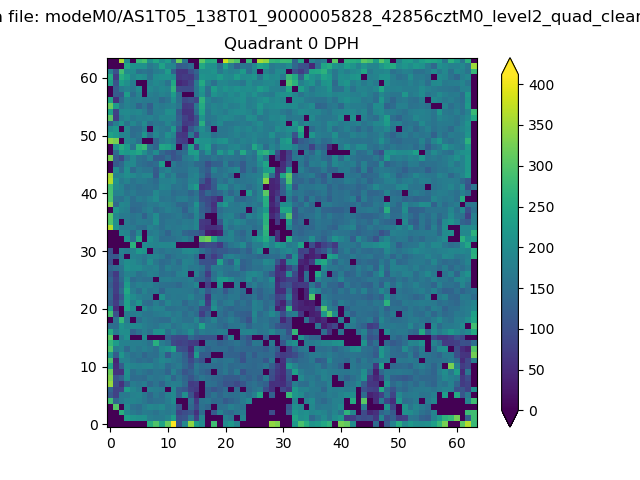 |
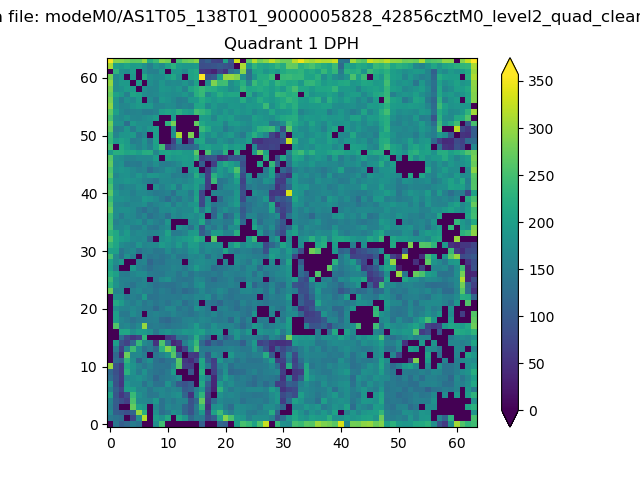 |
Quadrant B |
|---|---|---|---|
| Quadrant D | 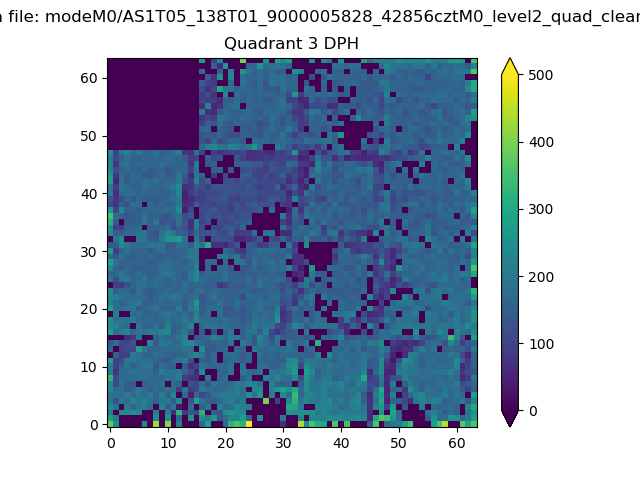 |
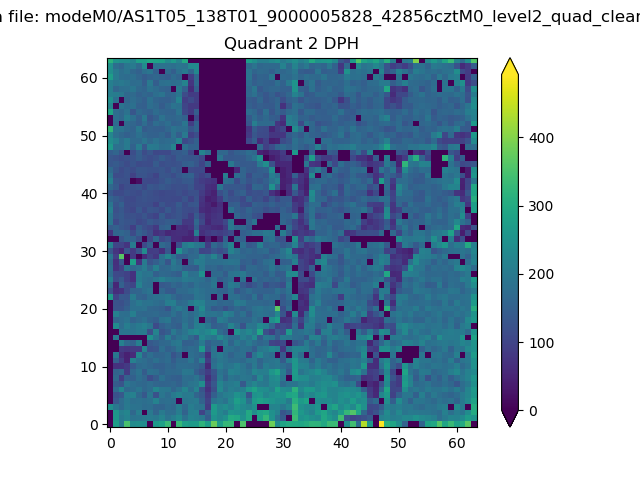 |
Quadrant C |
| Plot type | Count rate plots | Images |
|---|---|---|
| Comparison with Poisson distribution Blue bars denote a histogram of data divided into 1 sec bins. Red curve is a Poisson curve with rate = median count rate of data. |
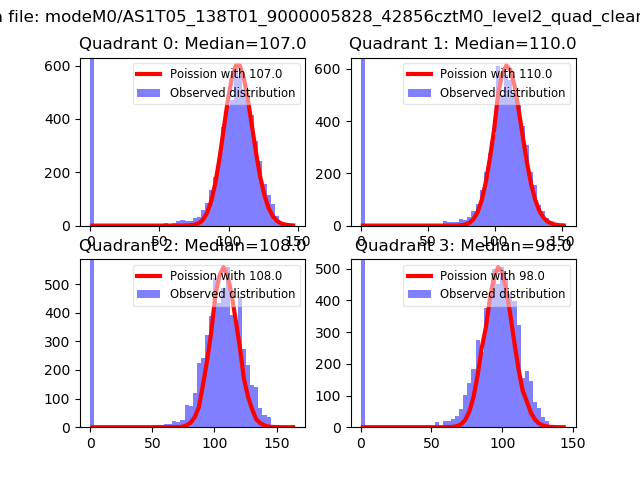 |
 |
| Quadrant-wise count rates Data is divided into 100 sec bins |
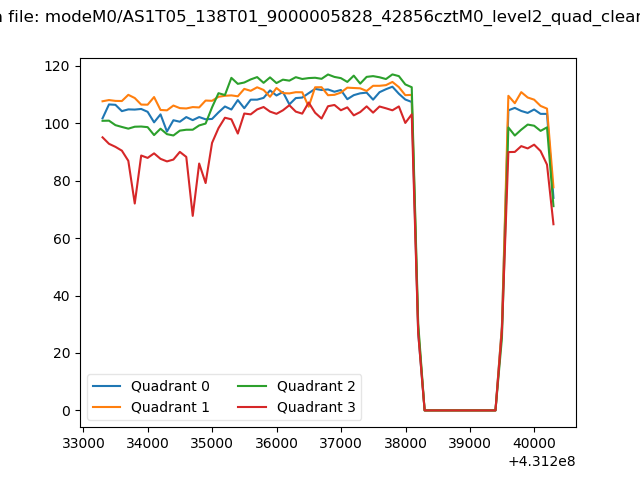 |
|
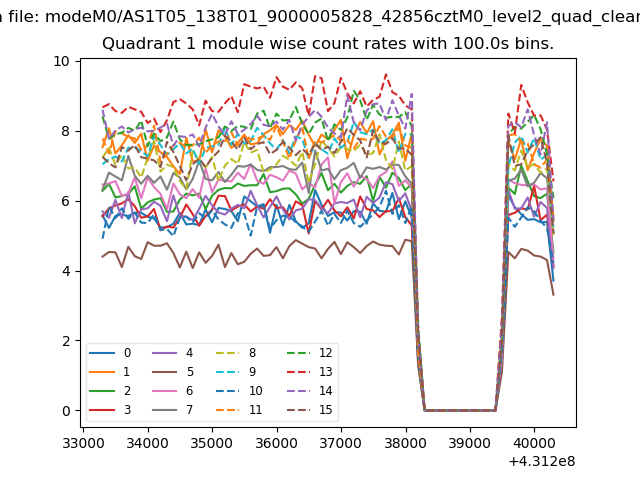
| Module-wise count rates for Quadrant A Data is divided into 100 sec bins |
 |
 |
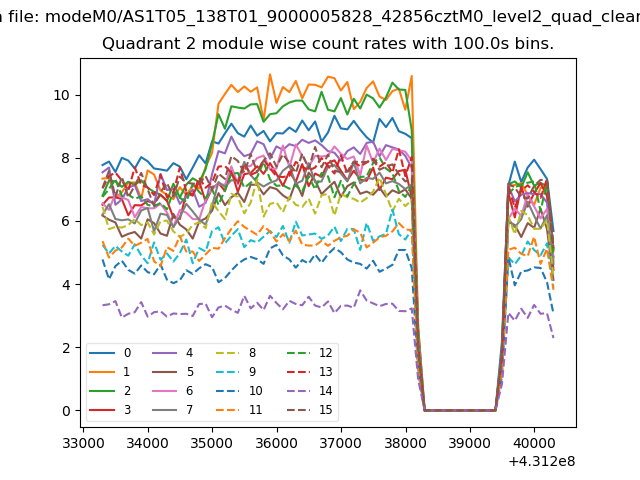
| Module-wise count rates for Quadrant B Data is divided into 100 sec bins |
 |
 |
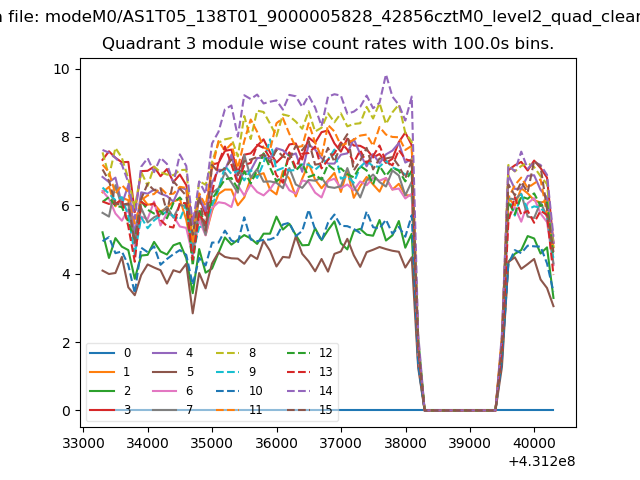
| Module-wise count rates for Quadrant C Data is divided into 100 sec bins |
 |
 |
| Module-wise count rates for Quadrant D Data is divided into 100 sec bins |
 |
 |
| Parameter | Plot |
|---|---|
| CZT HV Monitor | 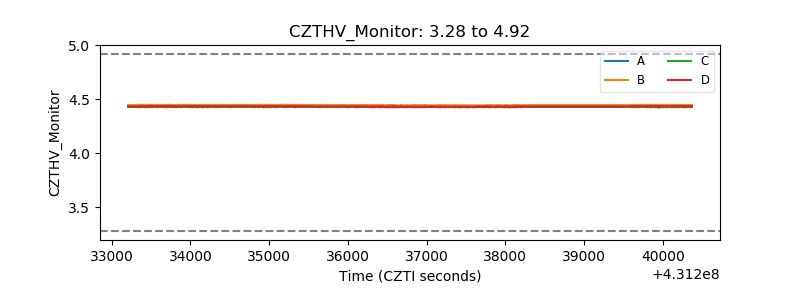 |
| D_VDD | 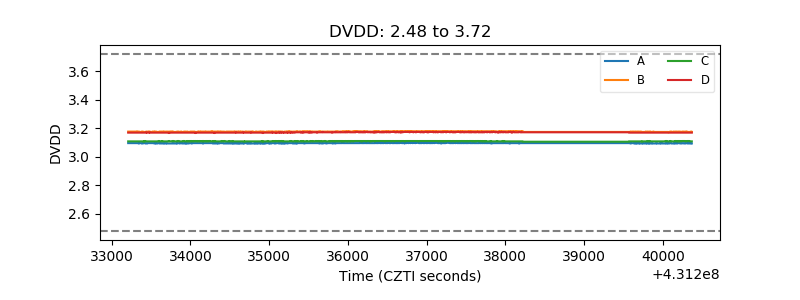 |
| Temperature 1 | 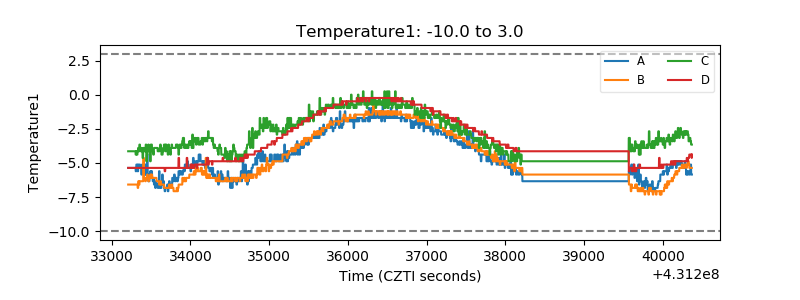 |
| Veto HV Monitor | 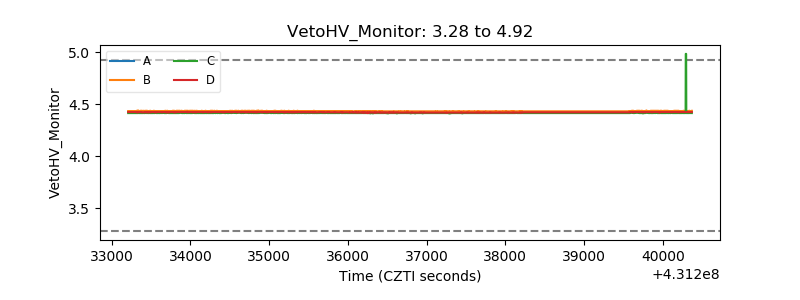 |
| Veto LLD | 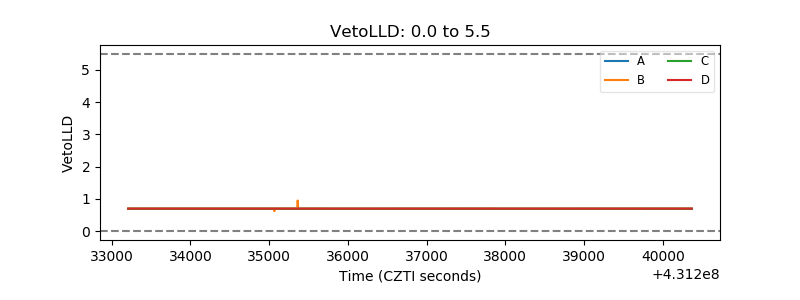 |
| Alpha Counter | 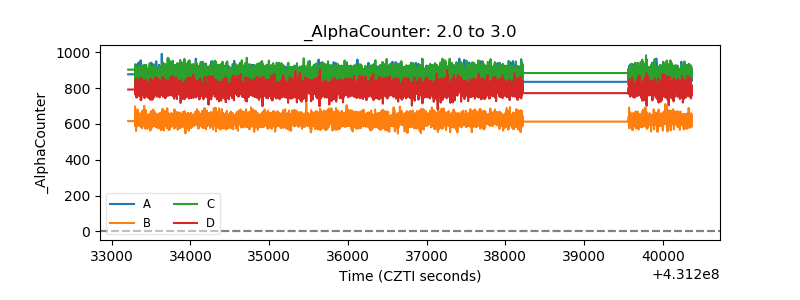 |
| _CPM_Rate | 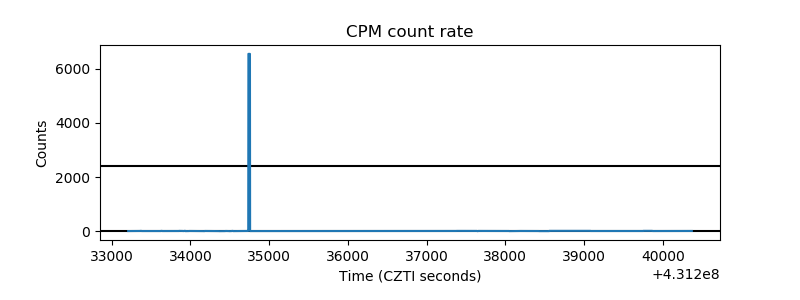 |
| CZT Counter | 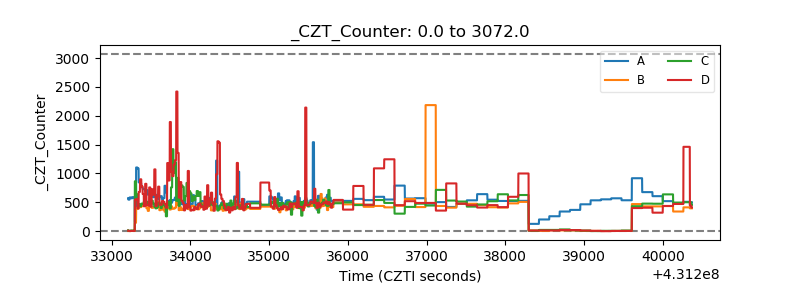 |
| +2.5 Volts monitor | 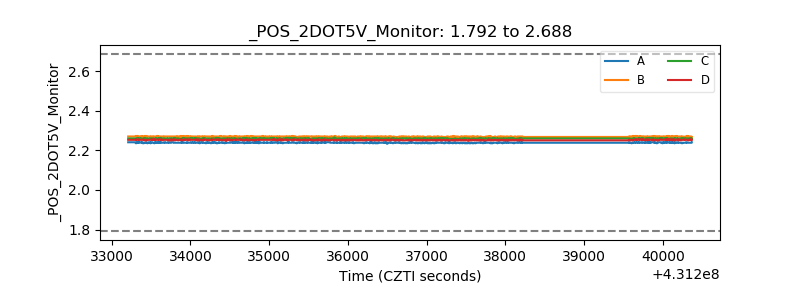 |
| +5 Volts monitor |  |
| _ROLL_ROT | 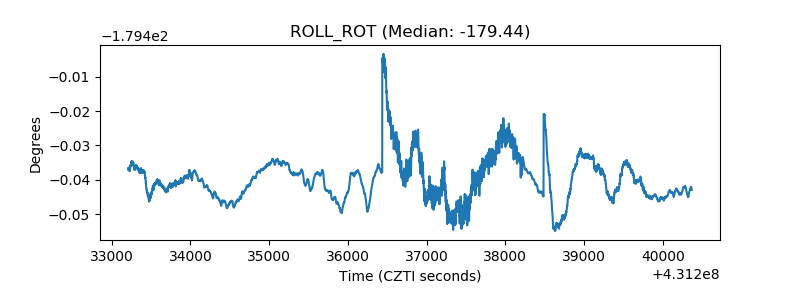 |
| _Roll_DEC | 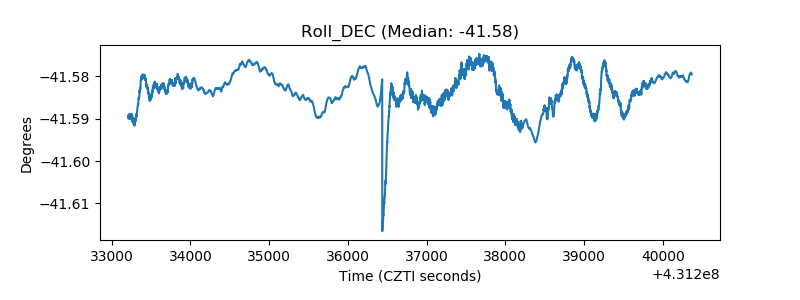 |
| _Roll_RA | 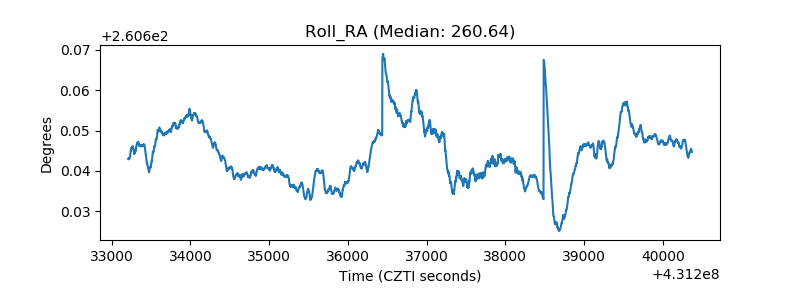 |
| Veto Counter | 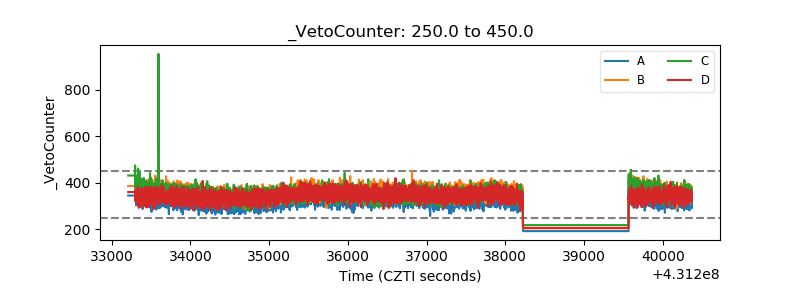 |