| Param | Original file | Final file |
|---|---|---|
| Filename | modeM0/AS1T05_138T01_9000005828_42859cztM0_level2.fits | modeM0/AS1T05_138T01_9000005828_42859cztM0_level2_quad_clean.evt |
| Size (bytes) | 1,134,040,320 | 252,025,920 |
| Size | 1.1 GB | 240.4 MB |
| Events in quadrant A | 8,808,532 | 1,699,032 |
| Events in quadrant B | 7,674,572 | 1,748,107 |
| Events in quadrant C | 8,580,454 | 1,760,650 |
| Events in quadrant D | 15,688,804 | 1,329,043 |
| Mode M0 | |||
|---|---|---|---|
| Quadrant | BADHDUFLAG | Total packets | Discarded packets |
| A | 0 | 35214 | 4 |
| B | 0 | 33788 | 4 |
| C | 0 | 35352 | 4 |
| D | 0 | 57450 | 4 |
| Mode M9 | |||
|---|---|---|---|
| Quadrant | BADHDUFLAG | Total packets | Discarded packets |
| A | 0 | 53 | 0 |
| B | 0 | 53 | 0 |
| C | 0 | 53 | 0 |
| D | 0 | 53 | 0 |
| Mode SS | |||
|---|---|---|---|
| Quadrant | BADHDUFLAG | Total packets | Discarded packets |
| A | 0 | 328 | 0 |
| B | 0 | 328 | 0 |
| C | 0 | 328 | 0 |
| D | 0 | 328 | 0 |
| Quadrant | Total seconds | Saturated seconds | Saturation percentage |
|---|---|---|---|
| A | 15840 | 82 | 0.517677% |
| B | 15841 | 145 | 0.915346% |
| C | 15841 | 96 | 0.606022% |
| D | 15841 | 2720 | 17.170633% |
Noise dominated data is calculated using 1-second bins in cleaned event files. If a bin has >2000 counts, and if more than 50% of those come from <1% of pixels, then it is considered to be noise-dominated and hence unusable.
| Quadrant | # 1 sec bins | Bins with >0 counts | Bins with >2000 counts | High rate bins dominated by noise | Noise dominated (total time) | Noise dominated (detector-on time) | Marked lightcurve |
|---|---|---|---|---|---|---|---|
| A | 21300 | 15844 | 51 | 51 | 0.24% | 0.32% | 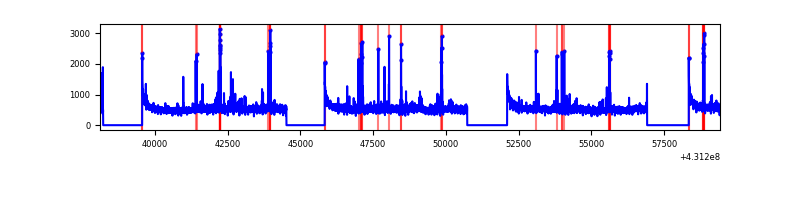 |
| B | 21301 | 15845 | 108 | 108 | 0.51% | 0.68% | 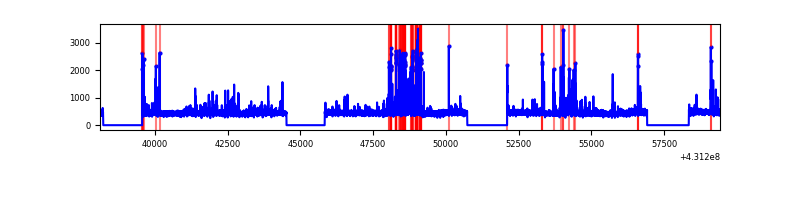 |
| C | 21301 | 15845 | 68 | 68 | 0.32% | 0.43% | 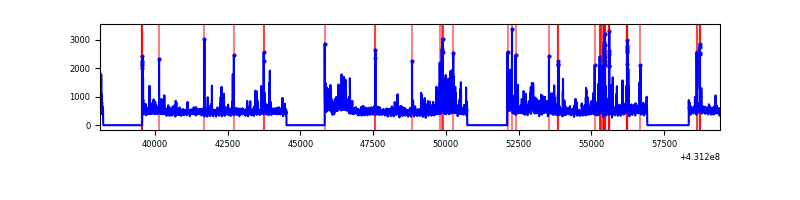 |
| D | 21301 | 15845 | 2516 | 2516 | 11.81% | 15.88% | 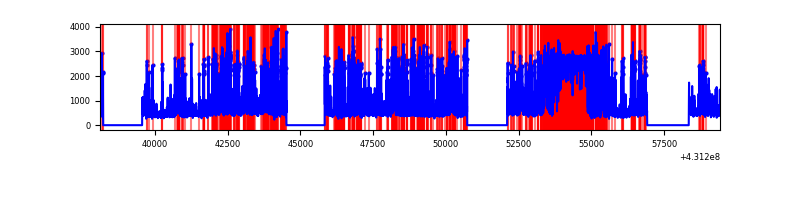 |
Top three noisy pixels from each quadrant. If the there are fewer than three noisy pixels in the level2.evt file, extra rows are filled as -1
| Pixel properties | Quadrant properties | ||||||
|---|---|---|---|---|---|---|---|
| Quadrant | DetID | PixID | Counts | Sigma | Mean | Median | Sigma |
| A | 10 | 83 | 1584195 | 4443.73 | 1738 | 1701 | 356.1 |
| A | 12 | 189 | 233250 | 650.2 | 1738 | 1701 | 356.1 |
| A | 15 | 237 | 164890 | 458.24 | 1738 | 1701 | 356.1 |
| B | 5 | 255 | 596119 | 1771.77 | 1726 | 1676 | 335.5 |
| B | 5 | 172 | 69607 | 202.47 | 1726 | 1676 | 335.5 |
| B | 15 | 85 | 63229 | 183.46 | 1726 | 1676 | 335.5 |
| C | 15 | 214 | 638783 | 1589.57 | 1714 | 1724 | 400.8 |
| C | 12 | 2 | 587218 | 1460.91 | 1714 | 1724 | 400.8 |
| C | 14 | 254 | 308436 | 765.3 | 1714 | 1724 | 400.8 |
| D | 12 | 233 | 3904692 | 10408.9 | 1545 | 1503 | 375.0 |
| D | 1 | 52 | 2540078 | 6769.79 | 1545 | 1503 | 375.0 |
| D | 2 | 249 | 1317808 | 3510.28 | 1545 | 1503 | 375.0 |
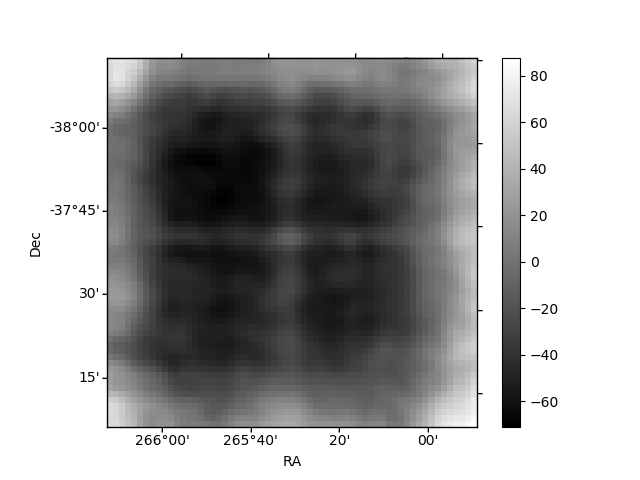
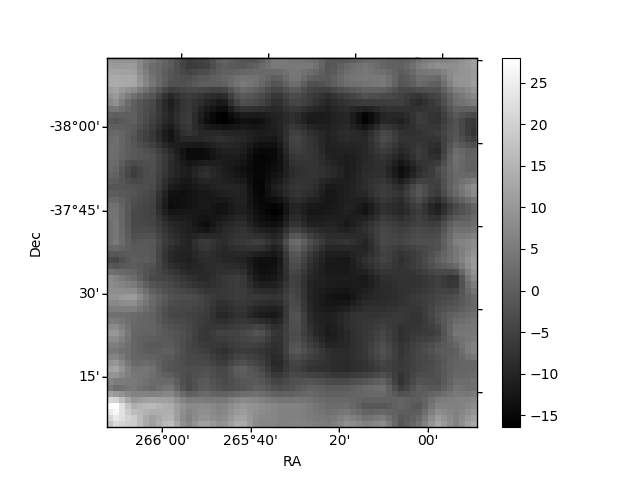
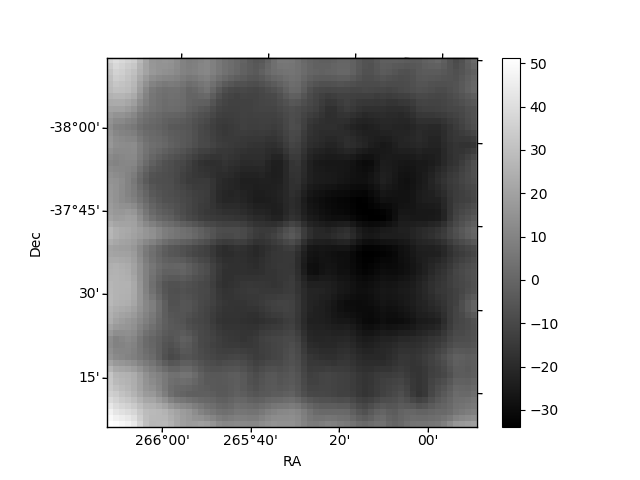
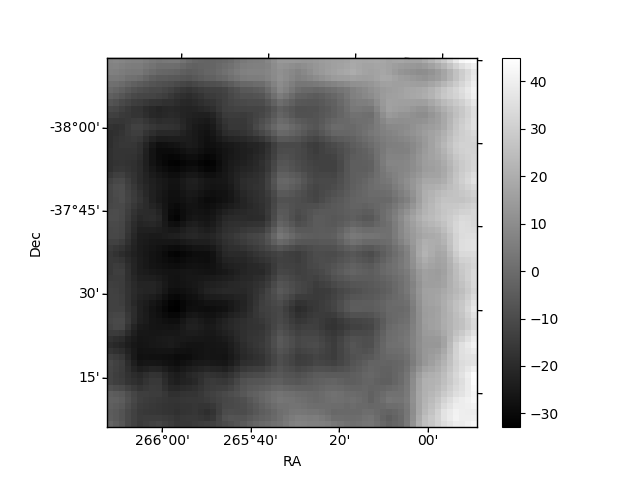
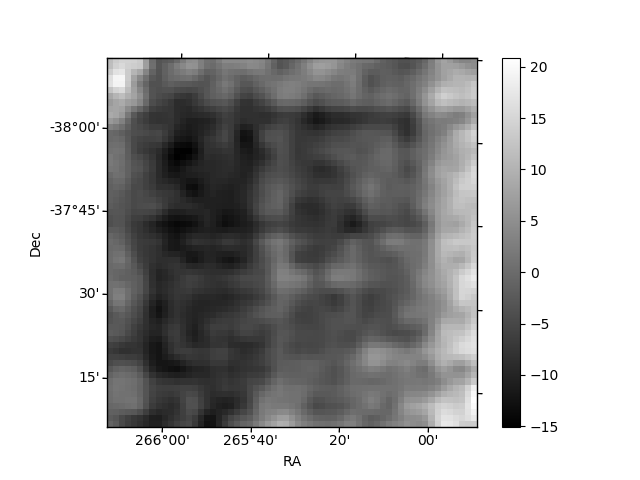
Histogram calculated using DETX and DETY for each event in the final _common_clean file
| Quadrant A | 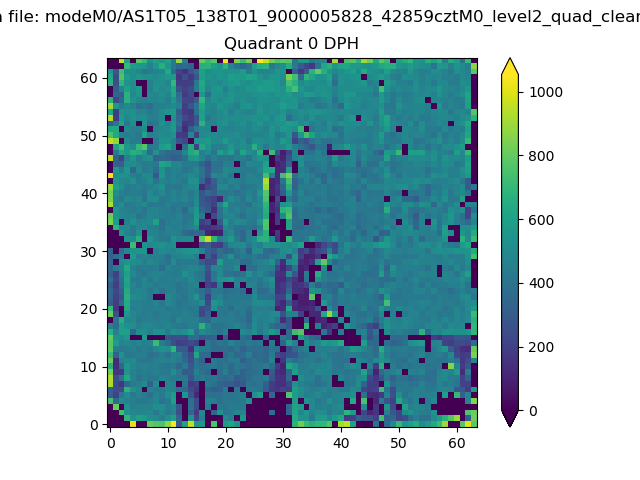 |
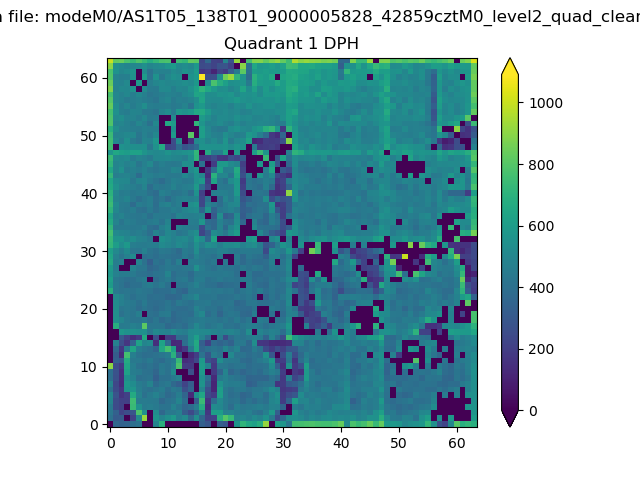 |
Quadrant B |
|---|---|---|---|
| Quadrant D | 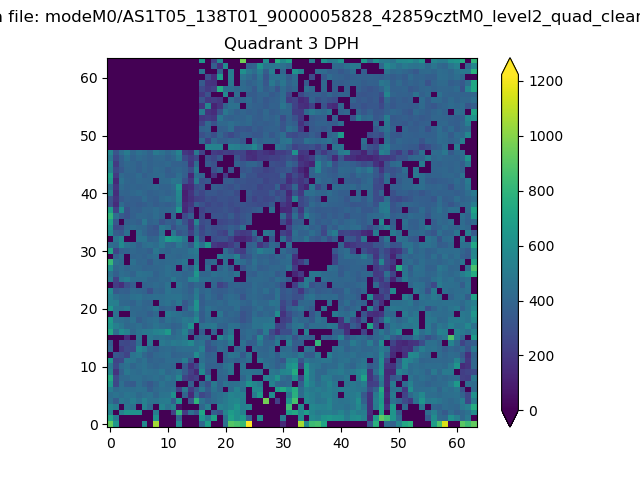 |
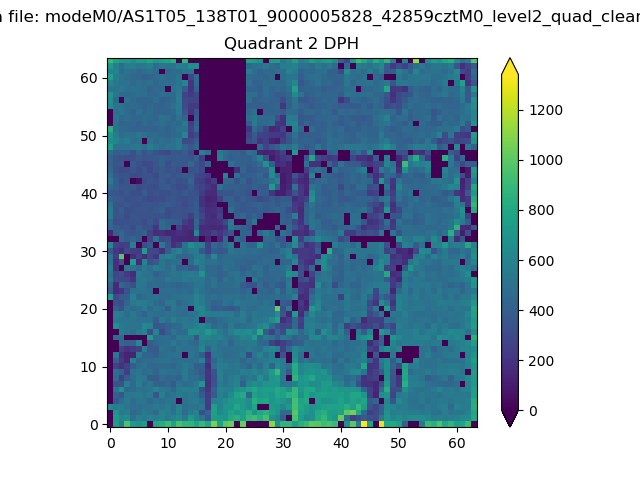 |
Quadrant C |
| Plot type | Count rate plots | Images |
|---|---|---|
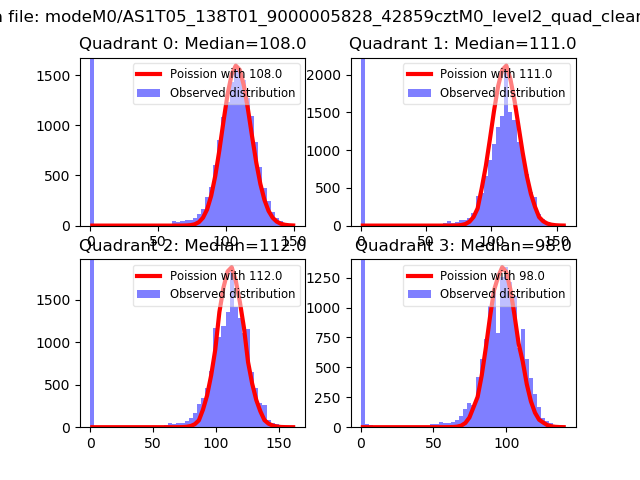
| Comparison with Poisson distribution Blue bars denote a histogram of data divided into 1 sec bins. Red curve is a Poisson curve with rate = median count rate of data. |
 |
 |
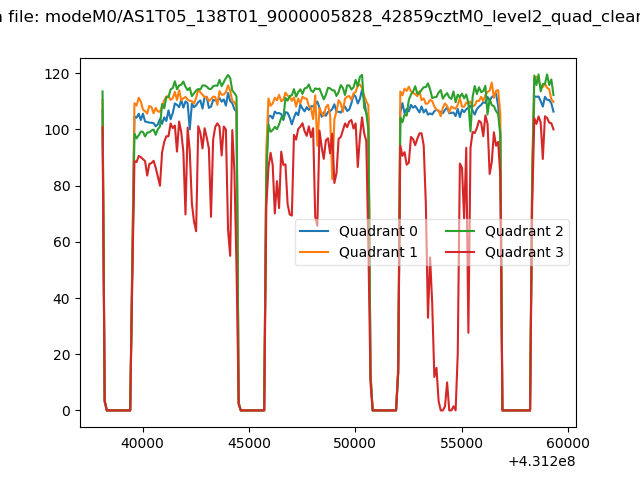
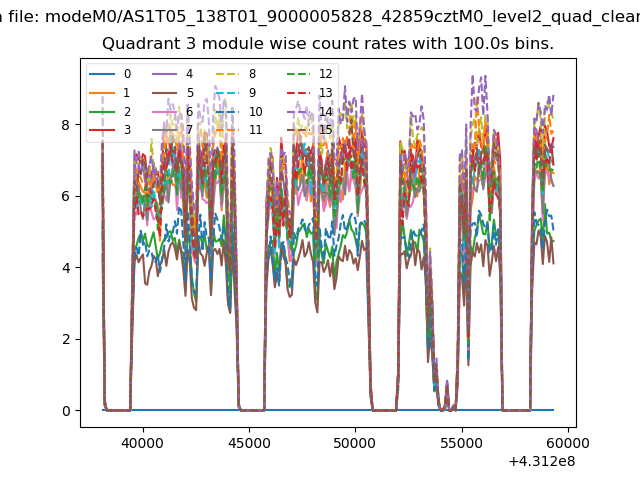
| Quadrant-wise count rates Data is divided into 100 sec bins |
 |
|
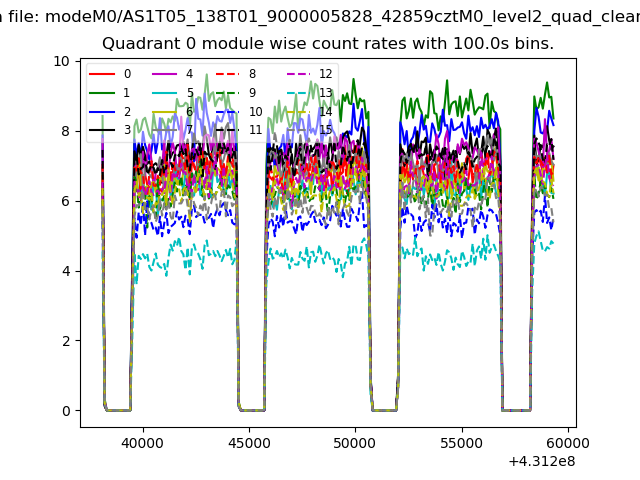
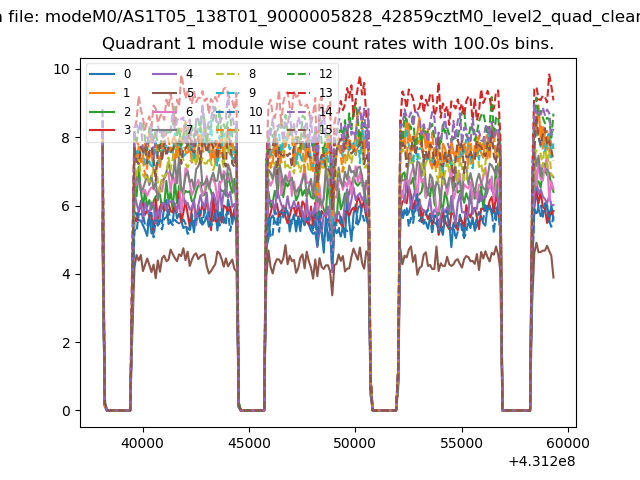
| Module-wise count rates for Quadrant A Data is divided into 100 sec bins |
 |
 |
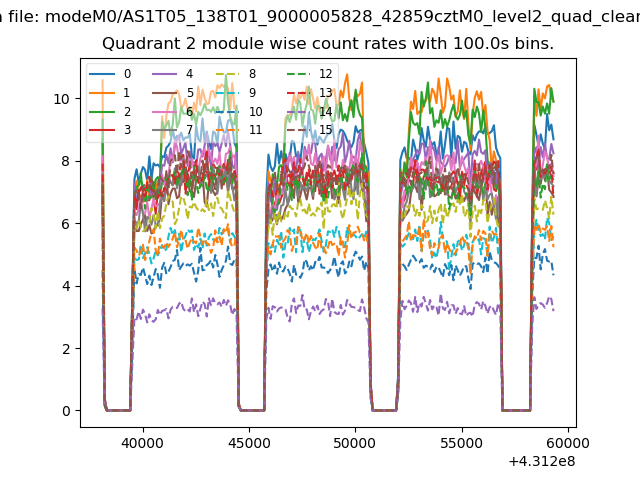
| Module-wise count rates for Quadrant B Data is divided into 100 sec bins |
 |
 |
| Module-wise count rates for Quadrant C Data is divided into 100 sec bins |
 |
 |
| Module-wise count rates for Quadrant D Data is divided into 100 sec bins |
 |
 |
| Parameter | Plot |
|---|---|
| CZT HV Monitor | 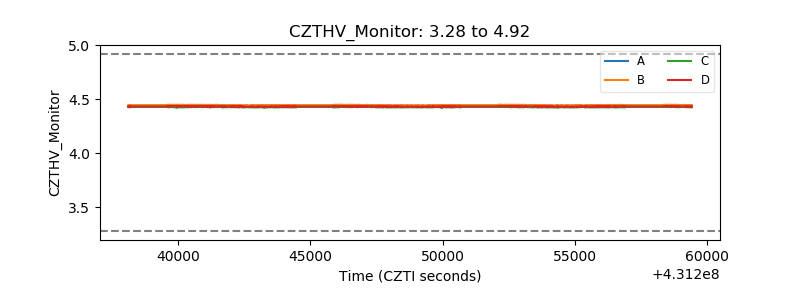 |
| D_VDD | 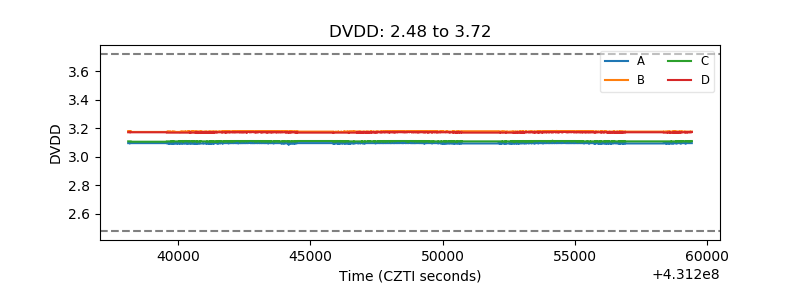 |
| Temperature 1 |  |
| Veto HV Monitor | 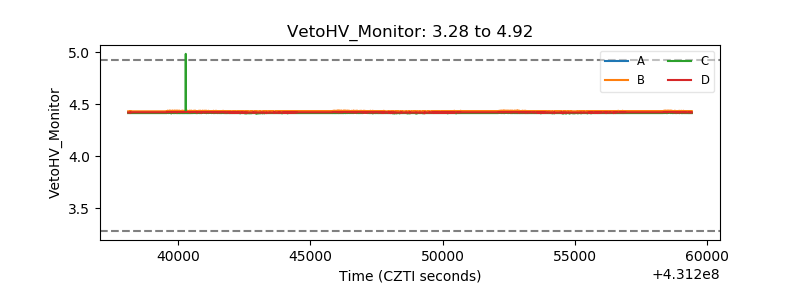 |
| Veto LLD | 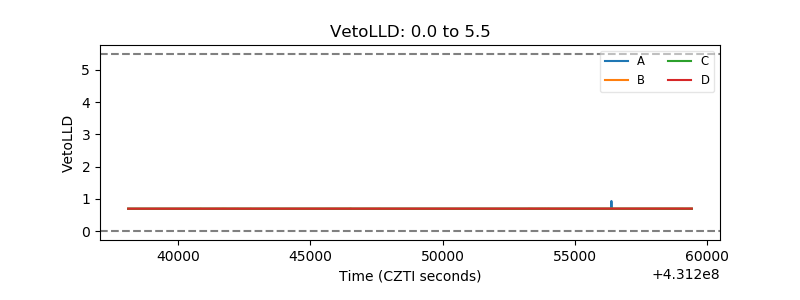 |
| Alpha Counter | 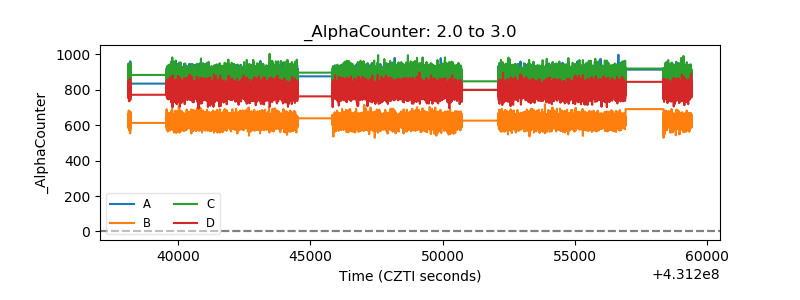 |
| _CPM_Rate | 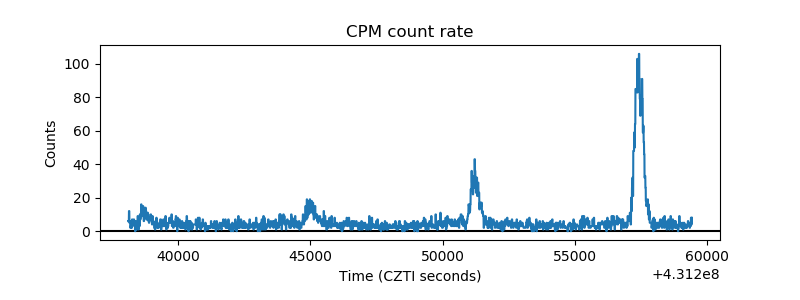 |
| CZT Counter | 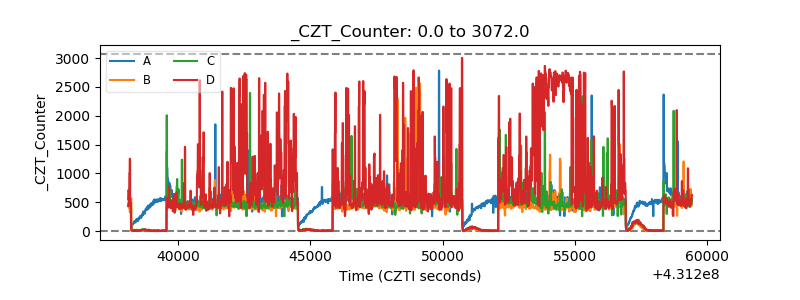 |
| +2.5 Volts monitor | 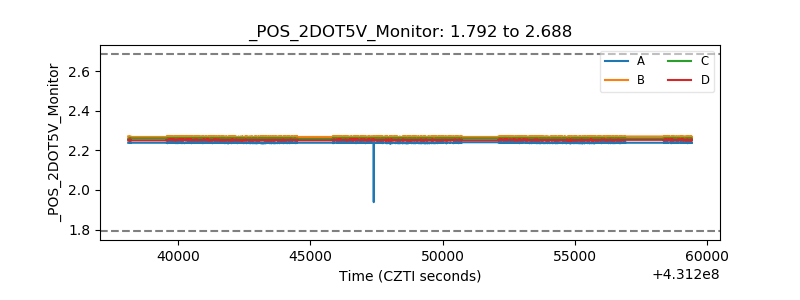 |
| +5 Volts monitor |  |
| _ROLL_ROT | 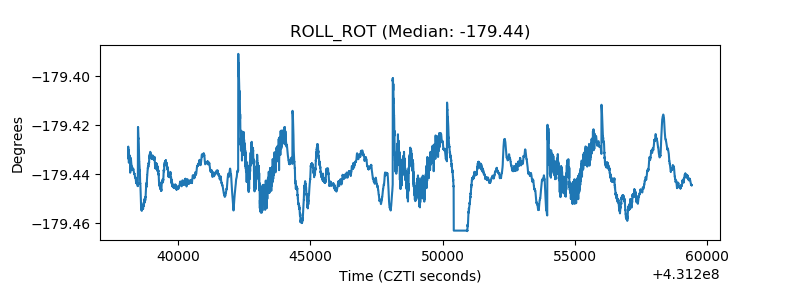 |
| _Roll_DEC | 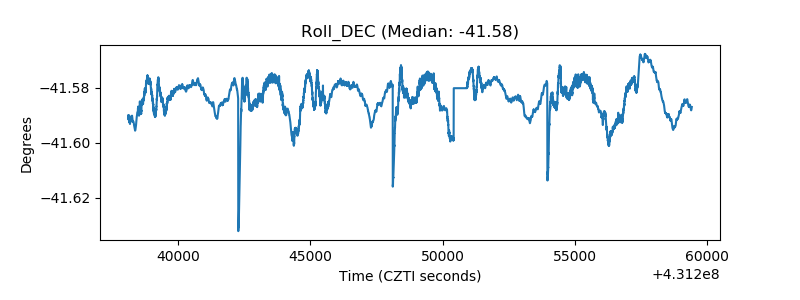 |
| _Roll_RA | 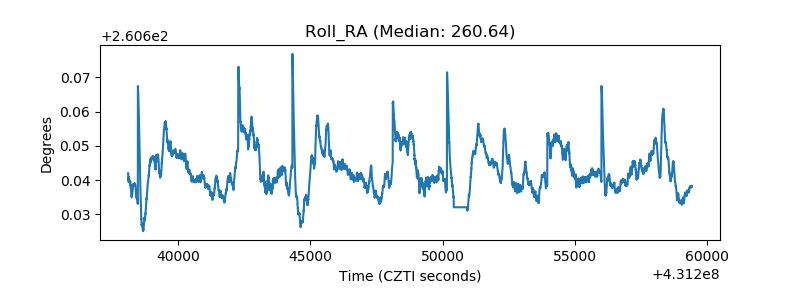 |
| Veto Counter |  |