| Param | Original file | Final file |
|---|---|---|
| Filename | modeM0/AS1T05_138T01_9000005828_42861cztM0_level2.fits | modeM0/AS1T05_138T01_9000005828_42861cztM0_level2_quad_clean.evt |
| Size (bytes) | 364,674,240 | 93,513,600 |
| Size | 347.8 MB | 89.2 MB |
| Events in quadrant A | 3,381,295 | 612,141 |
| Events in quadrant B | 2,733,898 | 633,115 |
| Events in quadrant C | 3,291,005 | 628,758 |
| Events in quadrant D | 3,659,391 | 567,574 |
| Mode M0 | |||
|---|---|---|---|
| Quadrant | BADHDUFLAG | Total packets | Discarded packets |
| A | 0 | 13503 | 2 |
| B | 0 | 11929 | 2 |
| C | 0 | 13254 | 2 |
| D | 0 | 14465 | 2 |
| Mode M9 | |||
|---|---|---|---|
| Quadrant | BADHDUFLAG | Total packets | Discarded packets |
| A | 0 | 17 | 0 |
| B | 0 | 17 | 0 |
| C | 0 | 17 | 0 |
| D | 0 | 17 | 0 |
| Mode SS | |||
|---|---|---|---|
| Quadrant | BADHDUFLAG | Total packets | Discarded packets |
| A | 0 | 114 | 0 |
| B | 0 | 114 | 0 |
| C | 0 | 114 | 0 |
| D | 0 | 114 | 0 |
| Quadrant | Total seconds | Saturated seconds | Saturation percentage |
|---|---|---|---|
| A | 5569 | 117 | 2.100916% |
| B | 5570 | 41 | 0.736086% |
| C | 5570 | 119 | 2.136445% |
| D | 5570 | 172 | 3.087971% |
Noise dominated data is calculated using 1-second bins in cleaned event files. If a bin has >2000 counts, and if more than 50% of those come from <1% of pixels, then it is considered to be noise-dominated and hence unusable.
| Quadrant | # 1 sec bins | Bins with >0 counts | Bins with >2000 counts | High rate bins dominated by noise | Noise dominated (total time) | Noise dominated (detector-on time) | Marked lightcurve |
|---|---|---|---|---|---|---|---|
| A | 7271 | 5570 | 83 | 83 | 1.14% | 1.49% | 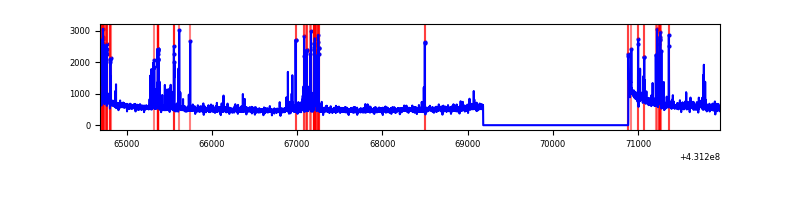 |
| B | 7272 | 5571 | 25 | 25 | 0.34% | 0.45% | 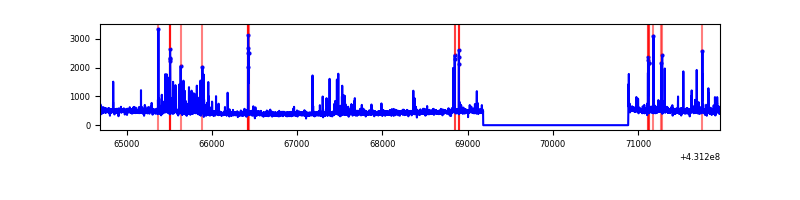 |
| C | 7272 | 5571 | 124 | 124 | 1.71% | 2.23% | 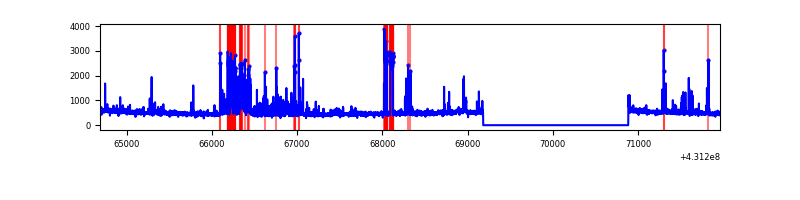 |
| D | 7271 | 5570 | 182 | 182 | 2.50% | 3.27% | 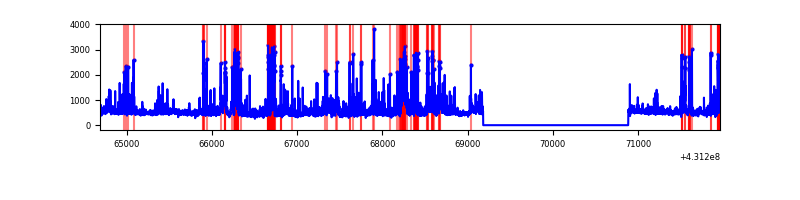 |
Top three noisy pixels from each quadrant. If the there are fewer than three noisy pixels in the level2.evt file, extra rows are filled as -1
| Pixel properties | Quadrant properties | ||||||
|---|---|---|---|---|---|---|---|
| Quadrant | DetID | PixID | Counts | Sigma | Mean | Median | Sigma |
| A | 10 | 83 | 589923 | 4653.93 | 610 | 597 | 126.6 |
| A | 15 | 237 | 236375 | 1861.95 | 610 | 597 | 126.6 |
| A | 13 | 248 | 118577 | 931.69 | 610 | 597 | 126.6 |
| B | 5 | 172 | 127323 | 1071.22 | 610 | 594 | 118.3 |
| B | 5 | 255 | 103392 | 868.93 | 610 | 594 | 118.3 |
| B | 4 | 67 | 27967 | 231.38 | 610 | 594 | 118.3 |
| C | 14 | 254 | 364574 | 2586.69 | 599 | 604 | 140.7 |
| C | 15 | 214 | 224916 | 1594.16 | 599 | 604 | 140.7 |
| C | 7 | 220 | 155929 | 1103.88 | 599 | 604 | 140.7 |
| D | 12 | 6 | 371524 | 2531.68 | 599 | 585 | 146.5 |
| D | 1 | 52 | 295791 | 2014.8 | 599 | 585 | 146.5 |
| D | 10 | 118 | 227073 | 1545.79 | 599 | 585 | 146.5 |
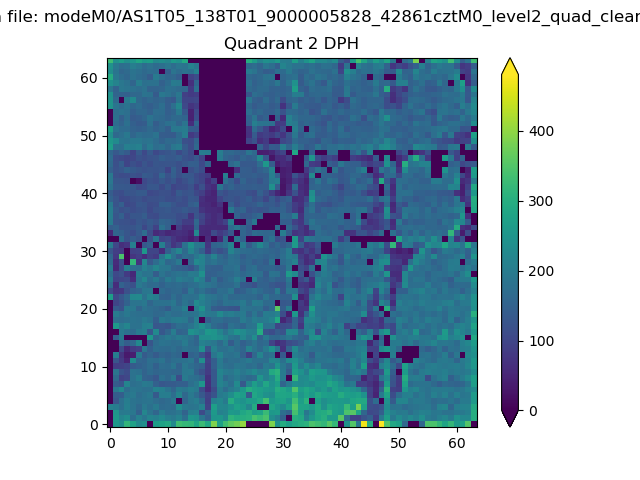
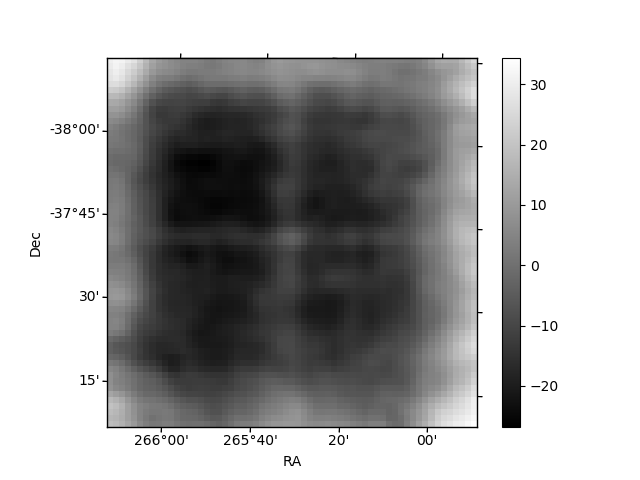
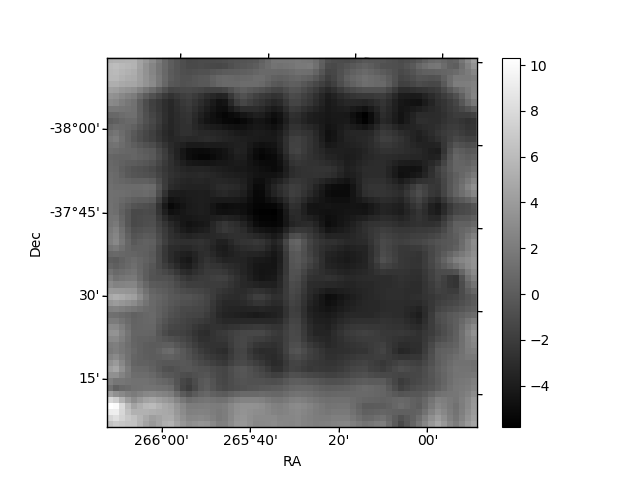
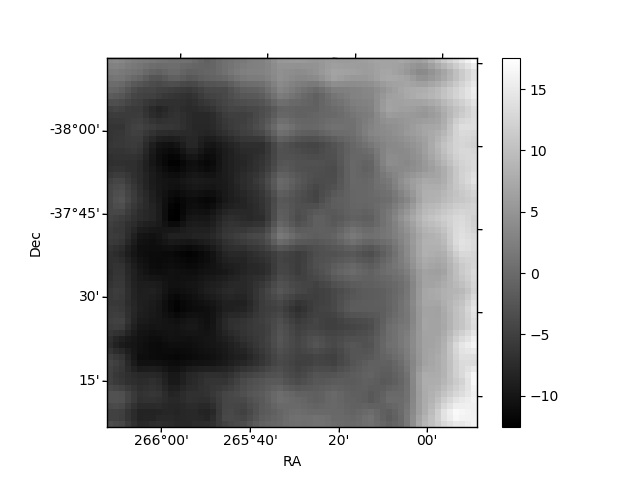
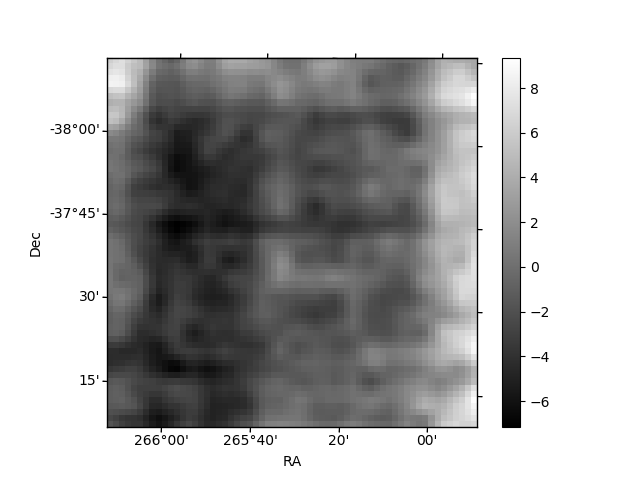
Histogram calculated using DETX and DETY for each event in the final _common_clean file
| Quadrant A | 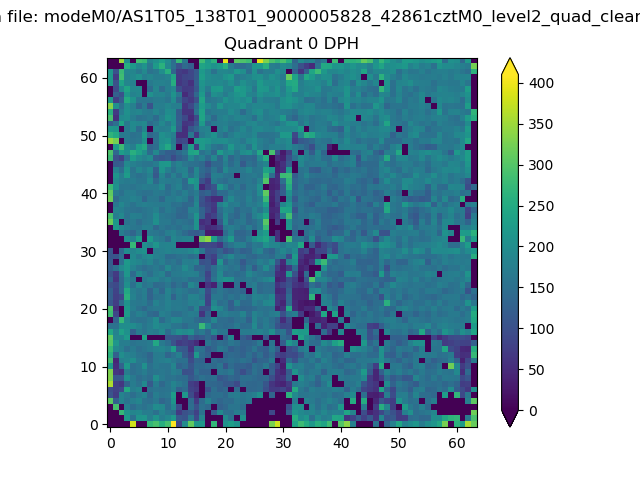 |
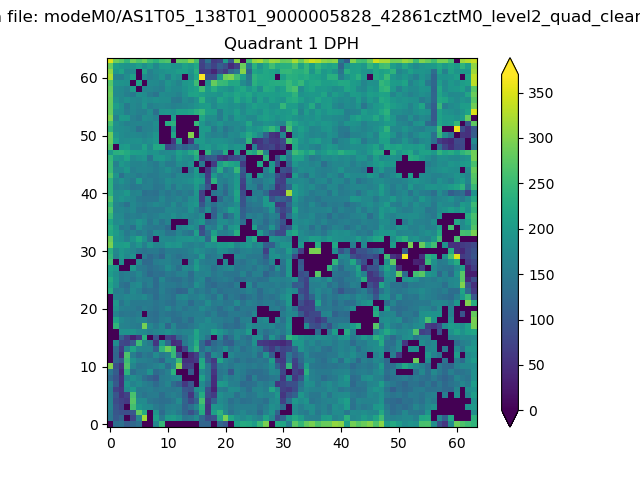 |
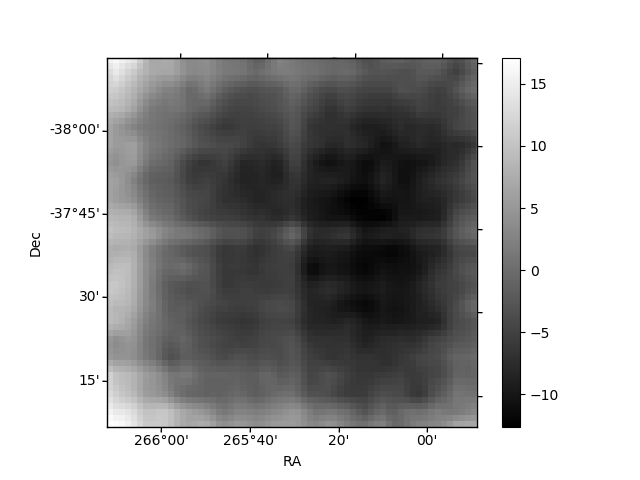
Quadrant B |
|---|---|---|---|
| Quadrant D | 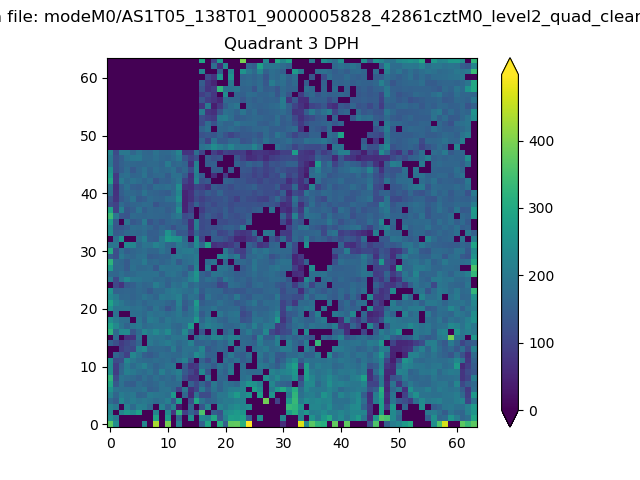 |
 |
Quadrant C |
| Plot type | Count rate plots | Images |
|---|---|---|
| Comparison with Poisson distribution Blue bars denote a histogram of data divided into 1 sec bins. Red curve is a Poisson curve with rate = median count rate of data. |
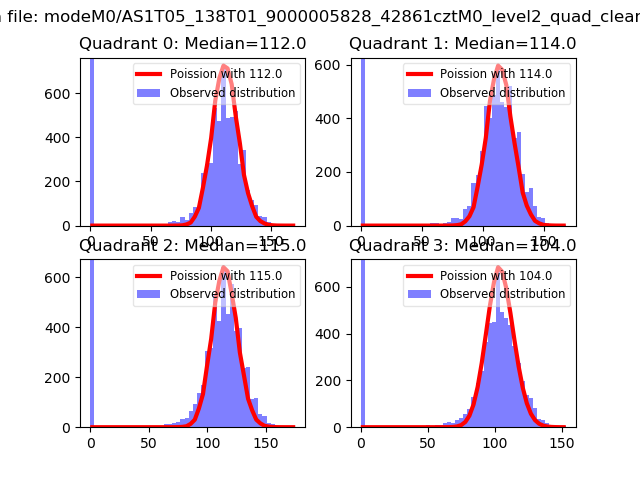 |
 |
| Quadrant-wise count rates Data is divided into 100 sec bins |
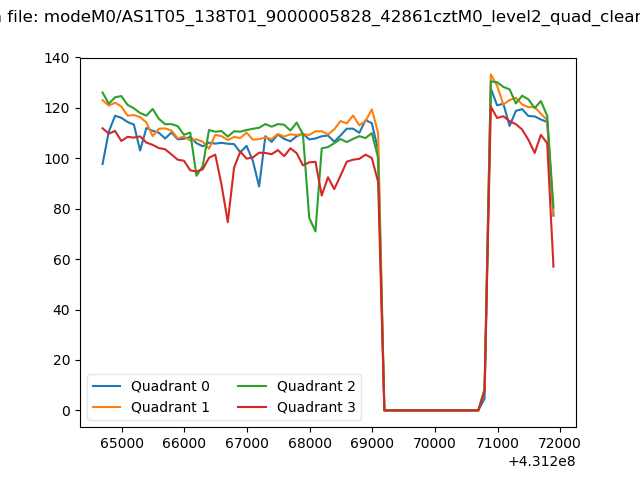 |
|
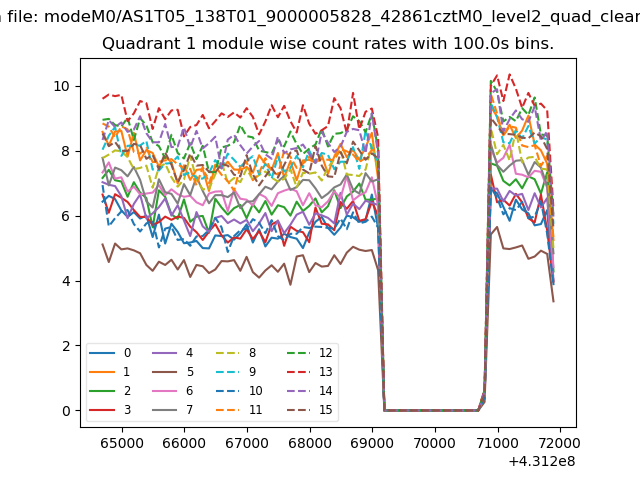
| Module-wise count rates for Quadrant A Data is divided into 100 sec bins |
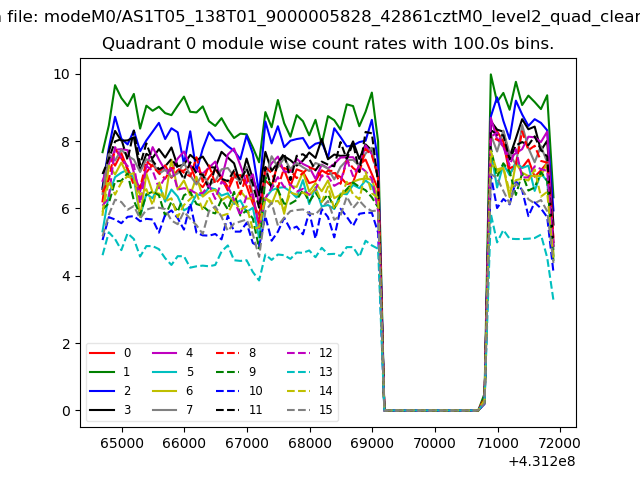 |
 |
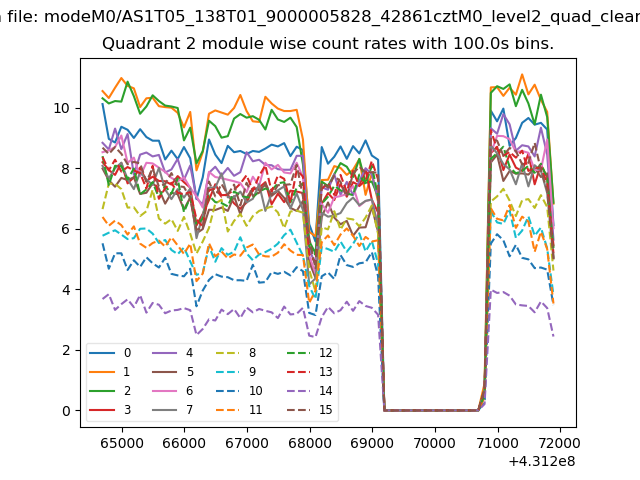
| Module-wise count rates for Quadrant B Data is divided into 100 sec bins |
 |
 |
| Module-wise count rates for Quadrant C Data is divided into 100 sec bins |
 |
 |
| Module-wise count rates for Quadrant D Data is divided into 100 sec bins |
 |
 |
| Parameter | Plot |
|---|---|
| CZT HV Monitor | 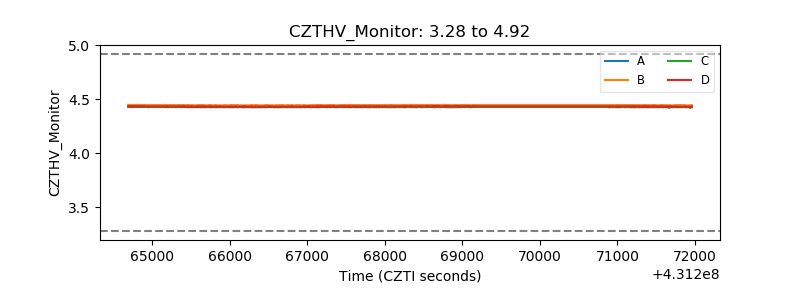 |
| D_VDD | 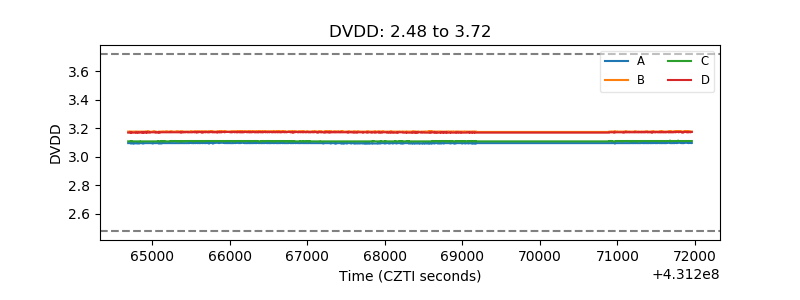 |
| Temperature 1 | 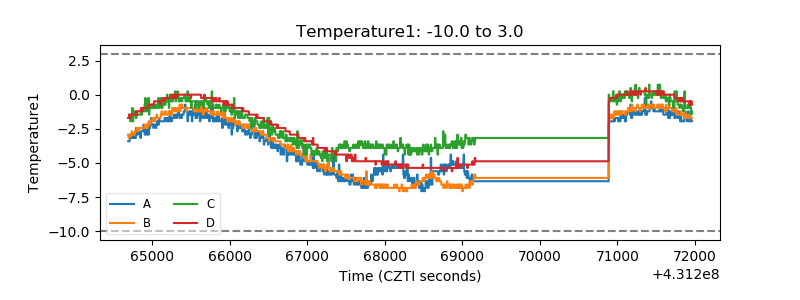 |
| Veto HV Monitor | 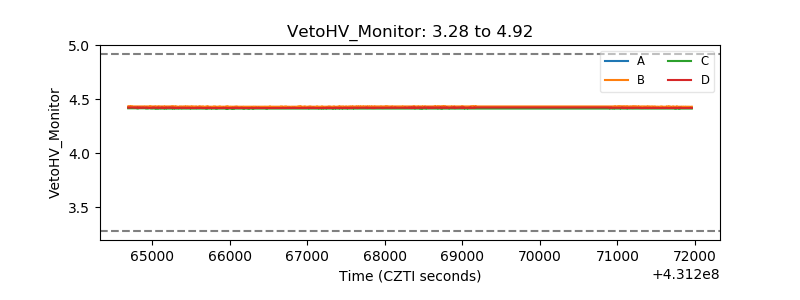 |
| Veto LLD | 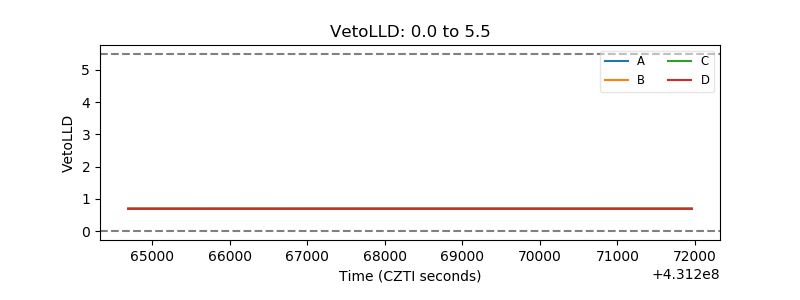 |
| Alpha Counter | 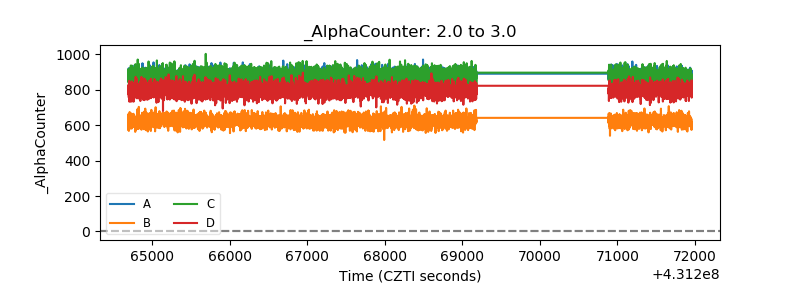 |
| _CPM_Rate | 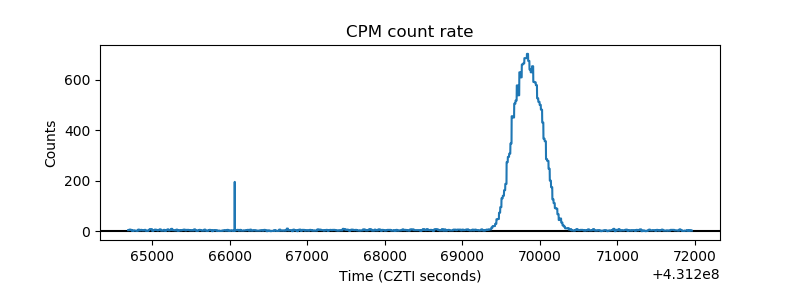 |
| CZT Counter | 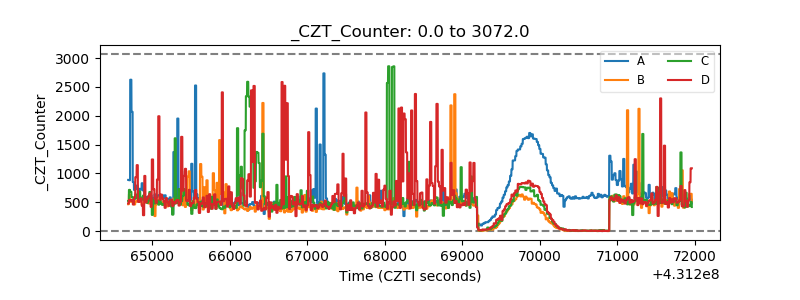 |
| +2.5 Volts monitor | 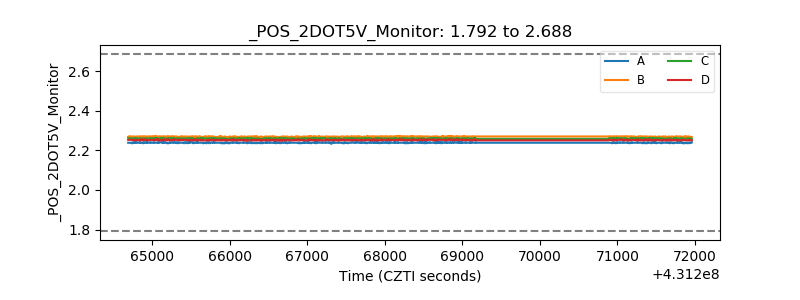 |
| +5 Volts monitor |  |
| _ROLL_ROT | 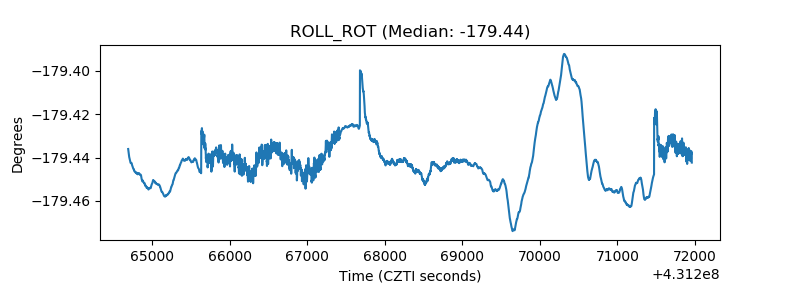 |
| _Roll_DEC | 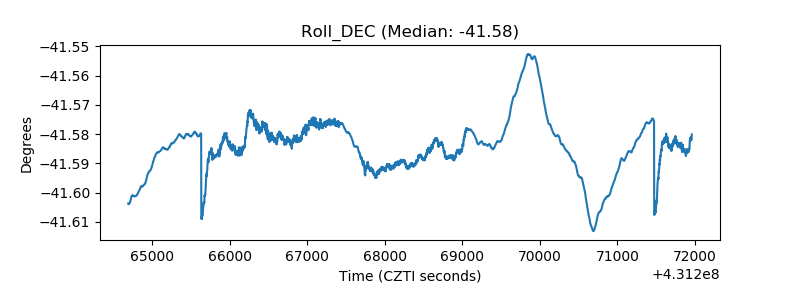 |
| _Roll_RA | 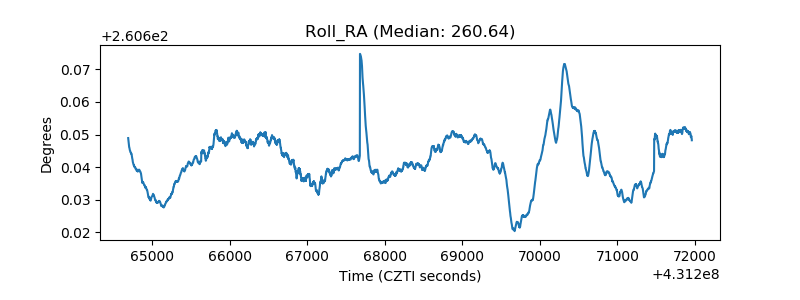 |
| Veto Counter | 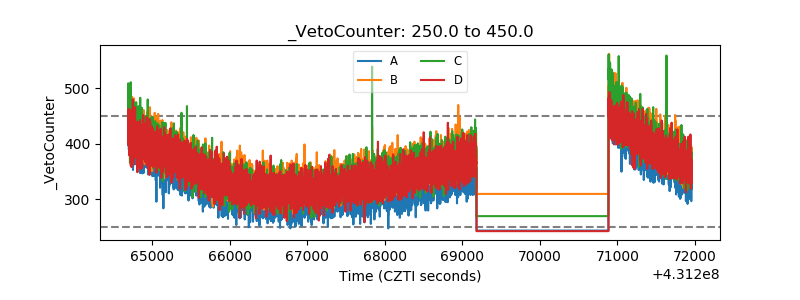 |