| Param | Original file | Final file |
|---|---|---|
| Filename | modeM0/AS1T05_138T01_9000005828_42863cztM0_level2.fits | modeM0/AS1T05_138T01_9000005828_42863cztM0_level2_quad_clean.evt |
| Size (bytes) | 358,580,160 | 93,332,160 |
| Size | 342.0 MB | 89.0 MB |
| Events in quadrant A | 3,342,362 | 625,041 |
| Events in quadrant B | 2,701,114 | 638,750 |
| Events in quadrant C | 2,735,998 | 635,756 |
| Events in quadrant D | 4,068,418 | 544,149 |
| Mode M0 | |||
|---|---|---|---|
| Quadrant | BADHDUFLAG | Total packets | Discarded packets |
| A | 0 | 13329 | 2 |
| B | 0 | 11685 | 2 |
| C | 0 | 11573 | 2 |
| D | 0 | 15722 | 2 |
| Mode M9 | |||
|---|---|---|---|
| Quadrant | BADHDUFLAG | Total packets | Discarded packets |
| A | 0 | 23 | 0 |
| B | 0 | 24 | 0 |
| C | 0 | 24 | 0 |
| D | 0 | 24 | 0 |
| Mode SS | |||
|---|---|---|---|
| Quadrant | BADHDUFLAG | Total packets | Discarded packets |
| A | 0 | 110 | 0 |
| B | 0 | 110 | 0 |
| C | 0 | 110 | 0 |
| D | 0 | 110 | 0 |
| Quadrant | Total seconds | Saturated seconds | Saturation percentage |
|---|---|---|---|
| A | 5467 | 66 | 1.207243% |
| B | 5467 | 39 | 0.713371% |
| C | 5467 | 17 | 0.310957% |
| D | 5467 | 393 | 7.188586% |
Noise dominated data is calculated using 1-second bins in cleaned event files. If a bin has >2000 counts, and if more than 50% of those come from <1% of pixels, then it is considered to be noise-dominated and hence unusable.
| Quadrant | # 1 sec bins | Bins with >0 counts | Bins with >2000 counts | High rate bins dominated by noise | Noise dominated (total time) | Noise dominated (detector-on time) | Marked lightcurve |
|---|---|---|---|---|---|---|---|
| A | 7289 | 5468 | 36 | 36 | 0.49% | 0.66% | 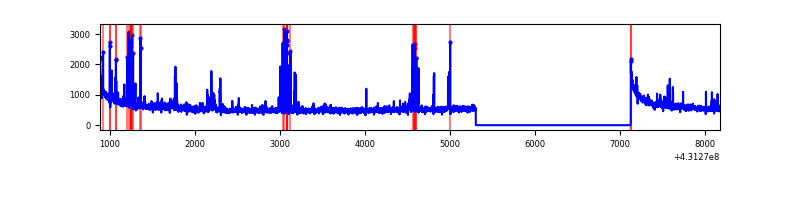 |
| B | 7289 | 5468 | 22 | 22 | 0.30% | 0.40% | 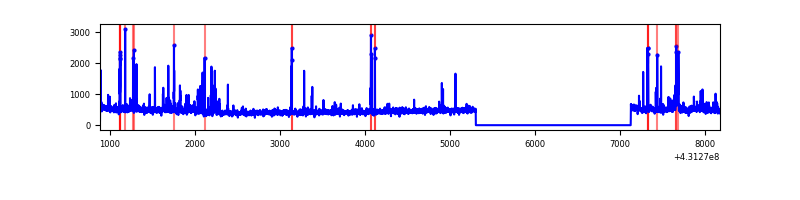 |
| C | 7289 | 5468 | 10 | 10 | 0.14% | 0.18% | 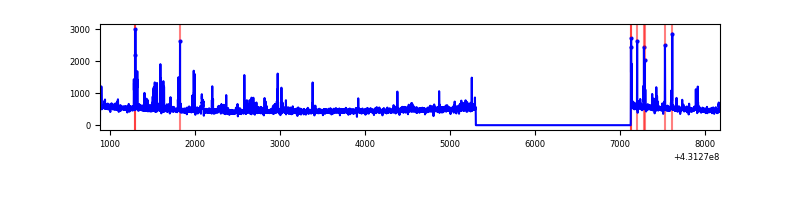 |
| D | 7289 | 5468 | 354 | 354 | 4.86% | 6.47% | 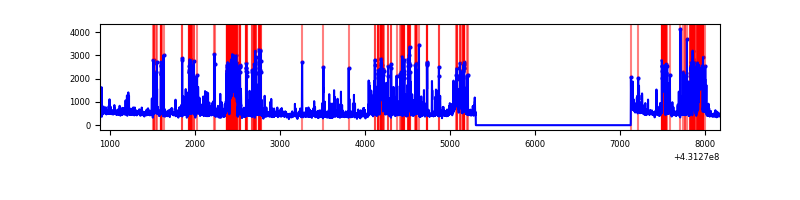 |
Top three noisy pixels from each quadrant. If the there are fewer than three noisy pixels in the level2.evt file, extra rows are filled as -1
| Pixel properties | Quadrant properties | ||||||
|---|---|---|---|---|---|---|---|
| Quadrant | DetID | PixID | Counts | Sigma | Mean | Median | Sigma |
| A | 10 | 83 | 643163 | 5137.99 | 607 | 595 | 125.1 |
| A | 15 | 237 | 159276 | 1268.82 | 607 | 595 | 125.1 |
| A | 12 | 189 | 104761 | 832.91 | 607 | 595 | 125.1 |
| B | 5 | 172 | 104172 | 884.04 | 604 | 588 | 117.2 |
| B | 4 | 67 | 86639 | 734.4 | 604 | 588 | 117.2 |
| B | 0 | 190 | 30163 | 252.41 | 604 | 588 | 117.2 |
| C | 15 | 214 | 224334 | 1607.14 | 592 | 596 | 139.2 |
| C | 12 | 2 | 67936 | 483.71 | 592 | 596 | 139.2 |
| C | 2 | 16 | 53198 | 377.85 | 592 | 596 | 139.2 |
| D | 10 | 118 | 837087 | 5865.15 | 574 | 559 | 142.6 |
| D | 12 | 6 | 432189 | 3026.29 | 574 | 559 | 142.6 |
| D | 12 | 233 | 130244 | 909.26 | 574 | 559 | 142.6 |
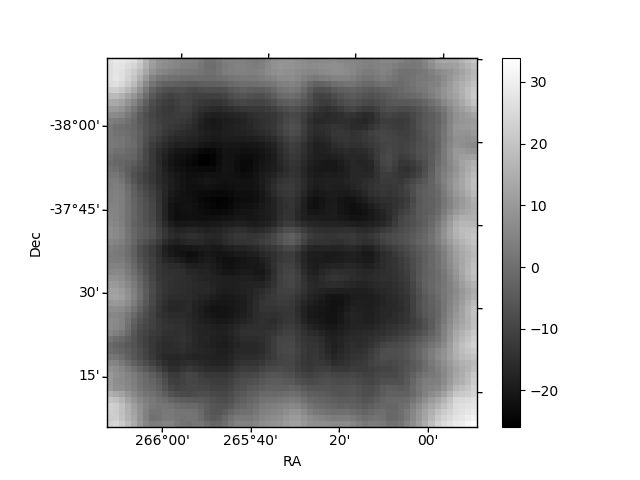
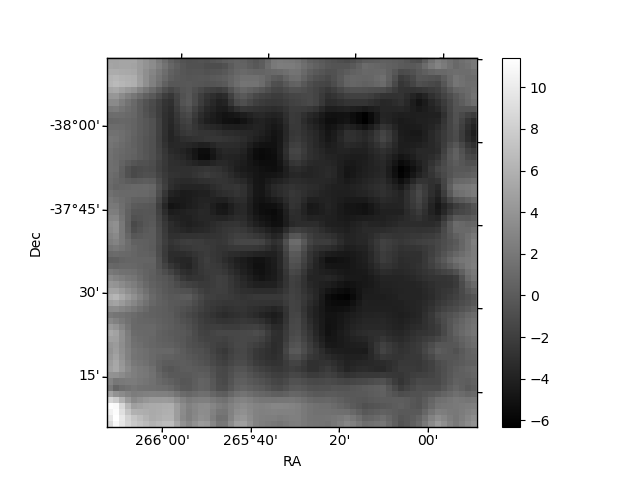
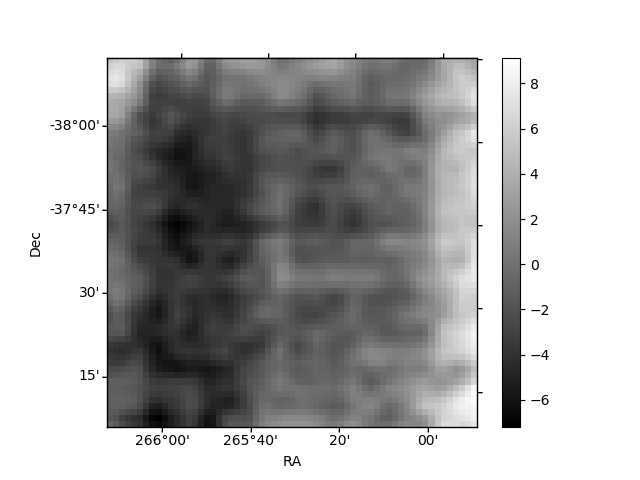
Histogram calculated using DETX and DETY for each event in the final _common_clean file
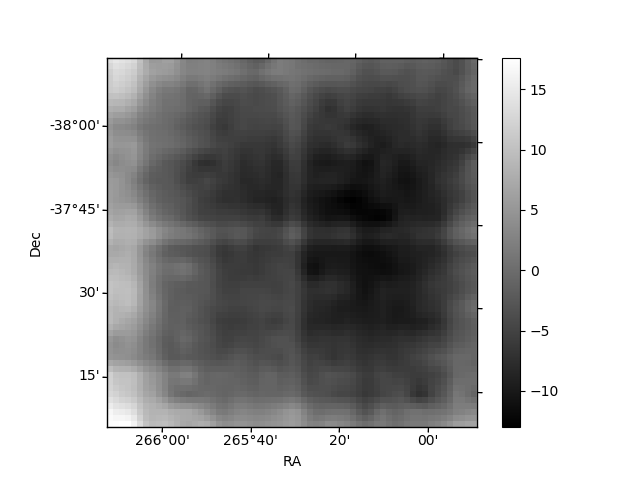
| Quadrant A | 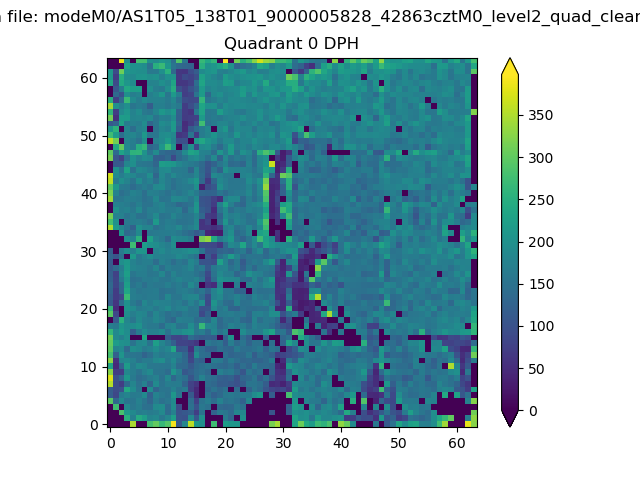 |
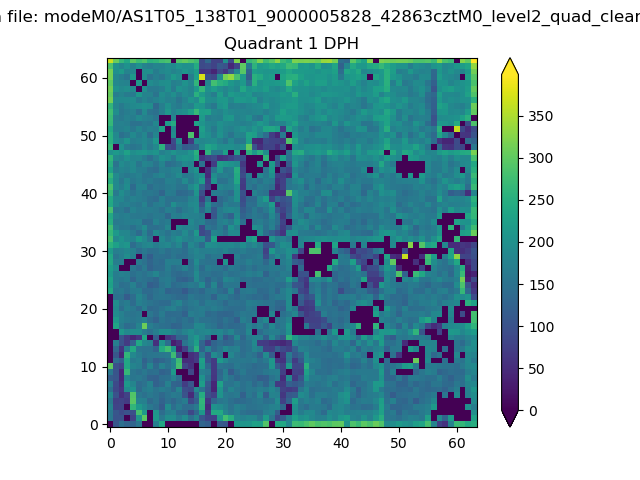 |
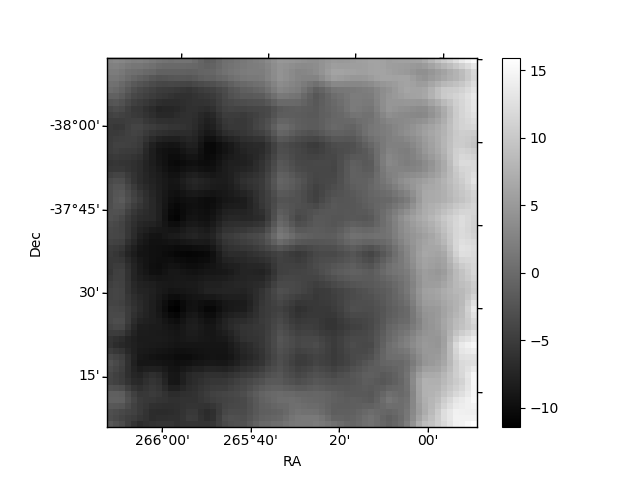
Quadrant B |
|---|---|---|---|
| Quadrant D | 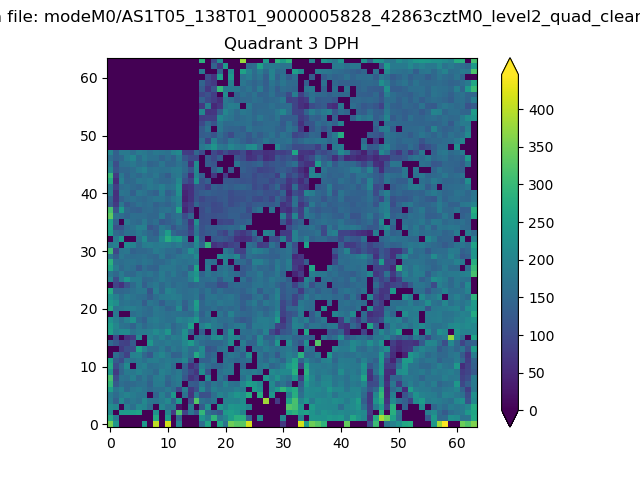 |
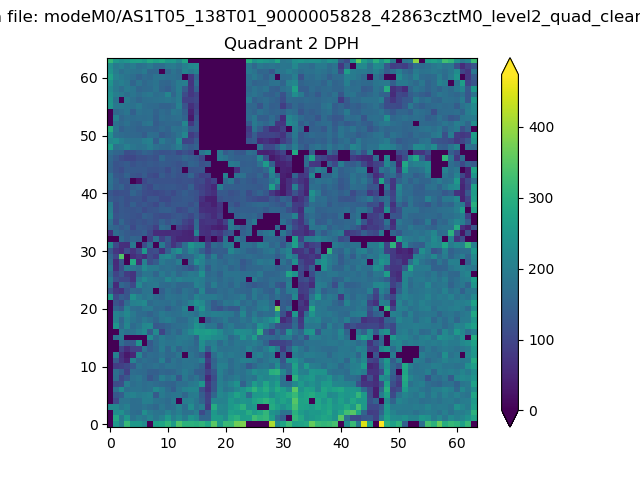 |
Quadrant C |
| Plot type | Count rate plots | Images |
|---|---|---|
| Comparison with Poisson distribution Blue bars denote a histogram of data divided into 1 sec bins. Red curve is a Poisson curve with rate = median count rate of data. |
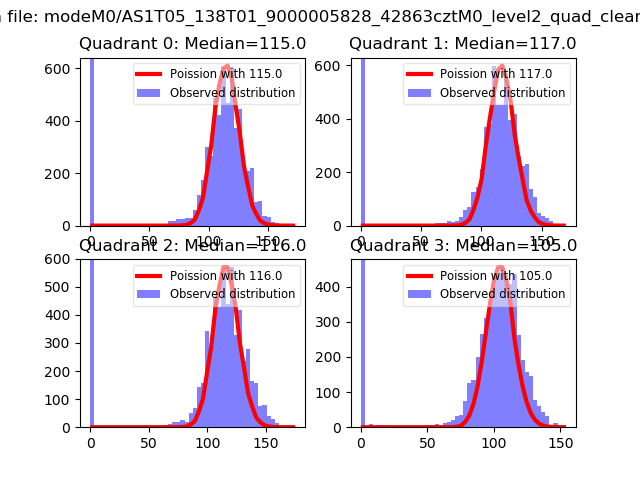 |
 |
| Quadrant-wise count rates Data is divided into 100 sec bins |
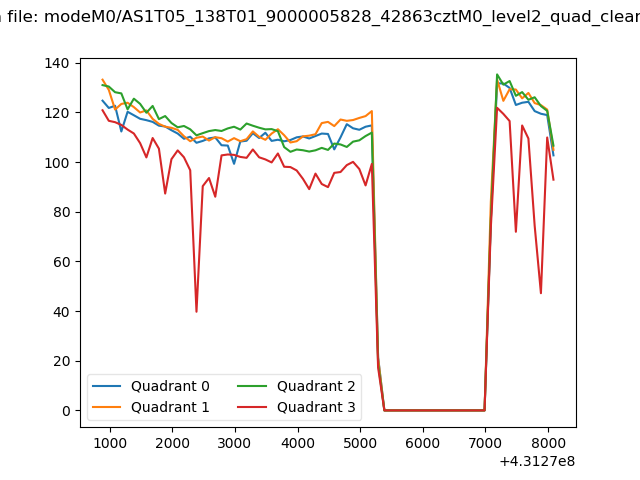 |
|
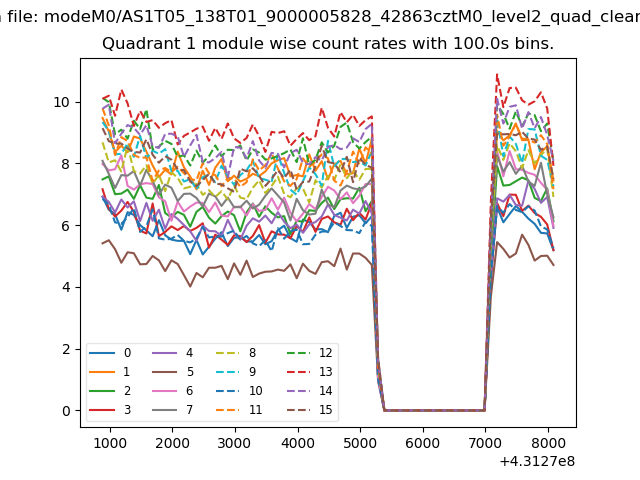
| Module-wise count rates for Quadrant A Data is divided into 100 sec bins |
 |
 |
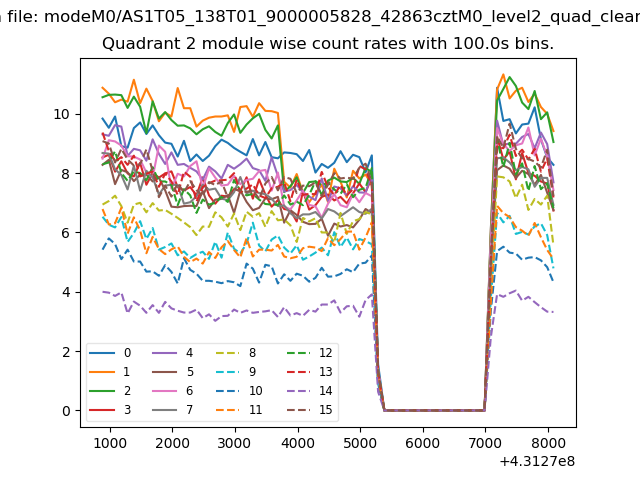
| Module-wise count rates for Quadrant B Data is divided into 100 sec bins |
 |
 |
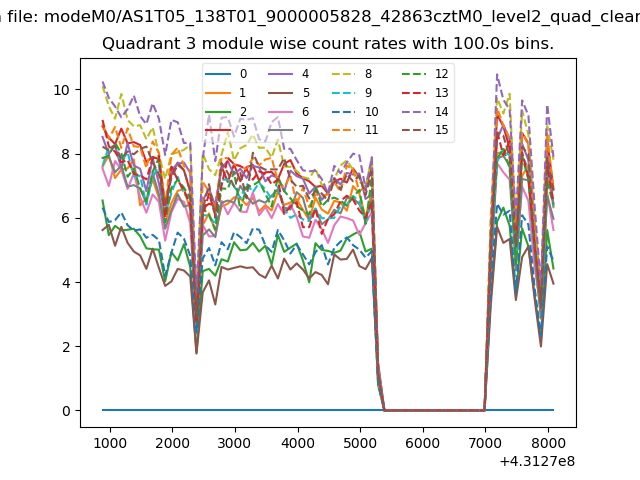
| Module-wise count rates for Quadrant C Data is divided into 100 sec bins |
 |
 |
| Module-wise count rates for Quadrant D Data is divided into 100 sec bins |
 |
 |
| Parameter | Plot |
|---|---|
| CZT HV Monitor | 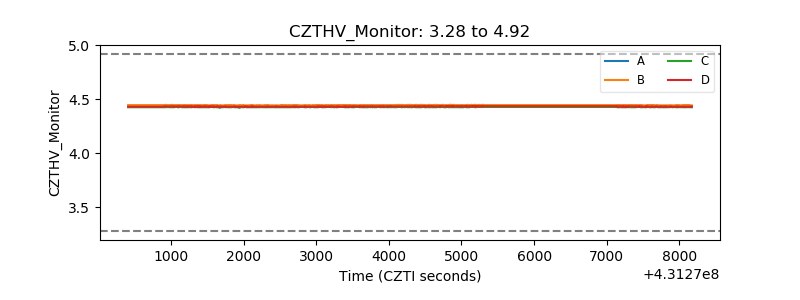 |
| D_VDD | 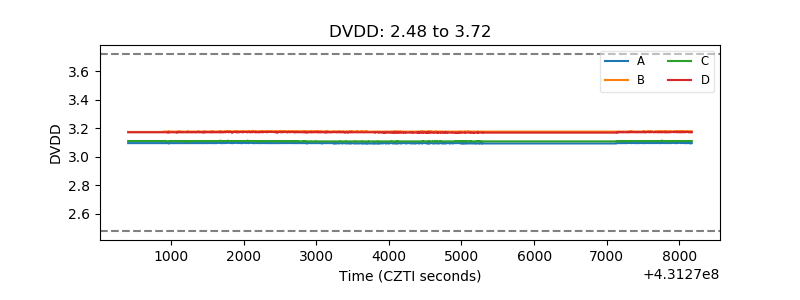 |
| Temperature 1 | 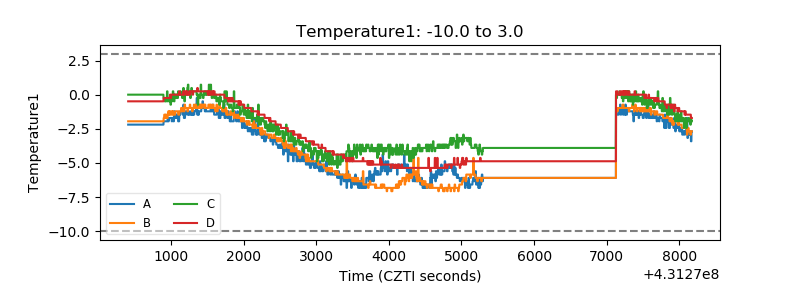 |
| Veto HV Monitor | 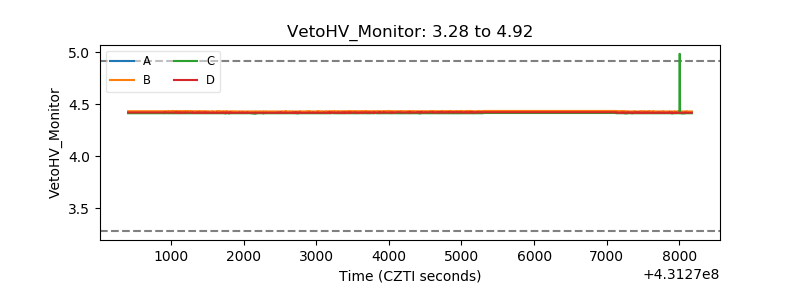 |
| Veto LLD | 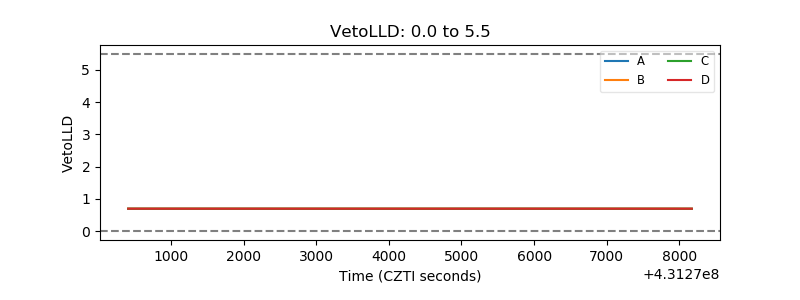 |
| Alpha Counter | 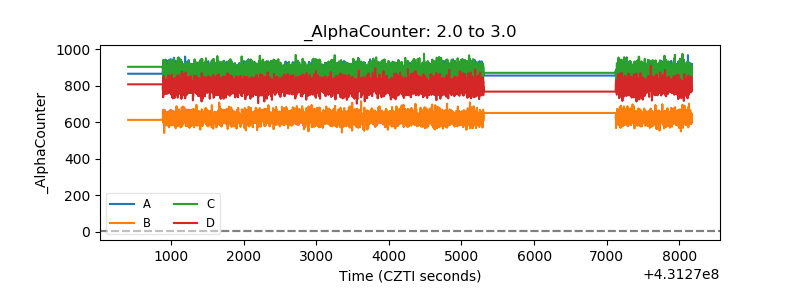 |
| _CPM_Rate | 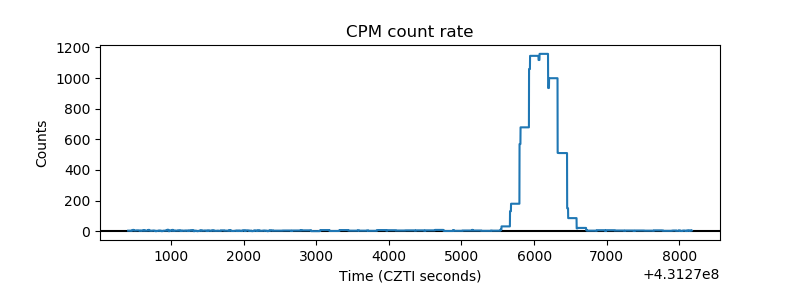 |
| CZT Counter | 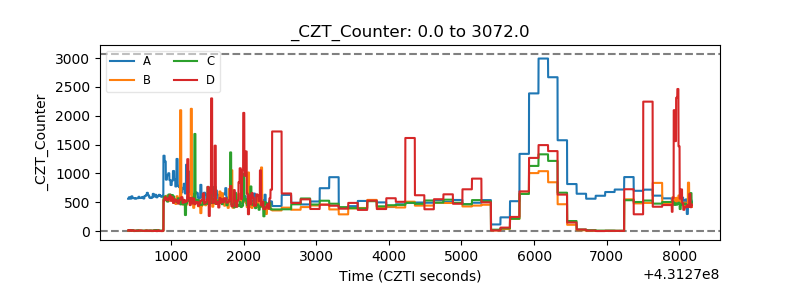 |
| +2.5 Volts monitor | 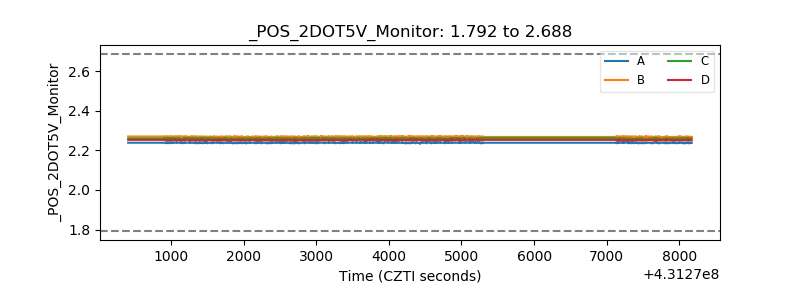 |
| +5 Volts monitor |  |
| _ROLL_ROT | 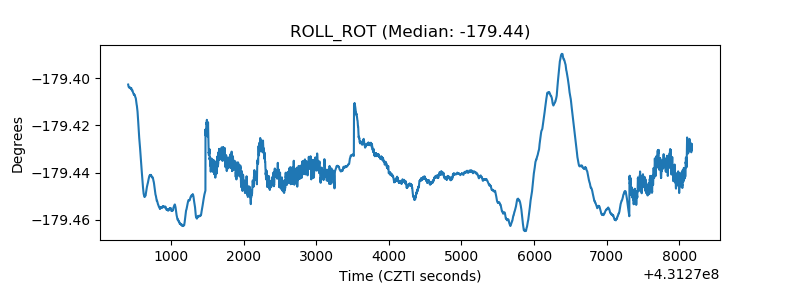 |
| _Roll_DEC | 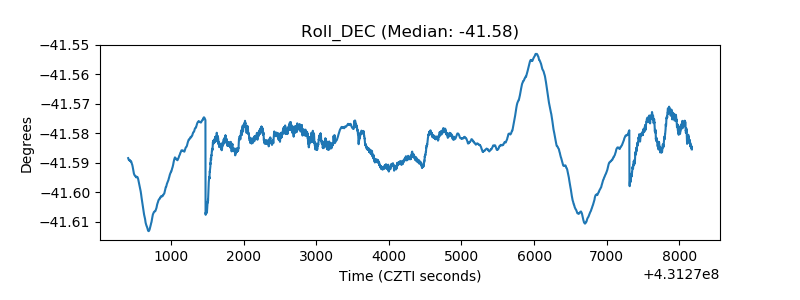 |
| _Roll_RA | 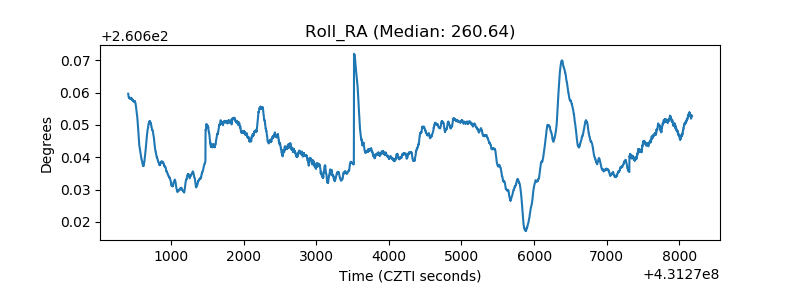 |
| Veto Counter | 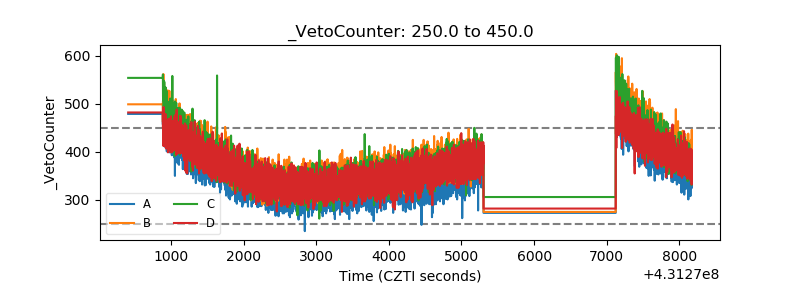 |