| Param | Original file | Final file |
|---|---|---|
| Filename | modeM0/AS1T05_138T01_9000005828_42864cztM0_level2.fits | modeM0/AS1T05_138T01_9000005828_42864cztM0_level2_quad_clean.evt |
| Size (bytes) | 347,149,440 | 90,613,440 |
| Size | 331.1 MB | 86.4 MB |
| Events in quadrant A | 3,435,272 | 610,758 |
| Events in quadrant B | 2,571,023 | 626,446 |
| Events in quadrant C | 2,874,301 | 607,596 |
| Events in quadrant D | 3,562,735 | 532,883 |
| Mode M0 | |||
|---|---|---|---|
| Quadrant | BADHDUFLAG | Total packets | Discarded packets |
| A | 0 | 13431 | 2 |
| B | 0 | 11119 | 2 |
| C | 0 | 11835 | 2 |
| D | 0 | 14208 | 2 |
| Mode M9 | |||
|---|---|---|---|
| Quadrant | BADHDUFLAG | Total packets | Discarded packets |
| A | 0 | 19 | 0 |
| B | 0 | 19 | 0 |
| C | 0 | 19 | 0 |
| D | 0 | 19 | 0 |
| Mode SS | |||
|---|---|---|---|
| Quadrant | BADHDUFLAG | Total packets | Discarded packets |
| A | 0 | 106 | 0 |
| B | 0 | 106 | 0 |
| C | 0 | 106 | 0 |
| D | 0 | 106 | 0 |
| Quadrant | Total seconds | Saturated seconds | Saturation percentage |
|---|---|---|---|
| A | 5226 | 76 | 1.454267% |
| B | 5227 | 46 | 0.880046% |
| C | 5227 | 95 | 1.817486% |
| D | 5227 | 296 | 5.662904% |
Noise dominated data is calculated using 1-second bins in cleaned event files. If a bin has >2000 counts, and if more than 50% of those come from <1% of pixels, then it is considered to be noise-dominated and hence unusable.
| Quadrant | # 1 sec bins | Bins with >0 counts | Bins with >2000 counts | High rate bins dominated by noise | Noise dominated (total time) | Noise dominated (detector-on time) | Marked lightcurve |
|---|---|---|---|---|---|---|---|
| A | 7169 | 5227 | 67 | 67 | 0.93% | 1.28% | 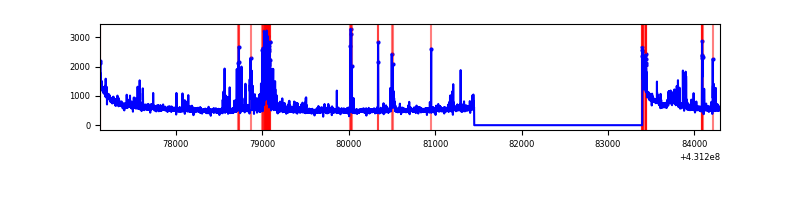 |
| B | 7170 | 5228 | 23 | 23 | 0.32% | 0.44% | 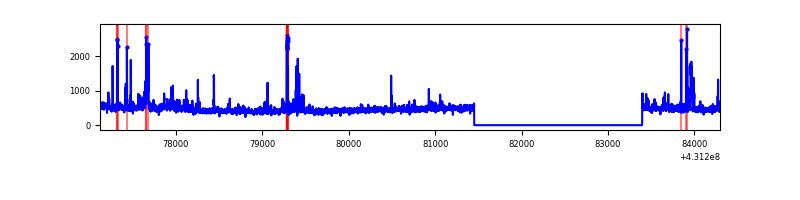 |
| C | 7170 | 5228 | 83 | 83 | 1.16% | 1.59% | 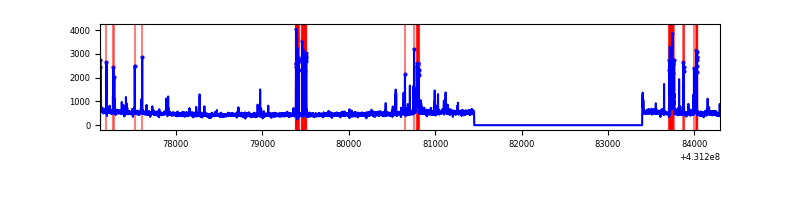 |
| D | 7170 | 5228 | 266 | 266 | 3.71% | 5.09% | 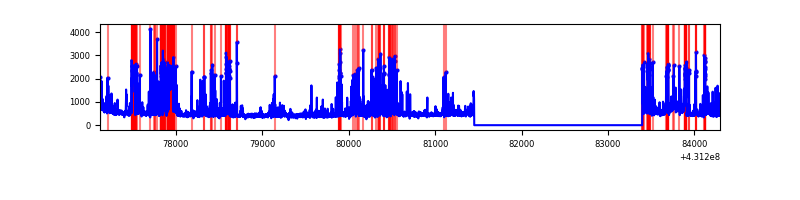 |
Top three noisy pixels from each quadrant. If the there are fewer than three noisy pixels in the level2.evt file, extra rows are filled as -1
| Pixel properties | Quadrant properties | ||||||
|---|---|---|---|---|---|---|---|
| Quadrant | DetID | PixID | Counts | Sigma | Mean | Median | Sigma |
| A | 10 | 83 | 620225 | 5163.68 | 586 | 576 | 120.0 |
| A | 13 | 248 | 303958 | 2528.15 | 586 | 576 | 120.0 |
| A | 12 | 189 | 110767 | 918.25 | 586 | 576 | 120.0 |
| B | 4 | 67 | 106562 | 936.82 | 584 | 567 | 113.1 |
| B | 5 | 172 | 62381 | 546.33 | 584 | 567 | 113.1 |
| B | 0 | 245 | 34611 | 300.89 | 584 | 567 | 113.1 |
| C | 15 | 214 | 210284 | 1565.76 | 567 | 570 | 133.9 |
| C | 5 | 250 | 121172 | 900.44 | 567 | 570 | 133.9 |
| C | 2 | 16 | 110396 | 819.98 | 567 | 570 | 133.9 |
| D | 10 | 118 | 700932 | 5107.02 | 552 | 536 | 137.1 |
| D | 12 | 6 | 325409 | 2368.85 | 552 | 536 | 137.1 |
| D | 12 | 233 | 97978 | 710.51 | 552 | 536 | 137.1 |
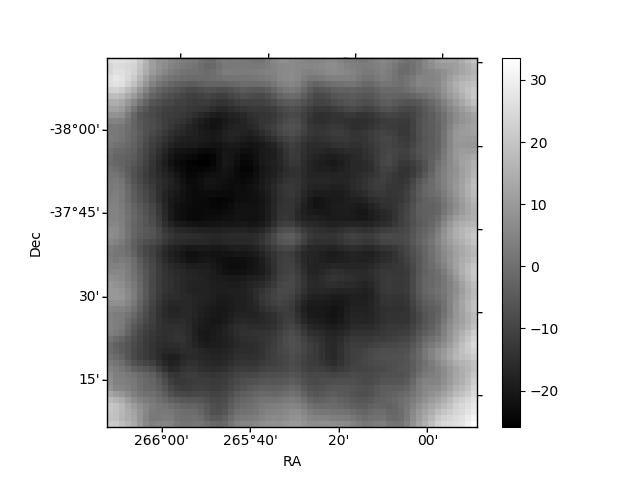
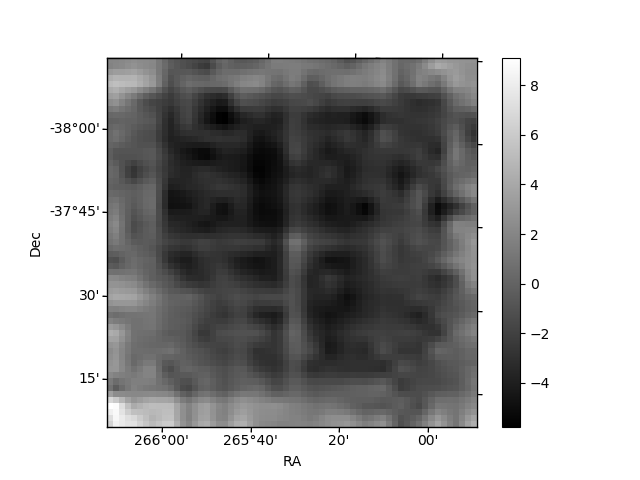
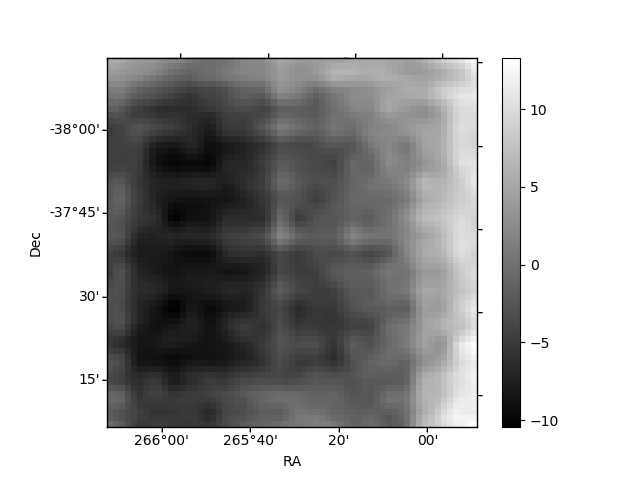
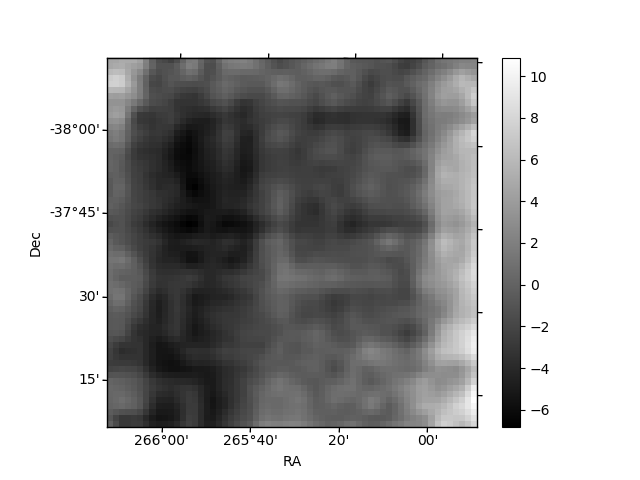
Histogram calculated using DETX and DETY for each event in the final _common_clean file
| Quadrant A | 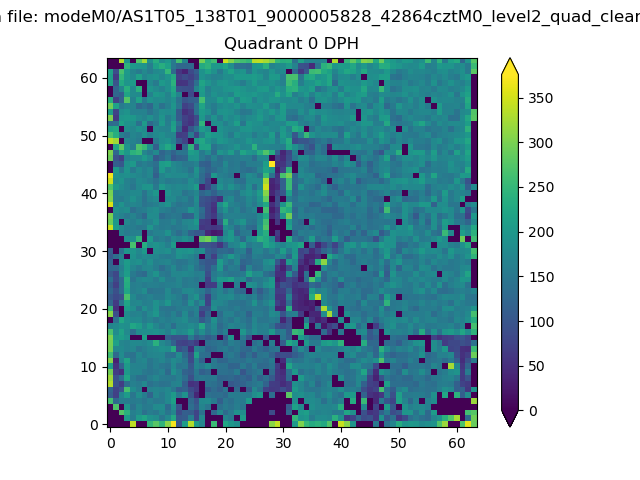 |
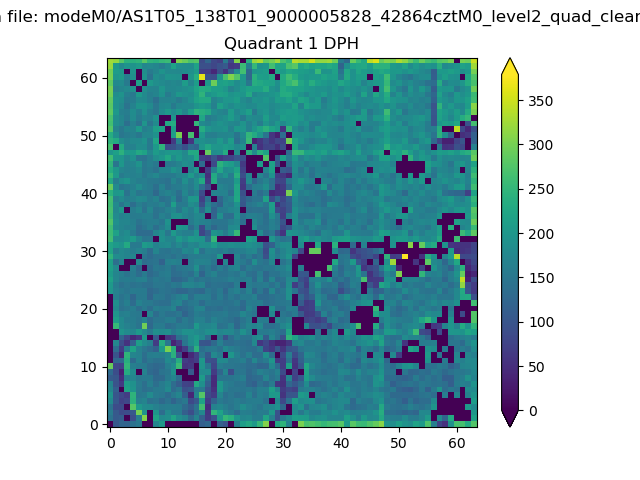 |
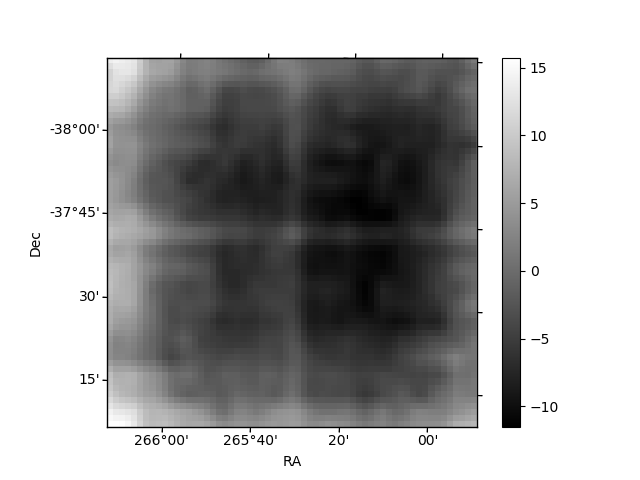
Quadrant B |
|---|---|---|---|
| Quadrant D | 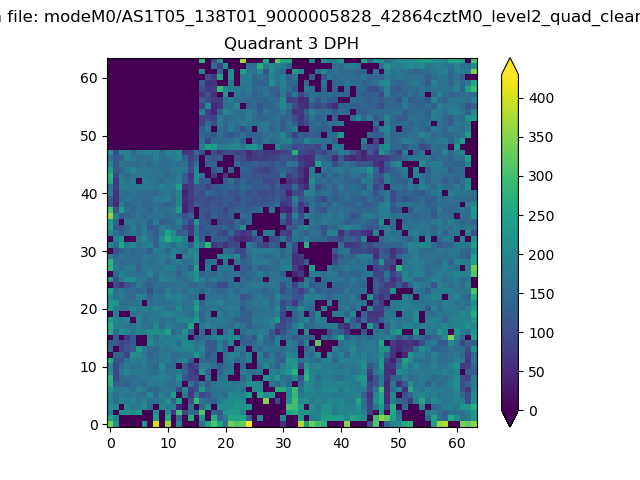 |
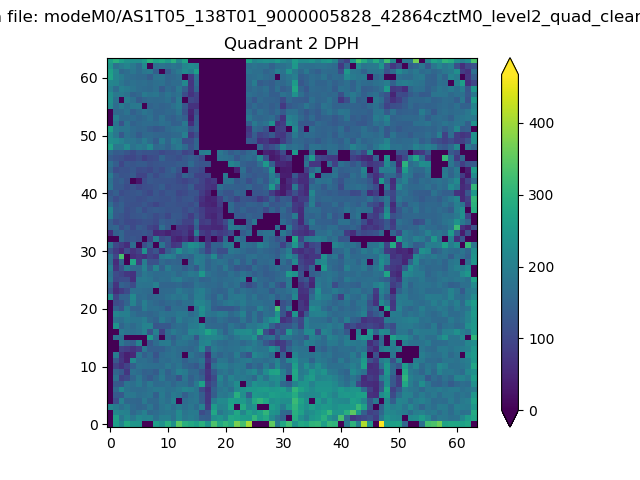 |
Quadrant C |
| Plot type | Count rate plots | Images |
|---|---|---|
| Comparison with Poisson distribution Blue bars denote a histogram of data divided into 1 sec bins. Red curve is a Poisson curve with rate = median count rate of data. |
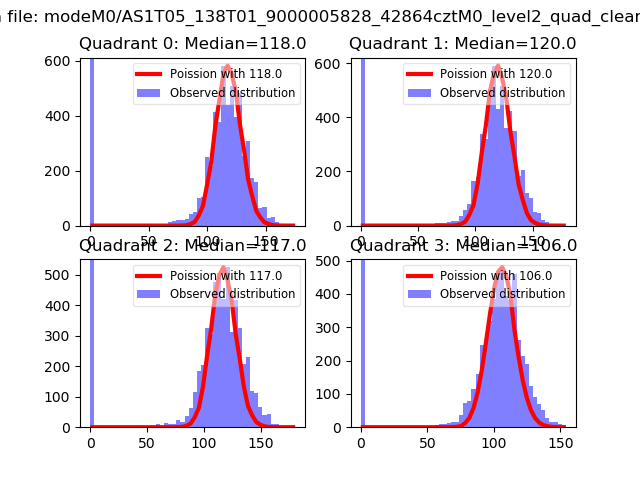 |
 |
| Quadrant-wise count rates Data is divided into 100 sec bins |
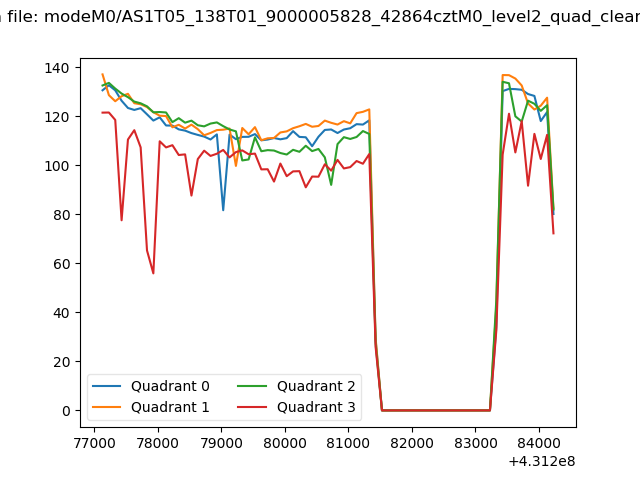 |
|
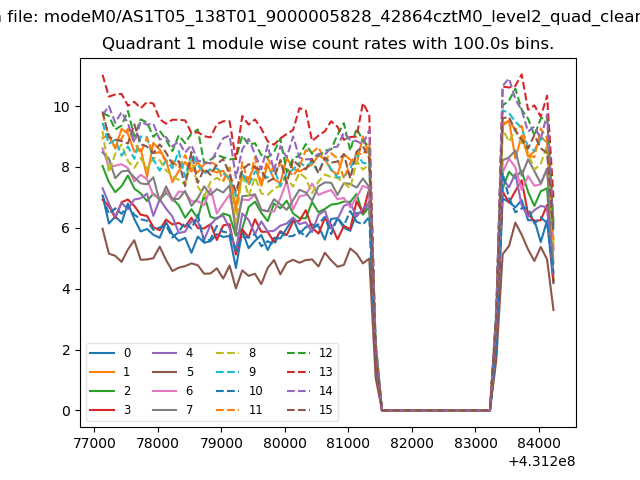
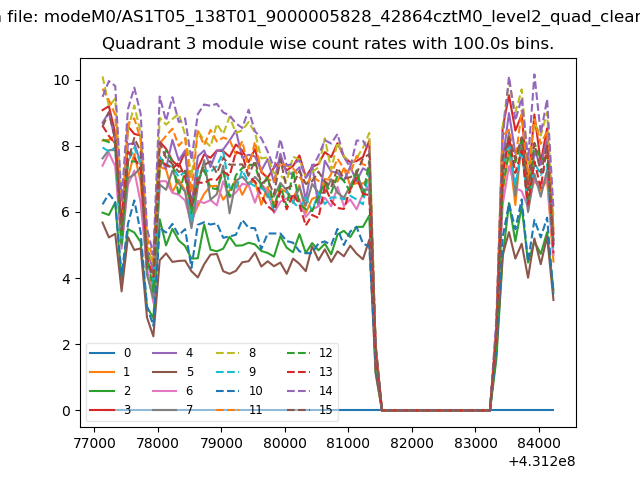
| Module-wise count rates for Quadrant A Data is divided into 100 sec bins |
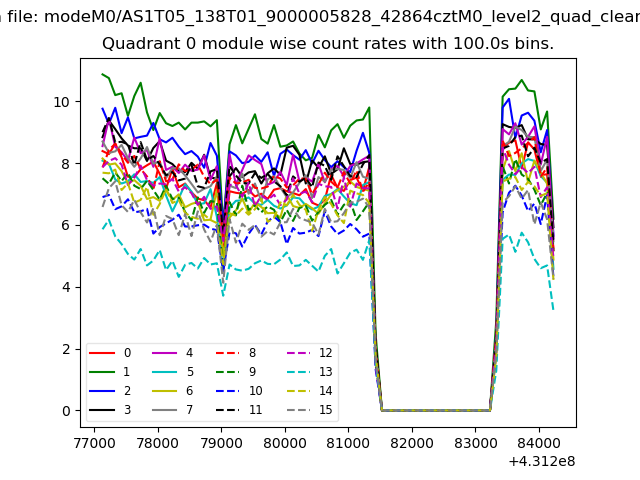 |
 |
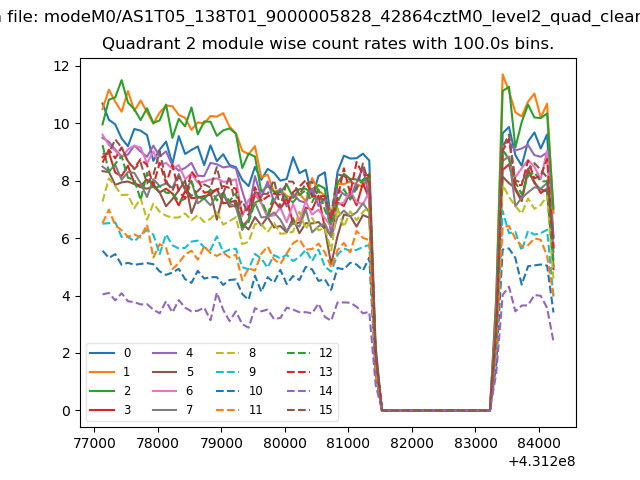
| Module-wise count rates for Quadrant B Data is divided into 100 sec bins |
 |
 |
| Module-wise count rates for Quadrant C Data is divided into 100 sec bins |
 |
 |
| Module-wise count rates for Quadrant D Data is divided into 100 sec bins |
 |
 |
| Parameter | Plot |
|---|---|
| CZT HV Monitor |  |
| D_VDD | 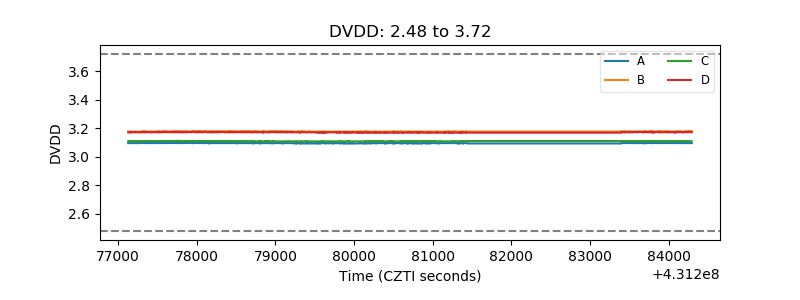 |
| Temperature 1 | 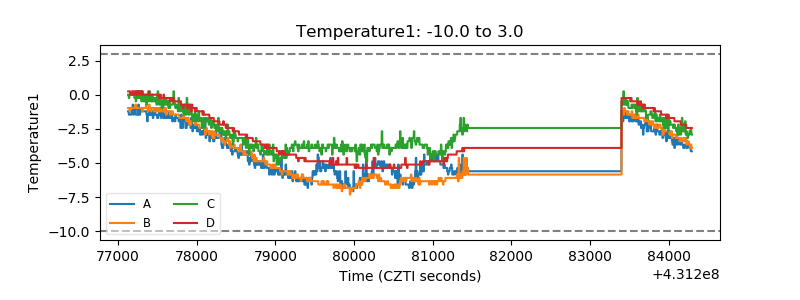 |
| Veto HV Monitor | 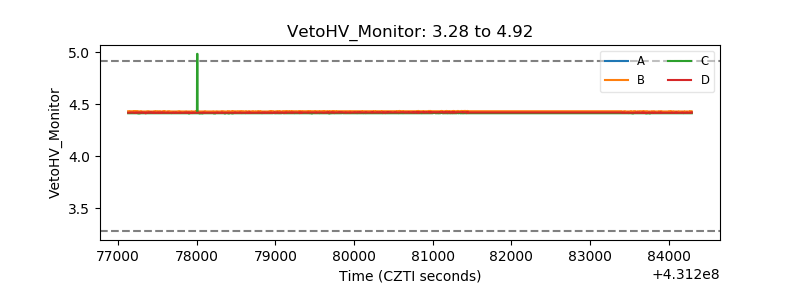 |
| Veto LLD |  |
| Alpha Counter | 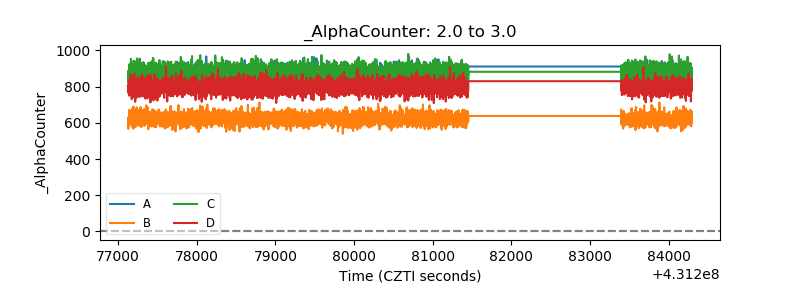 |
| _CPM_Rate | 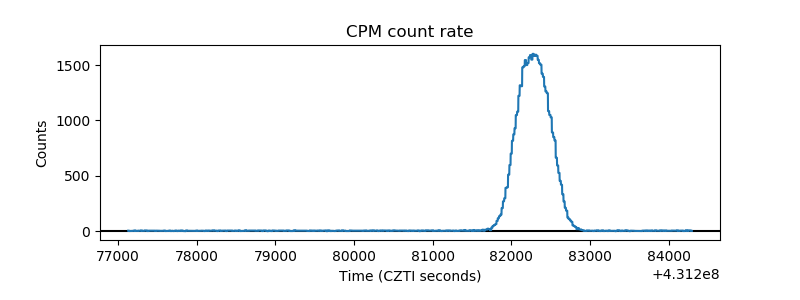 |
| CZT Counter | 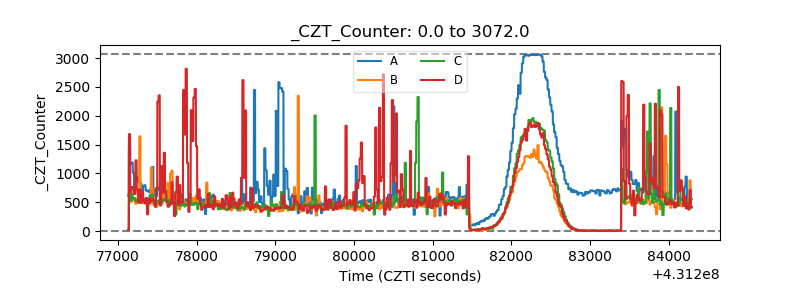 |
| +2.5 Volts monitor | 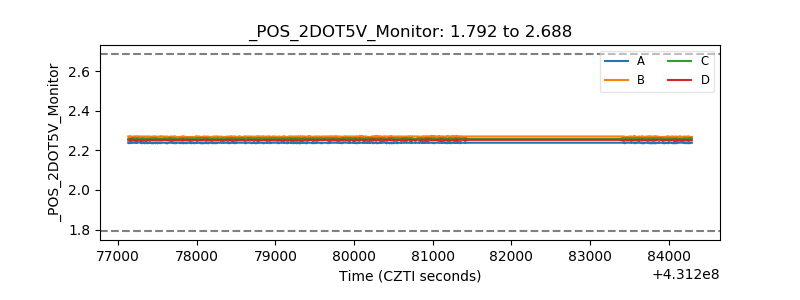 |
| +5 Volts monitor | 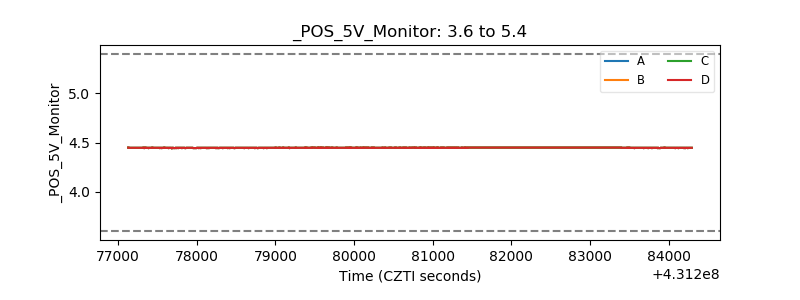 |
| _ROLL_ROT | 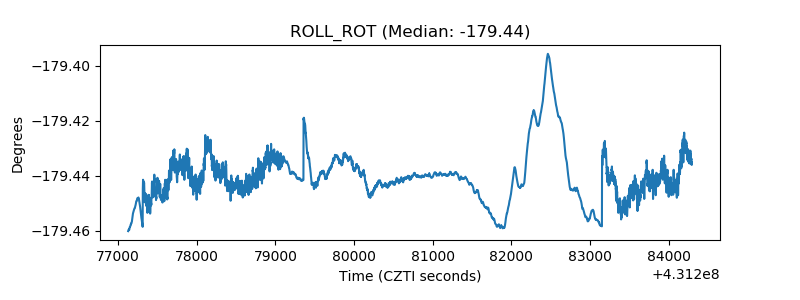 |
| _Roll_DEC | 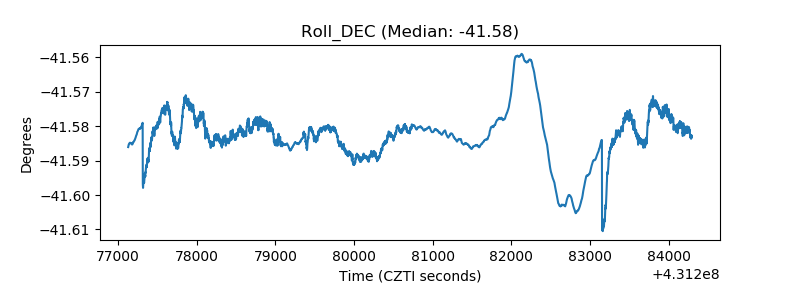 |
| _Roll_RA | 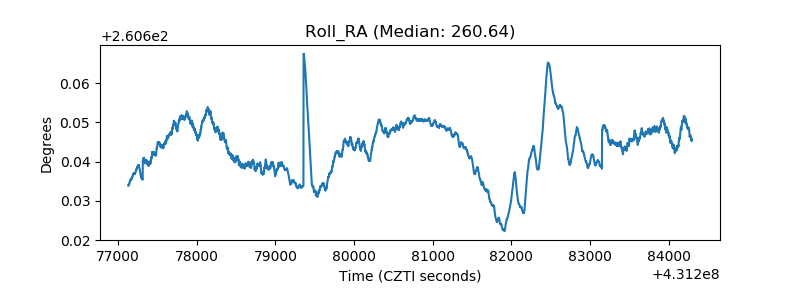 |
| Veto Counter | 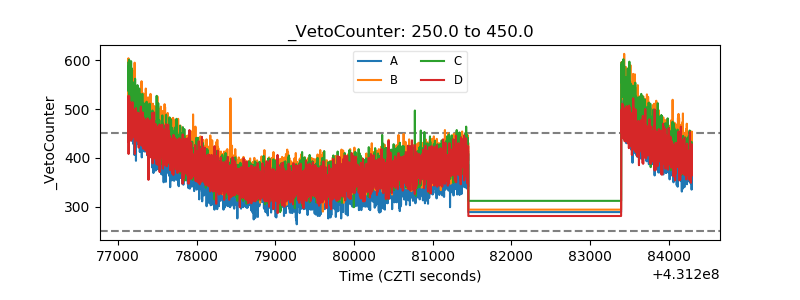 |