| Param | Original file | Final file |
|---|---|---|
| Filename | modeM0/AS1T05_138T01_9000005828_42865cztM0_level2.fits | modeM0/AS1T05_138T01_9000005828_42865cztM0_level2_quad_clean.evt |
| Size (bytes) | 1,606,636,800 | 414,895,680 |
| Size | 1.5 GB | 395.7 MB |
| Events in quadrant A | 14,728,091 | 2,762,828 |
| Events in quadrant B | 11,798,019 | 2,849,884 |
| Events in quadrant C | 13,279,646 | 2,801,513 |
| Events in quadrant D | 17,756,311 | 2,448,985 |
| Mode M0 | |||
|---|---|---|---|
| Quadrant | BADHDUFLAG | Total packets | Discarded packets |
| A | 0 | 58557 | 6 |
| B | 0 | 52083 | 6 |
| C | 0 | 54961 | 6 |
| D | 0 | 69493 | 8 |
| Mode M9 | |||
|---|---|---|---|
| Quadrant | BADHDUFLAG | Total packets | Discarded packets |
| A | 0 | 106 | 0 |
| B | 0 | 106 | 0 |
| C | 0 | 106 | 0 |
| D | 0 | 106 | 0 |
| Mode SS | |||
|---|---|---|---|
| Quadrant | BADHDUFLAG | Total packets | Discarded packets |
| A | 0 | 504 | 0 |
| B | 0 | 504 | 0 |
| C | 0 | 504 | 0 |
| D | 0 | 504 | 0 |
| Quadrant | Total seconds | Saturated seconds | Saturation percentage |
|---|---|---|---|
| A | 24702 | 340 | 1.376407% |
| B | 24702 | 154 | 0.623431% |
| C | 24702 | 299 | 1.210428% |
| D | 24701 | 1466 | 5.934982% |
Noise dominated data is calculated using 1-second bins in cleaned event files. If a bin has >2000 counts, and if more than 50% of those come from <1% of pixels, then it is considered to be noise-dominated and hence unusable.
| Quadrant | # 1 sec bins | Bins with >0 counts | Bins with >2000 counts | High rate bins dominated by noise | Noise dominated (total time) | Noise dominated (detector-on time) | Marked lightcurve |
|---|---|---|---|---|---|---|---|
| A | 35245 | 24708 | 251 | 251 | 0.71% | 1.02% | 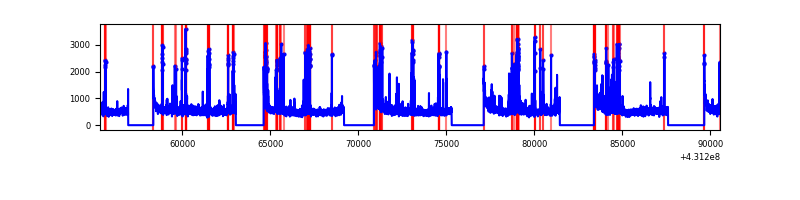 |
| B | 35245 | 24708 | 100 | 100 | 0.28% | 0.40% | 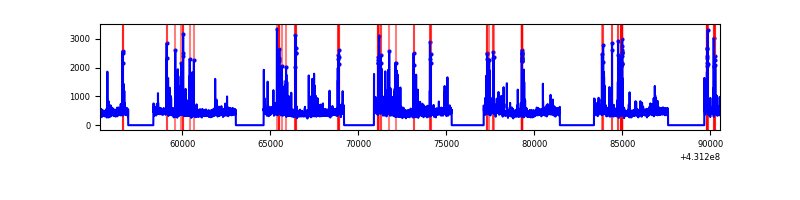 |
| C | 35245 | 24708 | 282 | 282 | 0.80% | 1.14% | 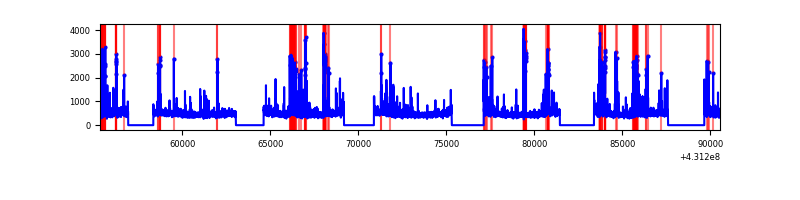 |
| D | 35245 | 24708 | 1450 | 1450 | 4.11% | 5.87% | 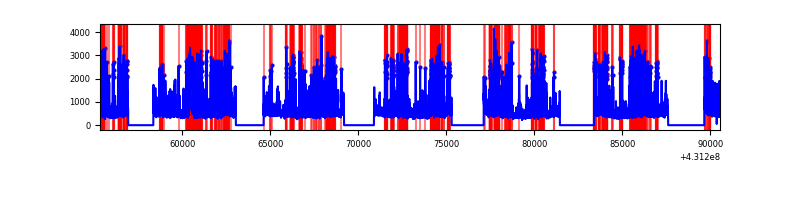 |
Top three noisy pixels from each quadrant. If the there are fewer than three noisy pixels in the level2.evt file, extra rows are filled as -1
| Pixel properties | Quadrant properties | ||||||
|---|---|---|---|---|---|---|---|
| Quadrant | DetID | PixID | Counts | Sigma | Mean | Median | Sigma |
| A | 10 | 83 | 2490716 | 4515.99 | 2706 | 2654 | 550.9 |
| A | 15 | 237 | 698312 | 1262.66 | 2706 | 2654 | 550.9 |
| A | 13 | 248 | 503449 | 908.98 | 2706 | 2654 | 550.9 |
| B | 5 | 172 | 343902 | 660.12 | 2710 | 2634 | 517.0 |
| B | 5 | 255 | 308799 | 592.22 | 2710 | 2634 | 517.0 |
| B | 4 | 67 | 144562 | 274.53 | 2710 | 2634 | 517.0 |
| C | 15 | 214 | 983649 | 1596.73 | 2653 | 2671 | 614.4 |
| C | 14 | 254 | 609241 | 987.31 | 2653 | 2671 | 614.4 |
| C | 7 | 220 | 267038 | 430.31 | 2653 | 2671 | 614.4 |
| D | 10 | 118 | 2161644 | 3433.34 | 2584 | 2521 | 628.9 |
| D | 12 | 6 | 1712495 | 2719.13 | 2584 | 2521 | 628.9 |
| D | 2 | 249 | 1499609 | 2380.6 | 2584 | 2521 | 628.9 |
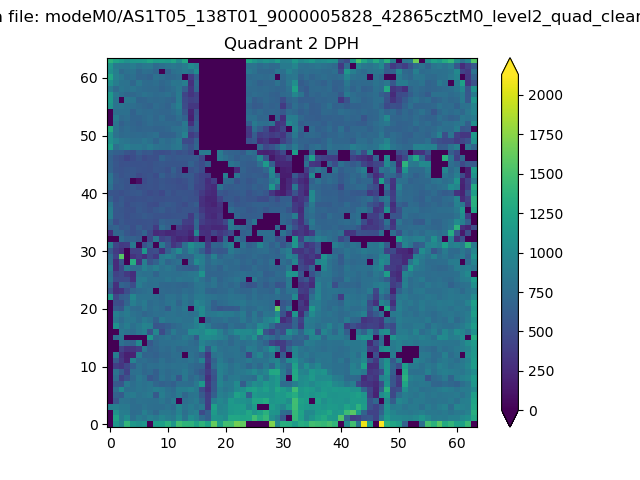
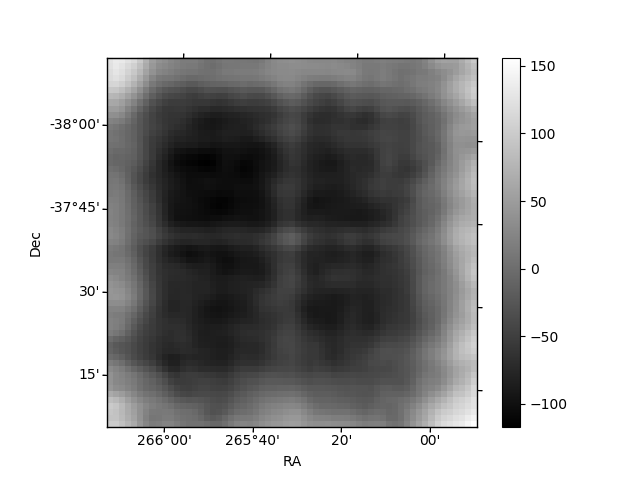
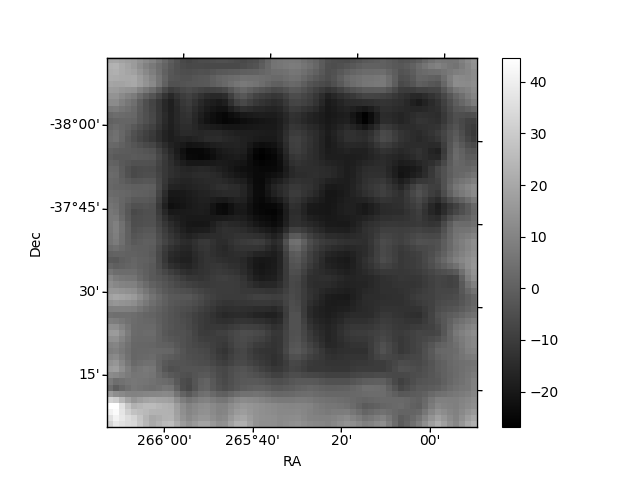
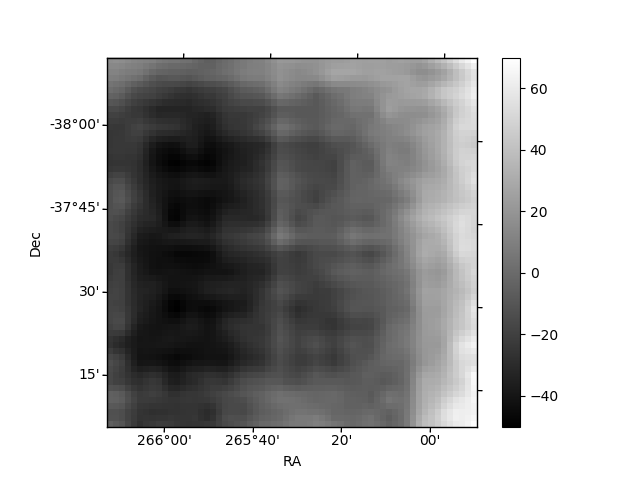
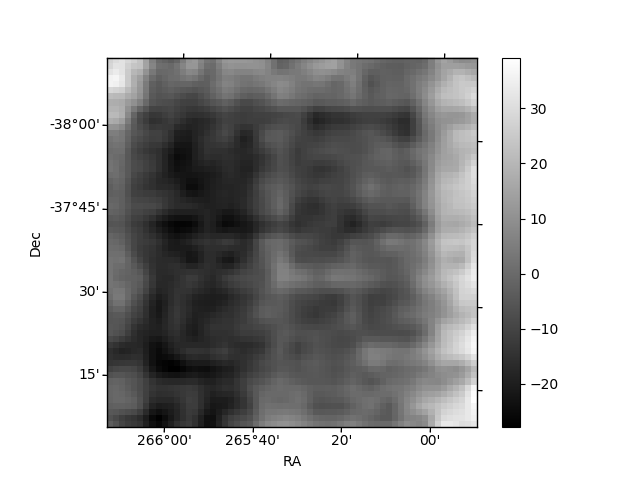
Histogram calculated using DETX and DETY for each event in the final _common_clean file
| Quadrant A | 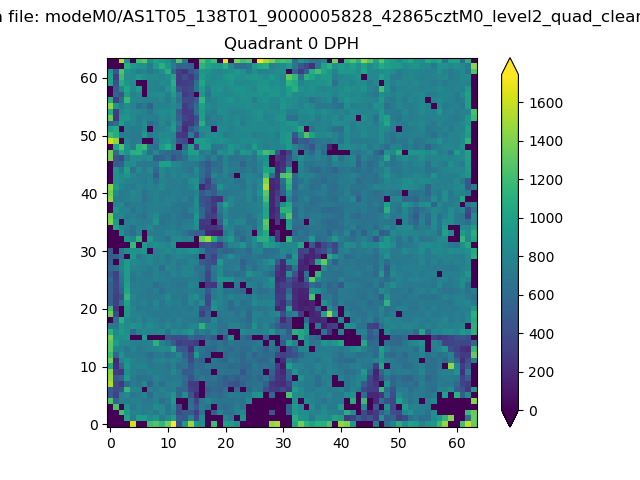 |
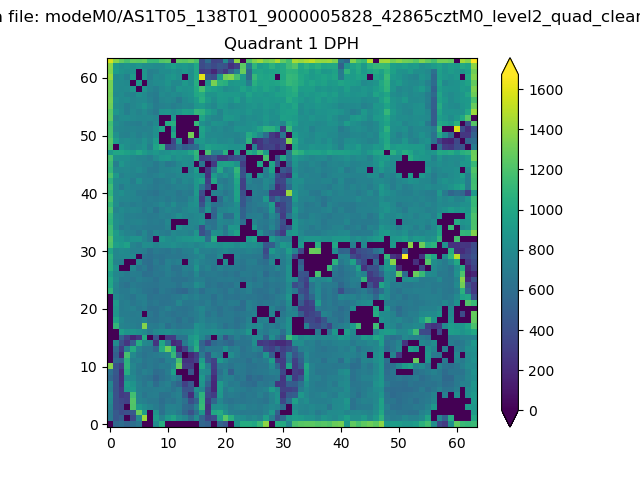 |
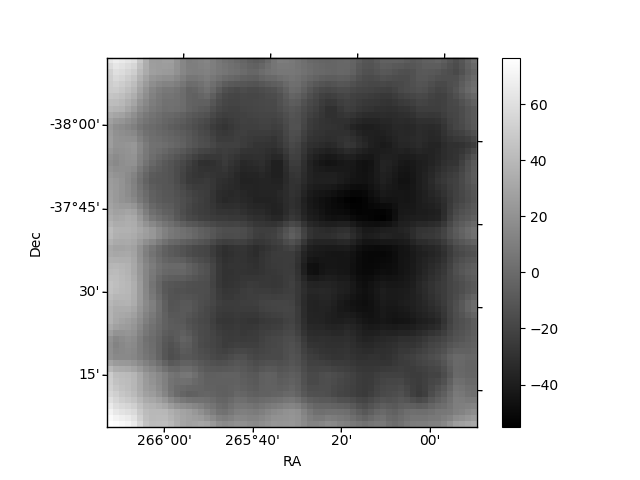
Quadrant B |
|---|---|---|---|
| Quadrant D | 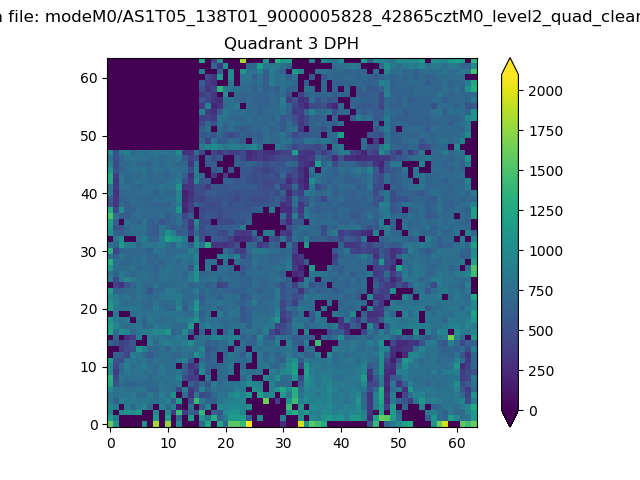 |
 |
Quadrant C |
| Plot type | Count rate plots | Images |
|---|---|---|
| Comparison with Poisson distribution Blue bars denote a histogram of data divided into 1 sec bins. Red curve is a Poisson curve with rate = median count rate of data. |
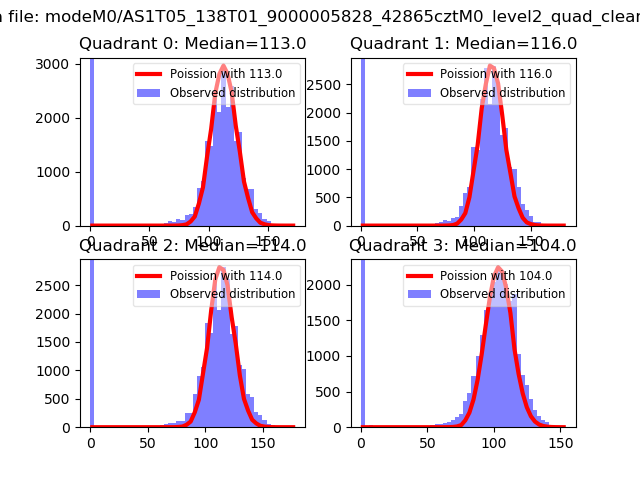 |
 |
| Quadrant-wise count rates Data is divided into 100 sec bins |
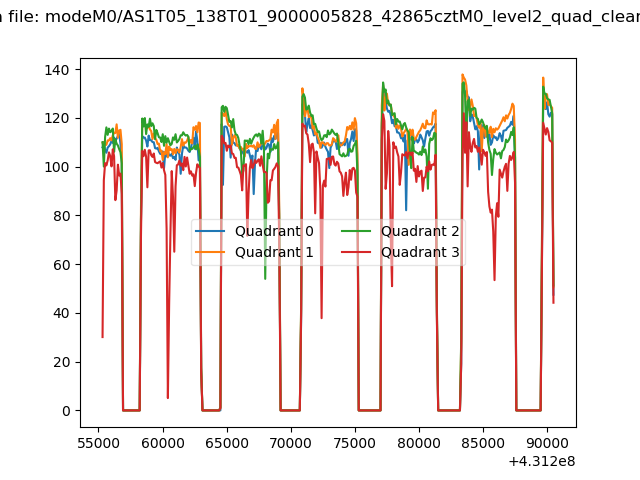 |
|
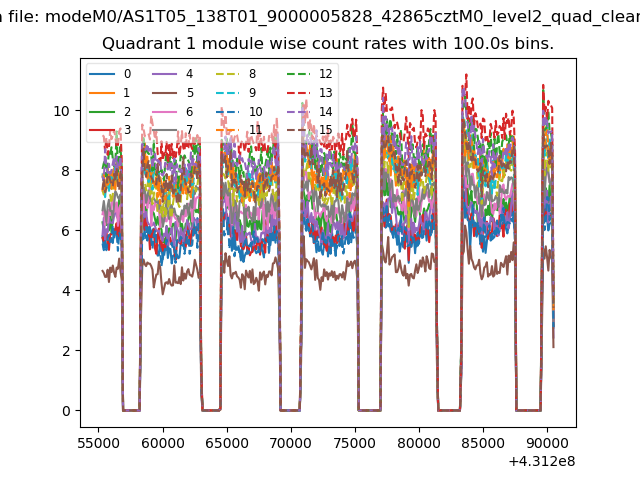
| Module-wise count rates for Quadrant A Data is divided into 100 sec bins |
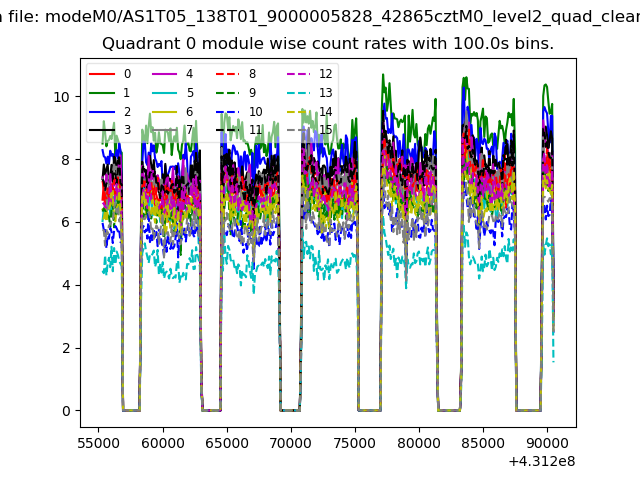 |
 |
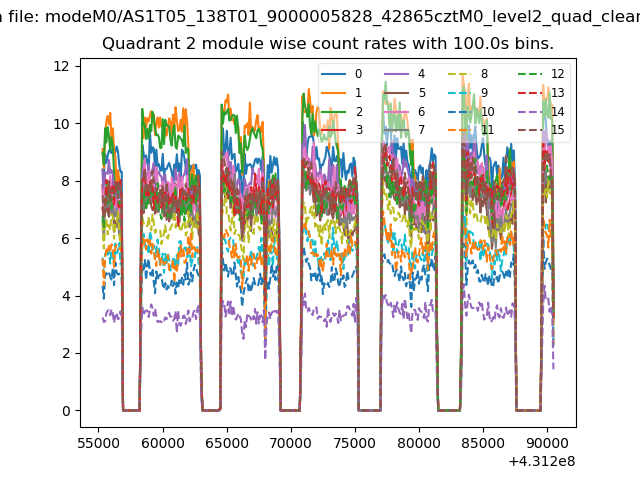
| Module-wise count rates for Quadrant B Data is divided into 100 sec bins |
 |
 |
| Module-wise count rates for Quadrant C Data is divided into 100 sec bins |
 |
 |
| Module-wise count rates for Quadrant D Data is divided into 100 sec bins |
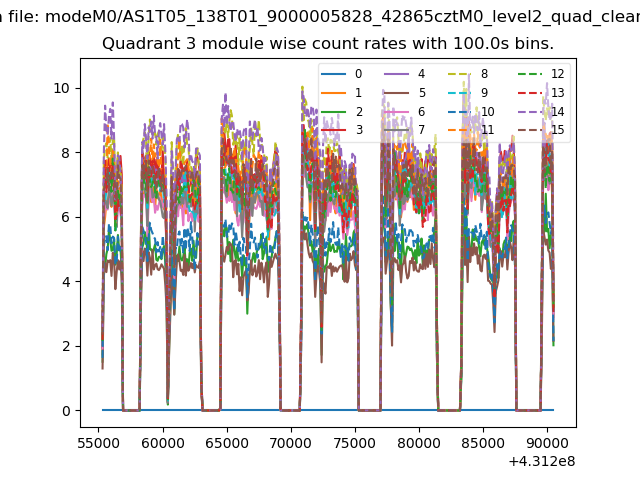 |
 |
| Parameter | Plot |
|---|---|
| CZT HV Monitor | 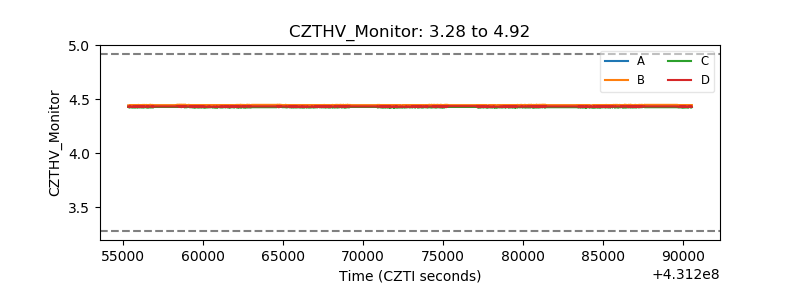 |
| D_VDD | 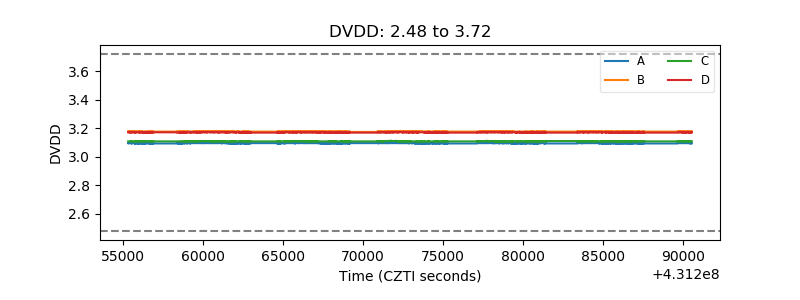 |
| Temperature 1 | 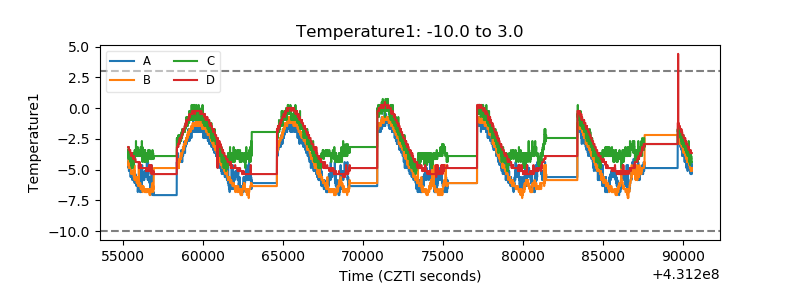 |
| Veto HV Monitor | 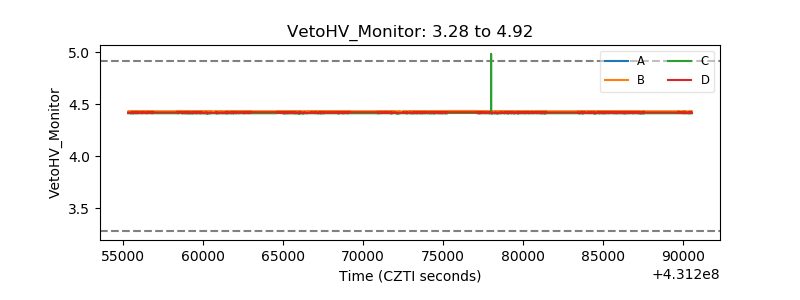 |
| Veto LLD | 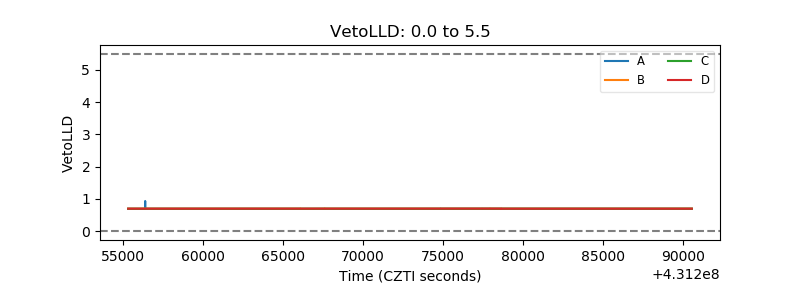 |
| Alpha Counter |  |
| _CPM_Rate | 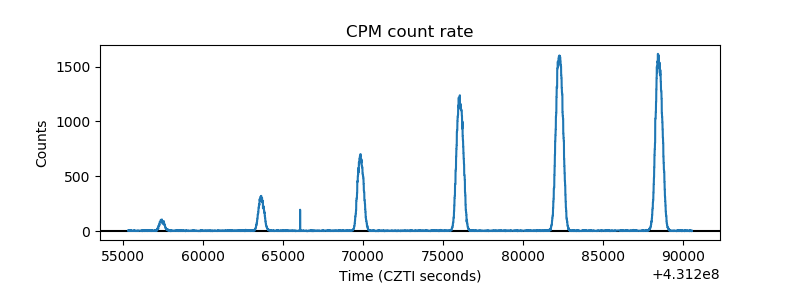 |
| CZT Counter | 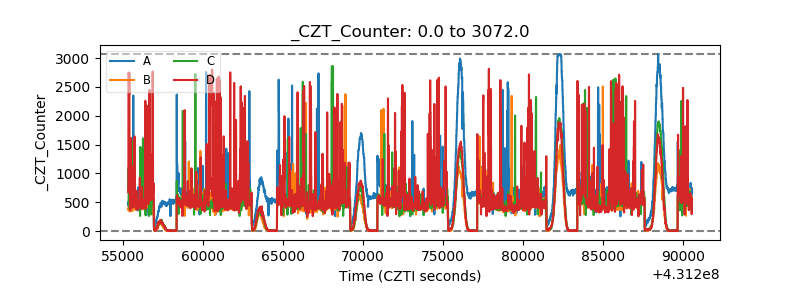 |
| +2.5 Volts monitor | 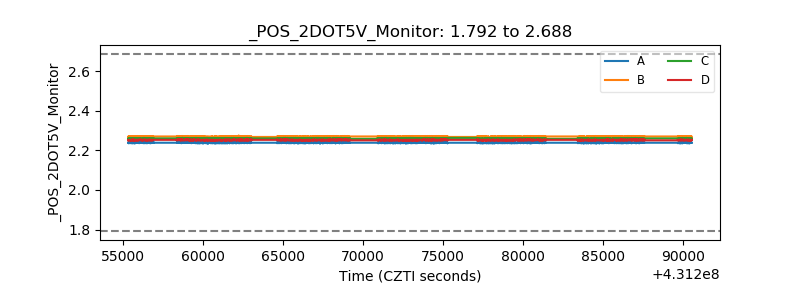 |
| +5 Volts monitor | 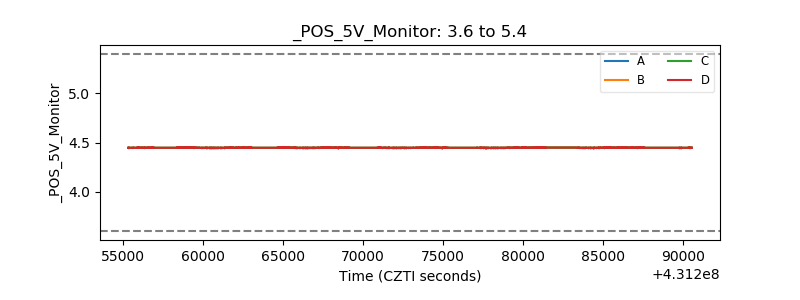 |
| _ROLL_ROT | 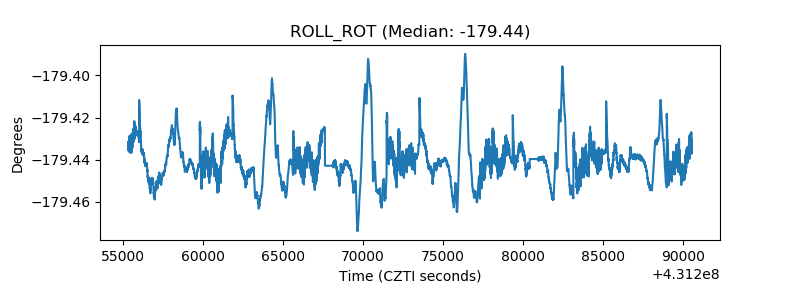 |
| _Roll_DEC | 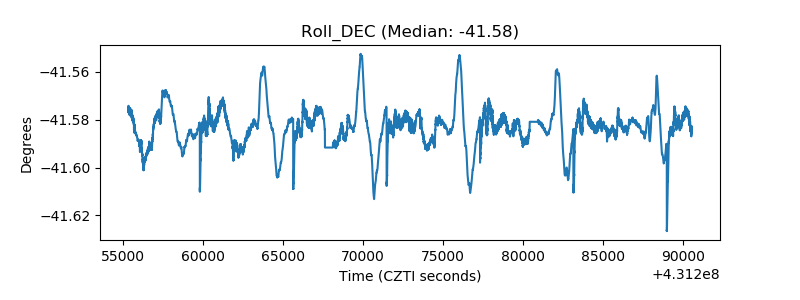 |
| _Roll_RA | 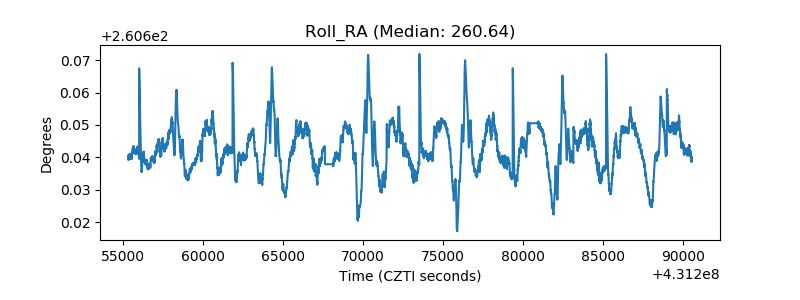 |
| Veto Counter | 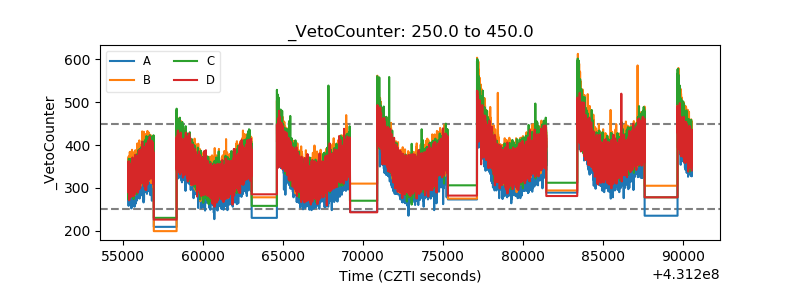 |