| Param | Original file | Final file |
|---|---|---|
| Filename | modeM0/AS1T05_138T01_9000005828_42866cztM0_level2.fits | modeM0/AS1T05_138T01_9000005828_42866cztM0_level2_quad_clean.evt |
| Size (bytes) | 314,282,880 | 84,576,960 |
| Size | 299.7 MB | 80.7 MB |
| Events in quadrant A | 2,853,736 | 565,681 |
| Events in quadrant B | 2,339,648 | 589,346 |
| Events in quadrant C | 2,552,110 | 566,818 |
| Events in quadrant D | 3,508,147 | 497,104 |
| Mode M0 | |||
|---|---|---|---|
| Quadrant | BADHDUFLAG | Total packets | Discarded packets |
| A | 0 | 11433 | 2 |
| B | 0 | 10271 | 2 |
| C | 0 | 10584 | 2 |
| D | 0 | 13710 | 2 |
| Mode M9 | |||
|---|---|---|---|
| Quadrant | BADHDUFLAG | Total packets | Discarded packets |
| A | 0 | 33 | 0 |
| B | 0 | 34 | 0 |
| C | 0 | 34 | 0 |
| D | 0 | 34 | 0 |
| Mode SS | |||
|---|---|---|---|
| Quadrant | BADHDUFLAG | Total packets | Discarded packets |
| A | 0 | 100 | 0 |
| B | 0 | 100 | 0 |
| C | 0 | 100 | 0 |
| D | 0 | 100 | 0 |
| Quadrant | Total seconds | Saturated seconds | Saturation percentage |
|---|---|---|---|
| A | 4876 | 46 | 0.943396% |
| B | 4876 | 23 | 0.471698% |
| C | 4876 | 47 | 0.963905% |
| D | 4876 | 236 | 4.840033% |
Noise dominated data is calculated using 1-second bins in cleaned event files. If a bin has >2000 counts, and if more than 50% of those come from <1% of pixels, then it is considered to be noise-dominated and hence unusable.
| Quadrant | # 1 sec bins | Bins with >0 counts | Bins with >2000 counts | High rate bins dominated by noise | Noise dominated (total time) | Noise dominated (detector-on time) | Marked lightcurve |
|---|---|---|---|---|---|---|---|
| A | 6998 | 4877 | 30 | 30 | 0.43% | 0.62% | 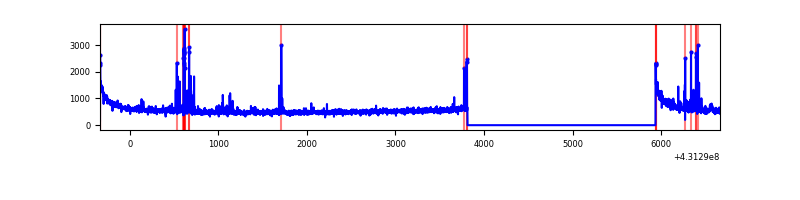 |
| B | 6998 | 4877 | 17 | 17 | 0.24% | 0.35% | 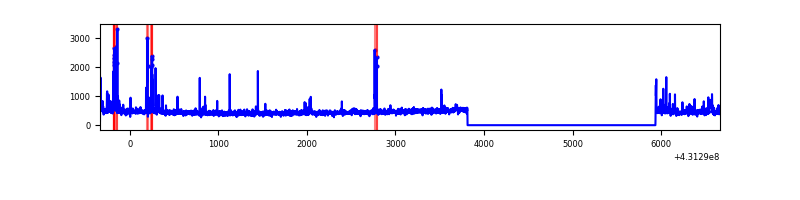 |
| C | 6998 | 4877 | 52 | 52 | 0.74% | 1.07% | 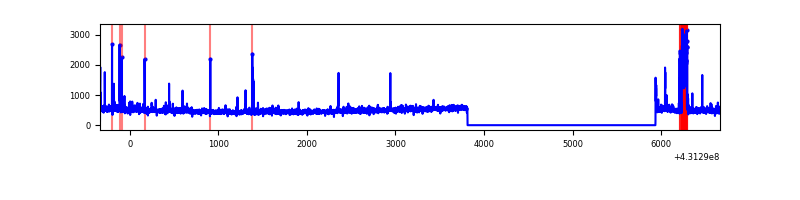 |
| D | 6998 | 4877 | 229 | 229 | 3.27% | 4.70% | 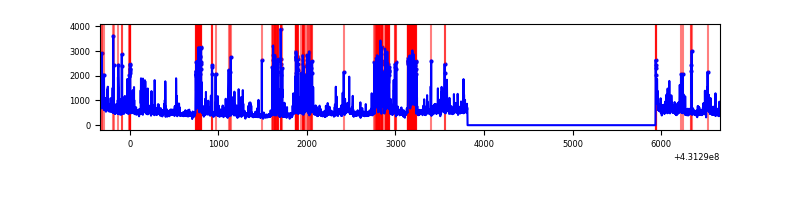 |
Top three noisy pixels from each quadrant. If the there are fewer than three noisy pixels in the level2.evt file, extra rows are filled as -1
| Pixel properties | Quadrant properties | ||||||
|---|---|---|---|---|---|---|---|
| Quadrant | DetID | PixID | Counts | Sigma | Mean | Median | Sigma |
| A | 10 | 83 | 551740 | 4896.63 | 540 | 532 | 112.6 |
| A | 15 | 237 | 90584 | 799.97 | 540 | 532 | 112.6 |
| A | 12 | 189 | 64589 | 569.05 | 540 | 532 | 112.6 |
| B | 5 | 255 | 83381 | 776.88 | 545 | 531 | 106.6 |
| B | 0 | 245 | 63436 | 589.85 | 545 | 531 | 106.6 |
| B | 4 | 171 | 25431 | 233.48 | 545 | 531 | 106.6 |
| C | 15 | 214 | 197660 | 1591.52 | 531 | 535 | 123.9 |
| C | 15 | 111 | 126315 | 1015.5 | 531 | 535 | 123.9 |
| C | 14 | 254 | 49584 | 396.0 | 531 | 535 | 123.9 |
| D | 12 | 6 | 734287 | 5810.48 | 514 | 499 | 126.3 |
| D | 2 | 249 | 233774 | 1847.18 | 514 | 499 | 126.3 |
| D | 1 | 52 | 149820 | 1182.39 | 514 | 499 | 126.3 |
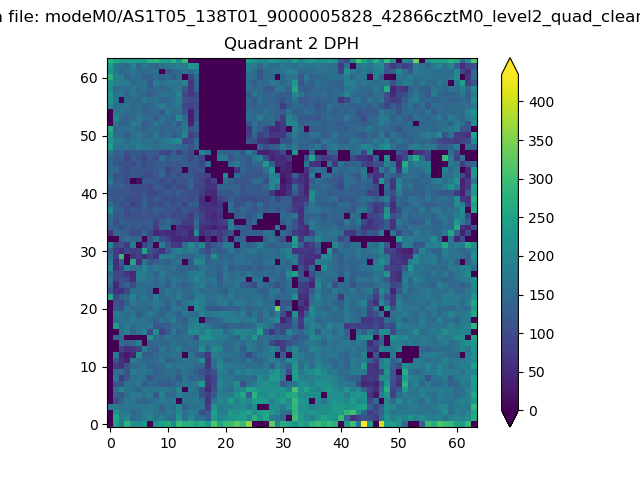
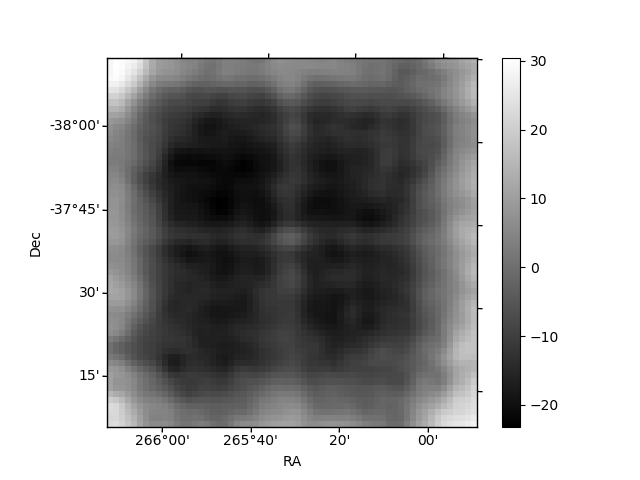
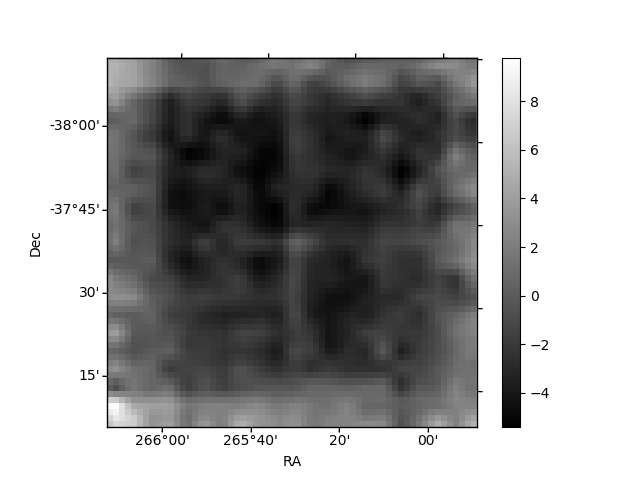
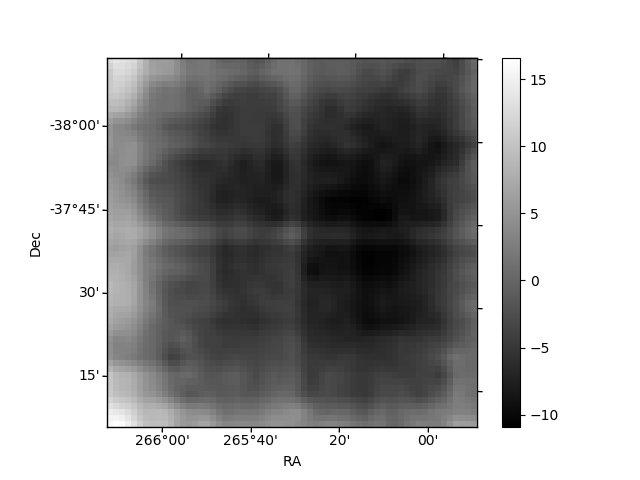
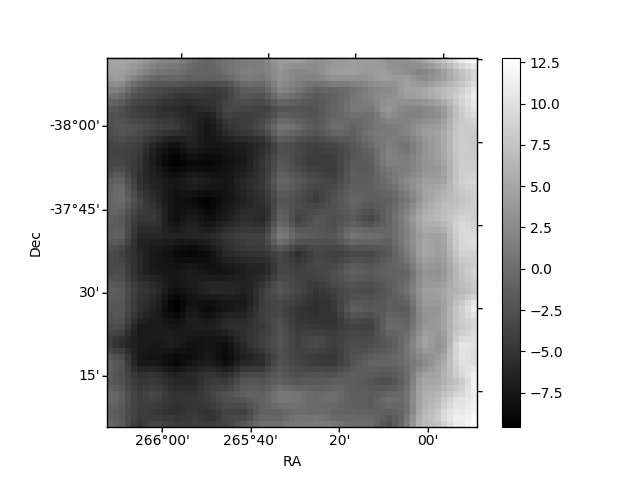
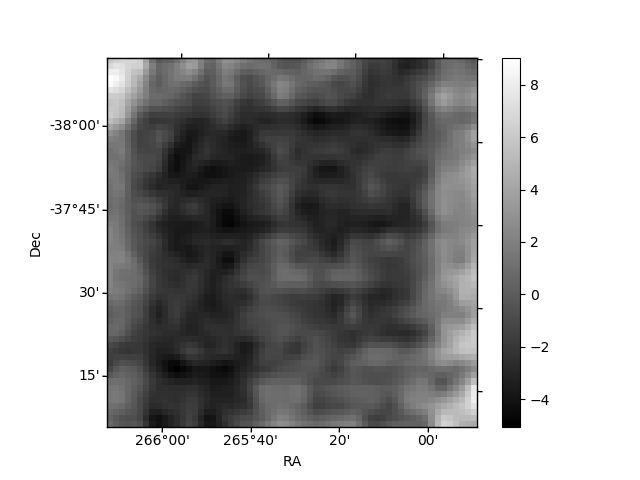
Histogram calculated using DETX and DETY for each event in the final _common_clean file
| Quadrant A | 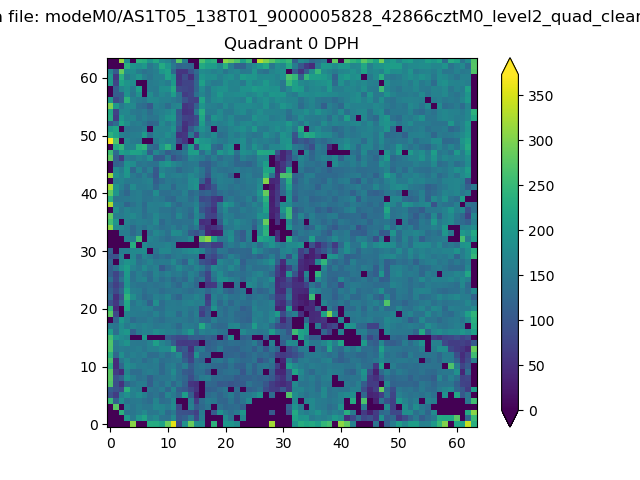 |
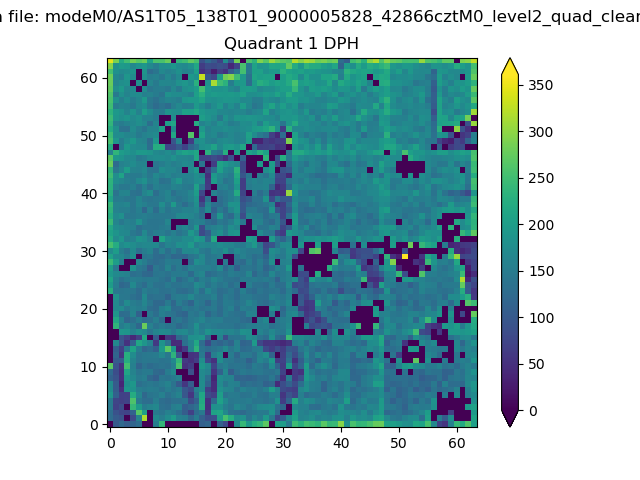 |
Quadrant B |
|---|---|---|---|
| Quadrant D | 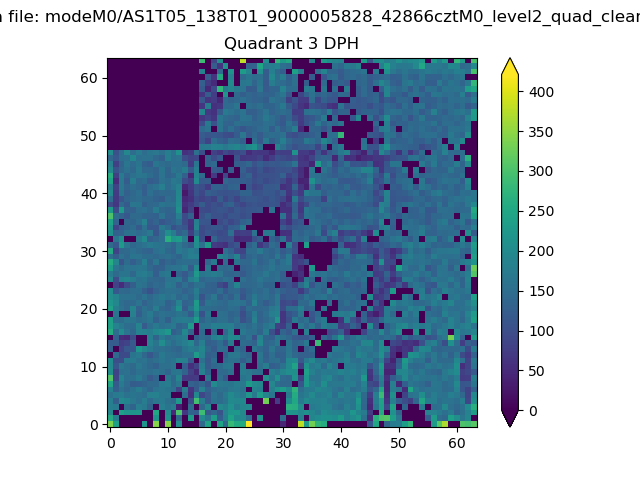 |
 |
Quadrant C |
| Plot type | Count rate plots | Images |
|---|---|---|
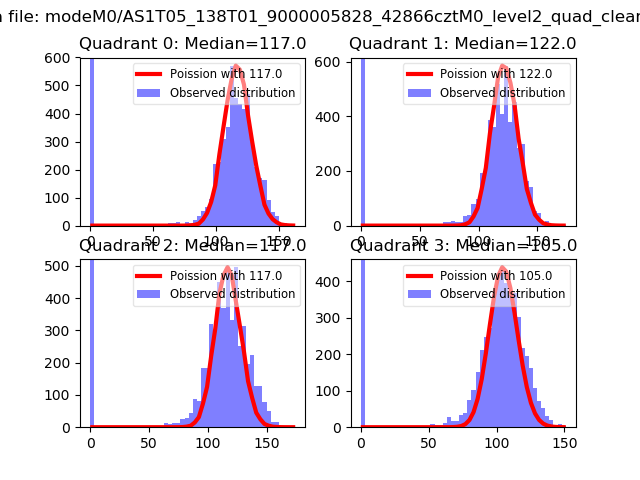
| Comparison with Poisson distribution Blue bars denote a histogram of data divided into 1 sec bins. Red curve is a Poisson curve with rate = median count rate of data. |
 |
 |
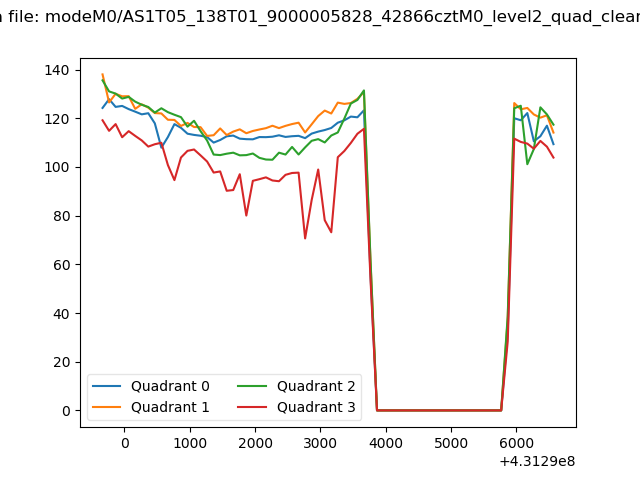
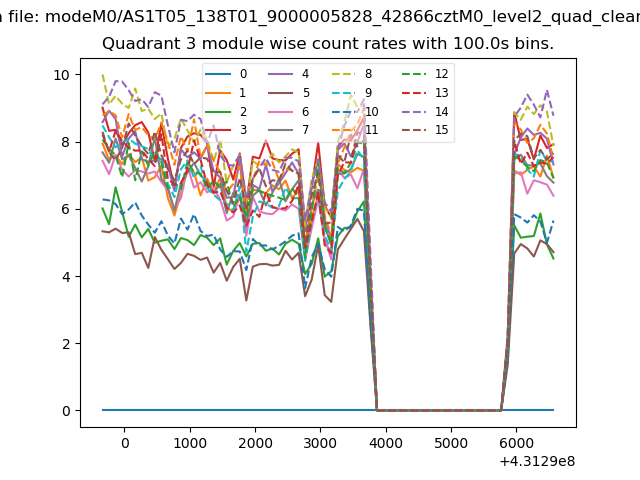
| Quadrant-wise count rates Data is divided into 100 sec bins |
 |
|
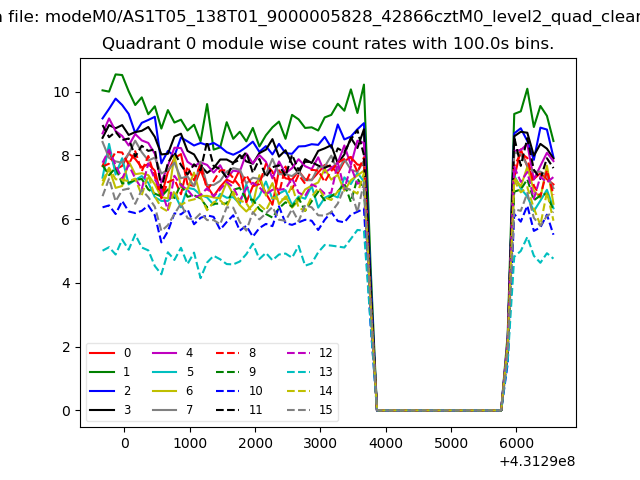
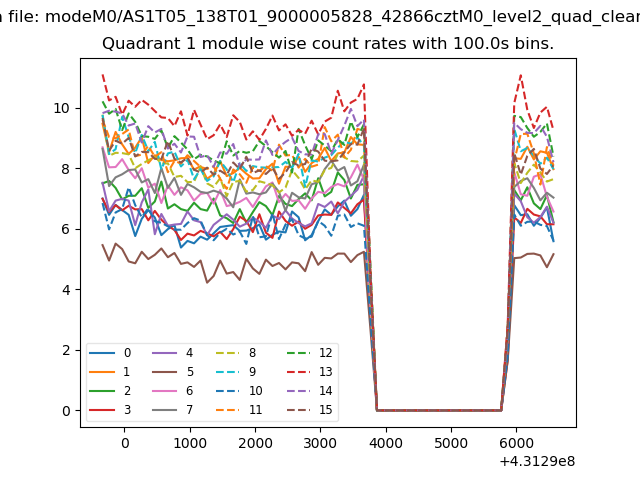
| Module-wise count rates for Quadrant A Data is divided into 100 sec bins |
 |
 |
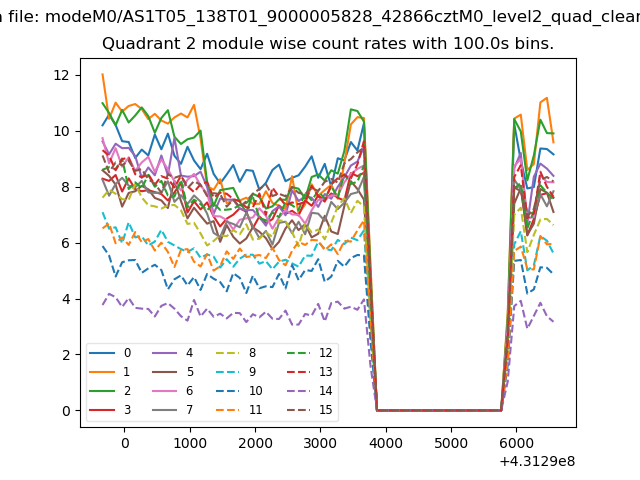
| Module-wise count rates for Quadrant B Data is divided into 100 sec bins |
 |
 |
| Module-wise count rates for Quadrant C Data is divided into 100 sec bins |
 |
 |
| Module-wise count rates for Quadrant D Data is divided into 100 sec bins |
 |
 |
| Parameter | Plot |
|---|---|
| CZT HV Monitor | 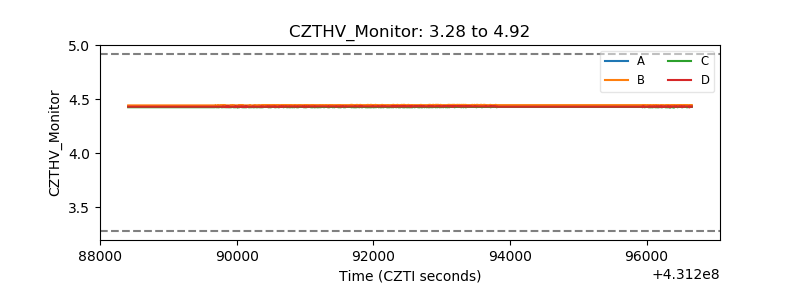 |
| D_VDD | 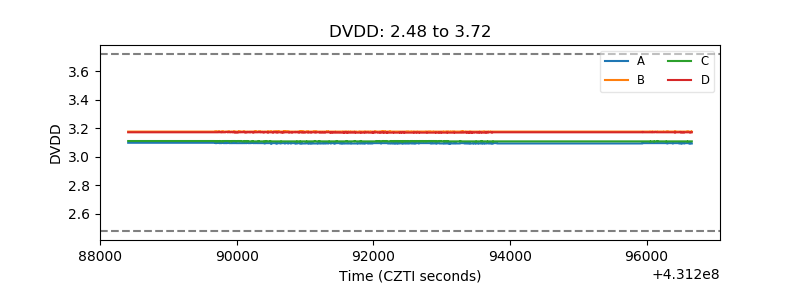 |
| Temperature 1 | 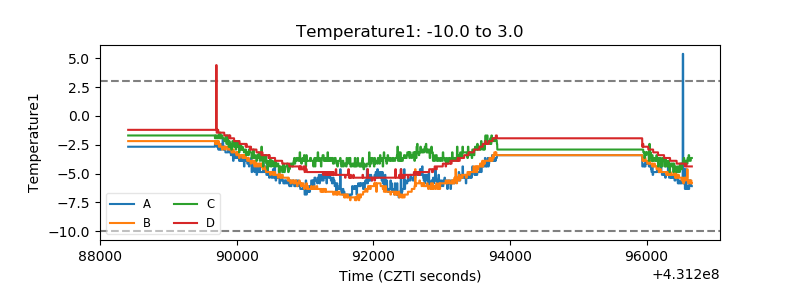 |
| Veto HV Monitor | 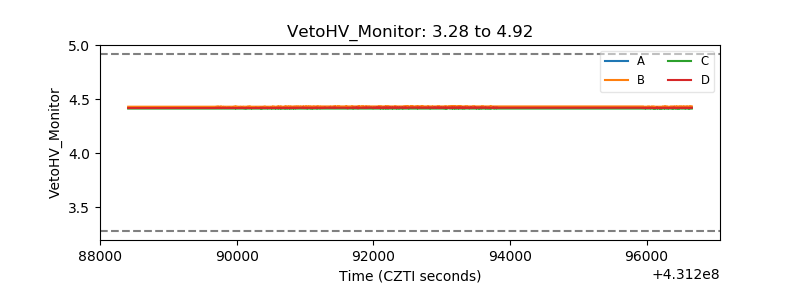 |
| Veto LLD | 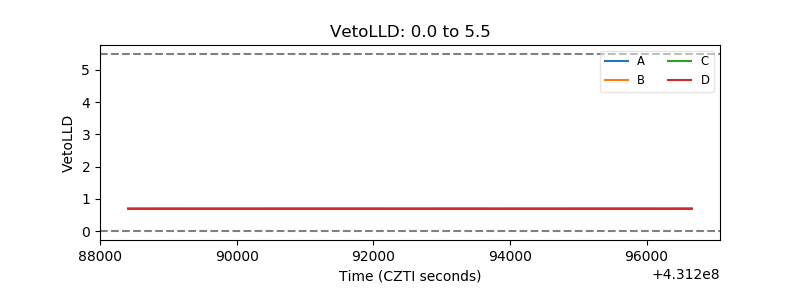 |
| Alpha Counter | 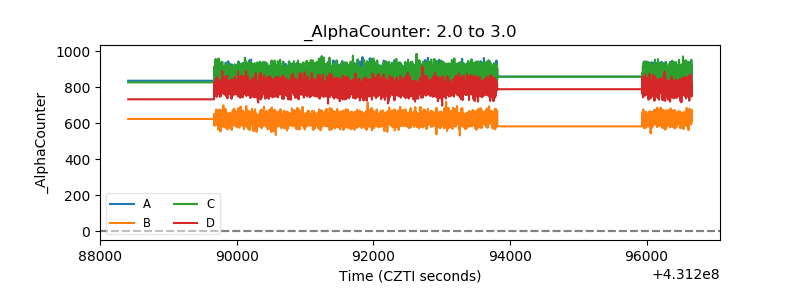 |
| _CPM_Rate | 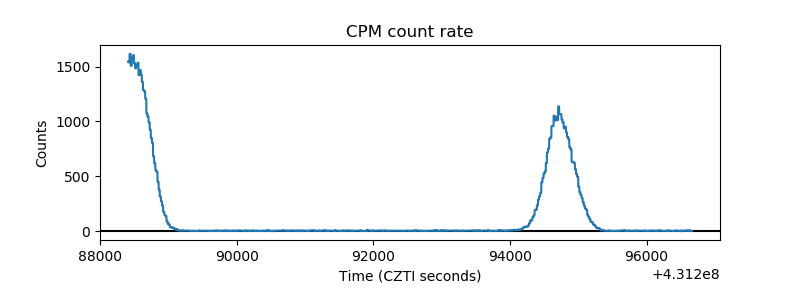 |
| CZT Counter | 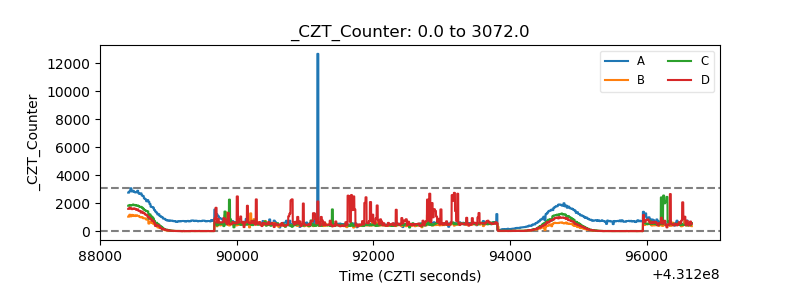 |
| +2.5 Volts monitor | 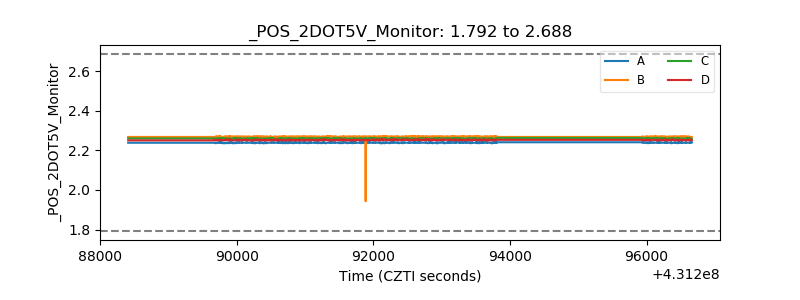 |
| +5 Volts monitor | 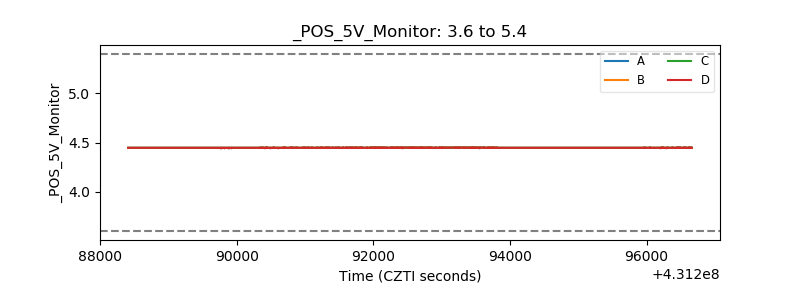 |
| _ROLL_ROT |  |
| _Roll_DEC | 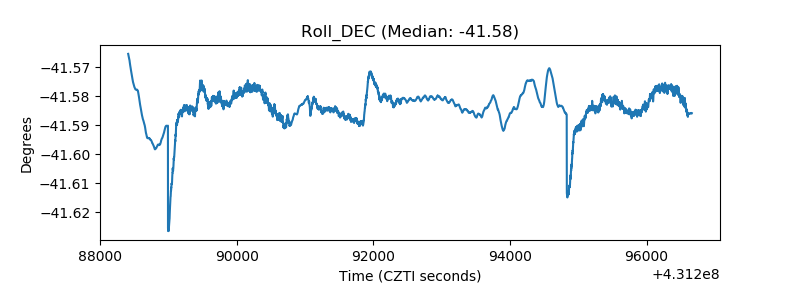 |
| _Roll_RA | 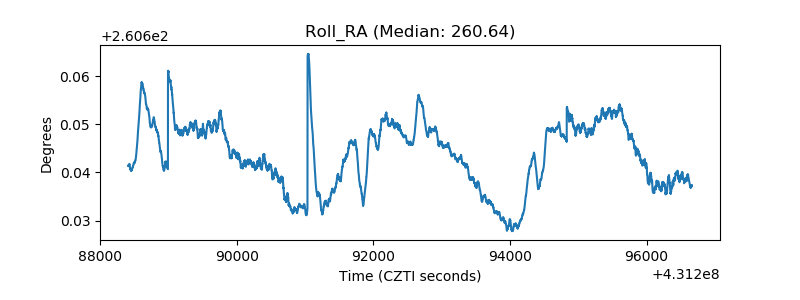 |
| Veto Counter | 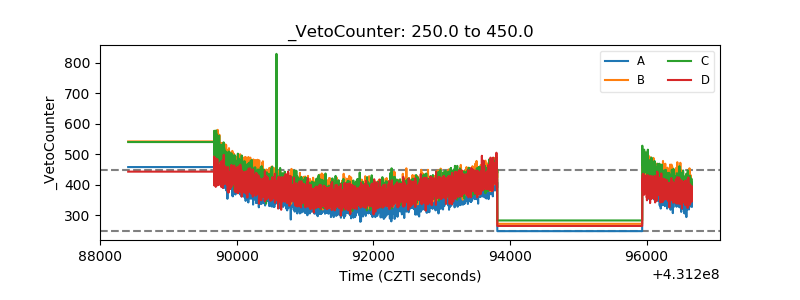 |