| Param | Original file | Final file |
|---|---|---|
| Filename | modeM0/AS1T05_138T01_9000005828_42867cztM0_level2.fits | modeM0/AS1T05_138T01_9000005828_42867cztM0_level2_quad_clean.evt |
| Size (bytes) | 319,259,520 | 82,923,840 |
| Size | 304.5 MB | 79.1 MB |
| Events in quadrant A | 2,991,362 | 549,812 |
| Events in quadrant B | 2,323,953 | 575,230 |
| Events in quadrant C | 2,896,754 | 546,909 |
| Events in quadrant D | 3,223,163 | 494,776 |
| Mode M0 | |||
|---|---|---|---|
| Quadrant | BADHDUFLAG | Total packets | Discarded packets |
| A | 0 | 11898 | 2 |
| B | 0 | 10281 | 2 |
| C | 0 | 11745 | 2 |
| D | 0 | 12888 | 2 |
| Mode M9 | |||
|---|---|---|---|
| Quadrant | BADHDUFLAG | Total packets | Discarded packets |
| A | 0 | 30 | 0 |
| B | 0 | 31 | 0 |
| C | 0 | 31 | 0 |
| D | 0 | 31 | 0 |
| Mode SS | |||
|---|---|---|---|
| Quadrant | BADHDUFLAG | Total packets | Discarded packets |
| A | 0 | 100 | 0 |
| B | 0 | 100 | 0 |
| C | 0 | 100 | 0 |
| D | 0 | 100 | 0 |
| Quadrant | Total seconds | Saturated seconds | Saturation percentage |
|---|---|---|---|
| A | 4909 | 85 | 1.731514% |
| B | 4909 | 6 | 0.122224% |
| C | 4909 | 126 | 2.566714% |
| D | 4909 | 163 | 3.320432% |
Noise dominated data is calculated using 1-second bins in cleaned event files. If a bin has >2000 counts, and if more than 50% of those come from <1% of pixels, then it is considered to be noise-dominated and hence unusable.
| Quadrant | # 1 sec bins | Bins with >0 counts | Bins with >2000 counts | High rate bins dominated by noise | Noise dominated (total time) | Noise dominated (detector-on time) | Marked lightcurve |
|---|---|---|---|---|---|---|---|
| A | 7031 | 4910 | 69 | 69 | 0.98% | 1.41% | 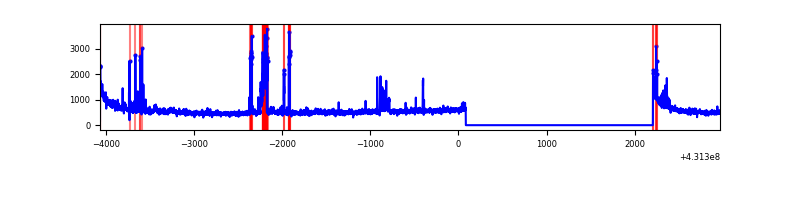 |
| B | 7031 | 4910 | 1 | 1 | 0.01% | 0.02% | 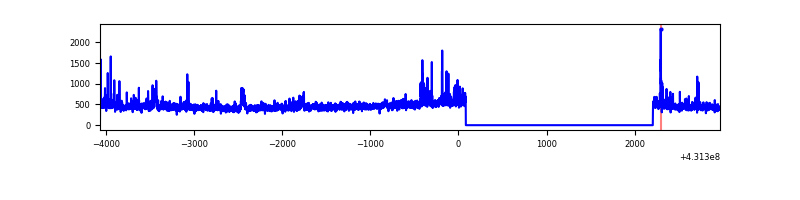 |
| C | 7031 | 4910 | 129 | 129 | 1.83% | 2.63% | 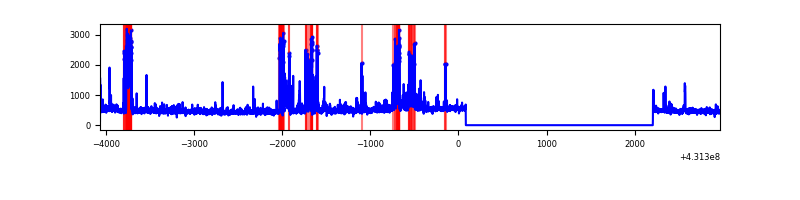 |
| D | 7031 | 4910 | 156 | 156 | 2.22% | 3.18% | 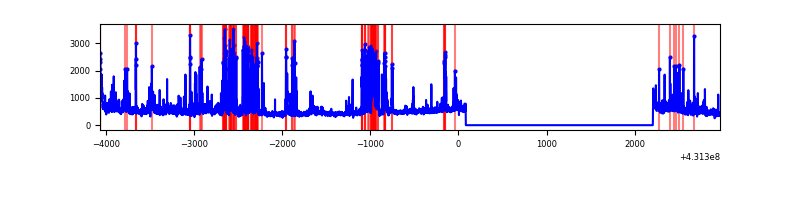 |
Top three noisy pixels from each quadrant. If the there are fewer than three noisy pixels in the level2.evt file, extra rows are filled as -1
| Pixel properties | Quadrant properties | ||||||
|---|---|---|---|---|---|---|---|
| Quadrant | DetID | PixID | Counts | Sigma | Mean | Median | Sigma |
| A | 10 | 83 | 534676 | 4869.82 | 533 | 523 | 109.7 |
| A | 15 | 237 | 284662 | 2590.47 | 533 | 523 | 109.7 |
| A | 12 | 189 | 77322 | 700.17 | 533 | 523 | 109.7 |
| B | 0 | 229 | 105794 | 995.87 | 539 | 525 | 105.7 |
| B | 0 | 245 | 43772 | 409.13 | 539 | 525 | 105.7 |
| B | 5 | 255 | 28300 | 262.76 | 539 | 525 | 105.7 |
| C | 14 | 254 | 262398 | 2107.43 | 525 | 528 | 124.3 |
| C | 15 | 214 | 197994 | 1589.13 | 525 | 528 | 124.3 |
| C | 15 | 111 | 124998 | 1001.69 | 525 | 528 | 124.3 |
| D | 12 | 6 | 859709 | 6749.92 | 515 | 501 | 127.3 |
| D | 2 | 249 | 122473 | 958.21 | 515 | 501 | 127.3 |
| D | 1 | 52 | 51521 | 400.81 | 515 | 501 | 127.3 |
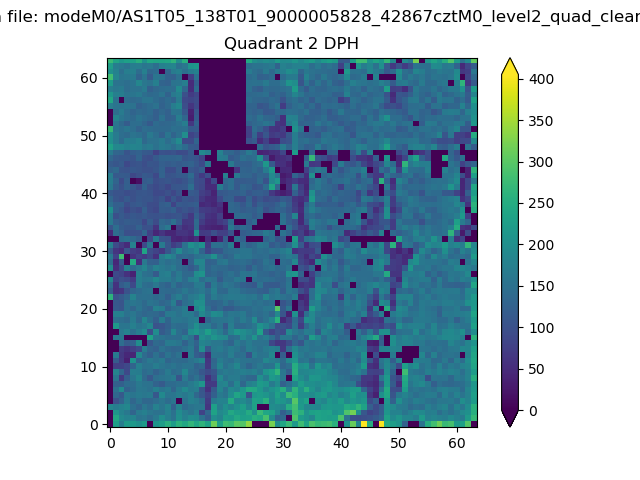
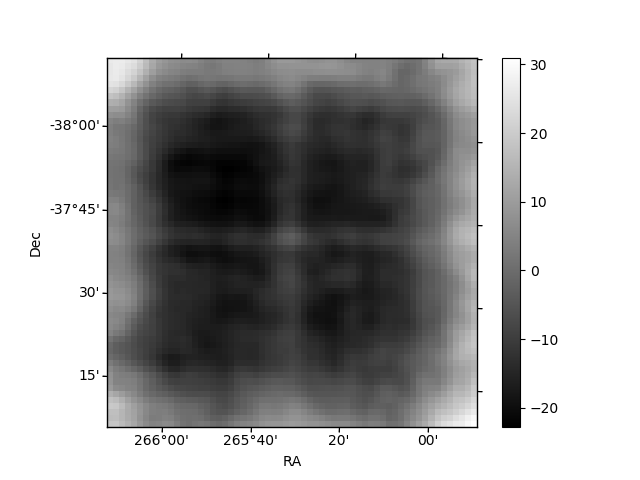
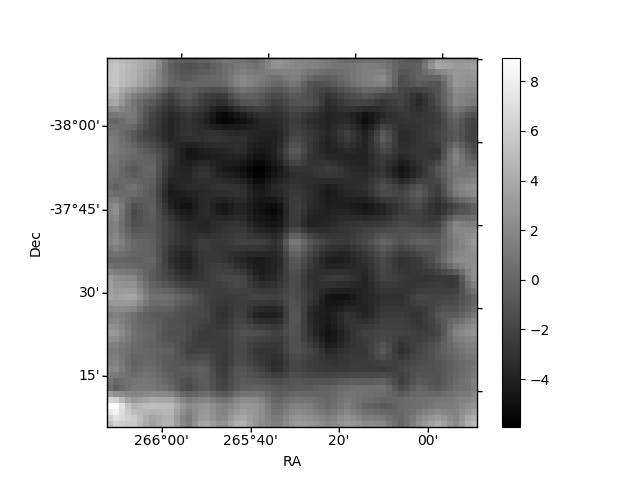
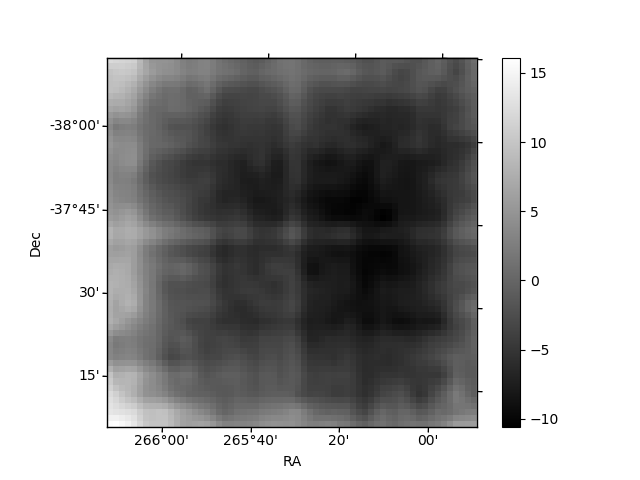
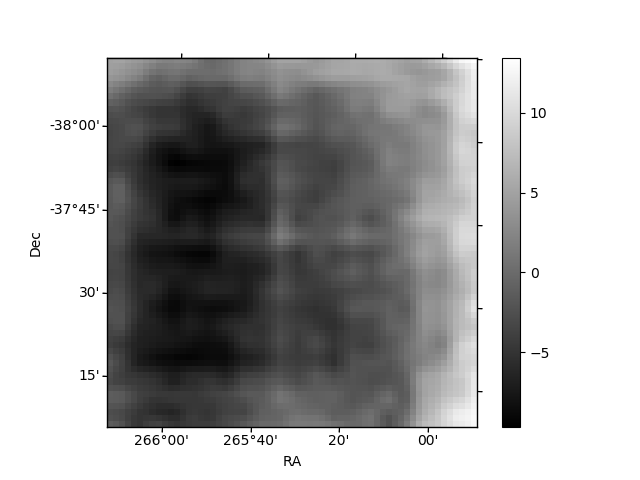
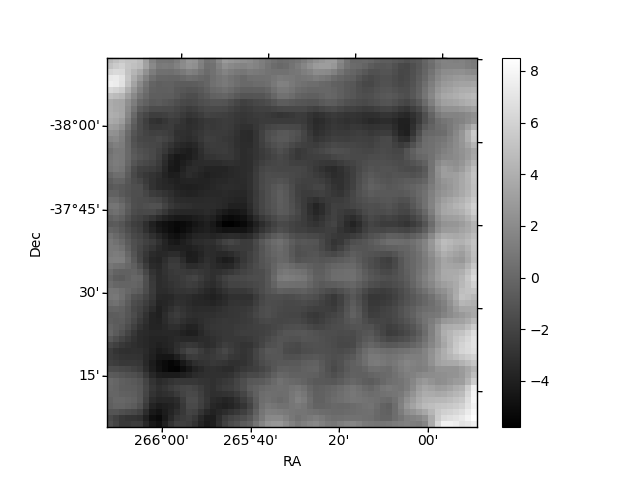
Histogram calculated using DETX and DETY for each event in the final _common_clean file
| Quadrant A | 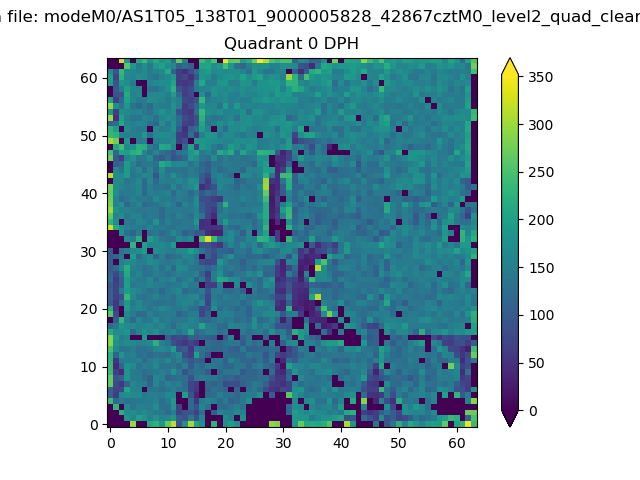 |
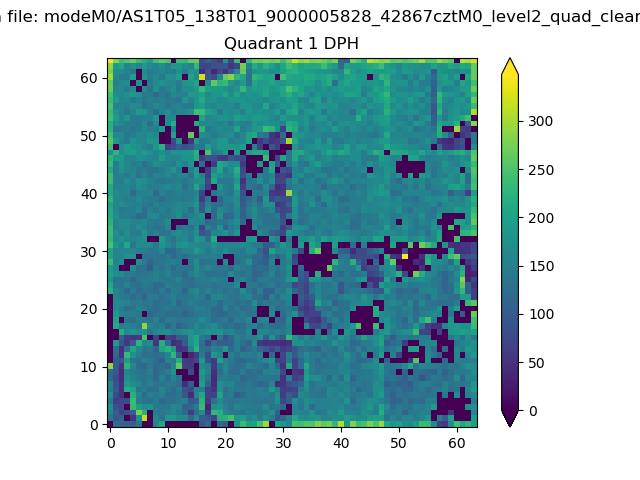 |
Quadrant B |
|---|---|---|---|
| Quadrant D | 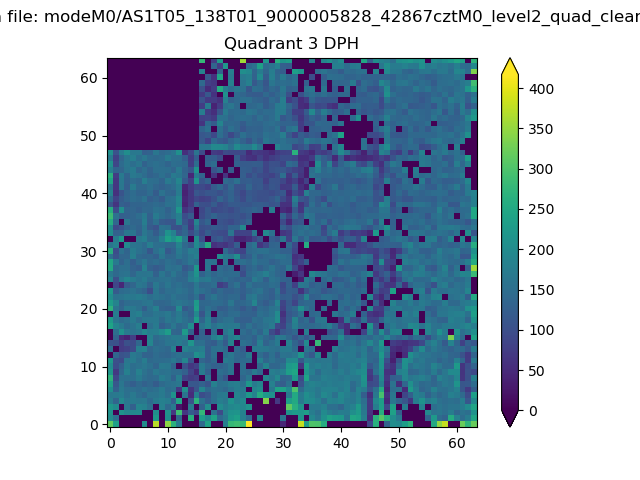 |
 |
Quadrant C |
| Plot type | Count rate plots | Images |
|---|---|---|
| Comparison with Poisson distribution Blue bars denote a histogram of data divided into 1 sec bins. Red curve is a Poisson curve with rate = median count rate of data. |
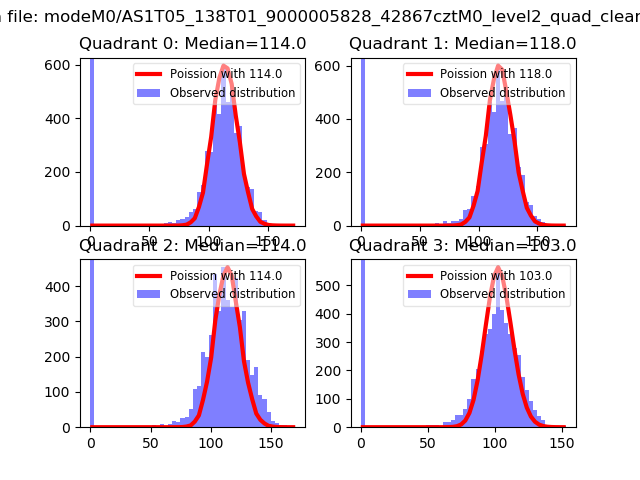 |
 |
| Quadrant-wise count rates Data is divided into 100 sec bins |
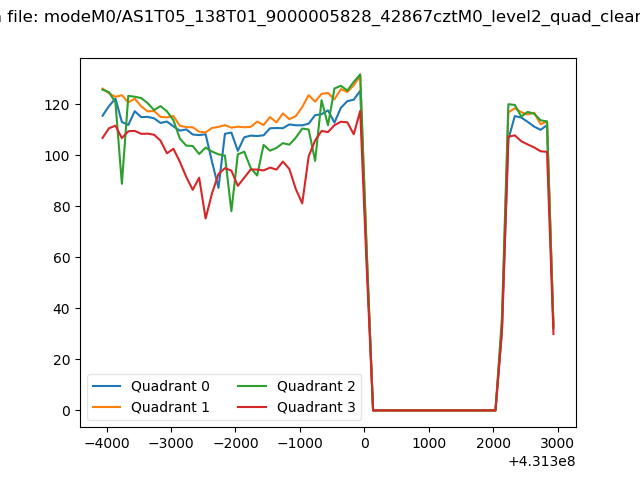 |
|
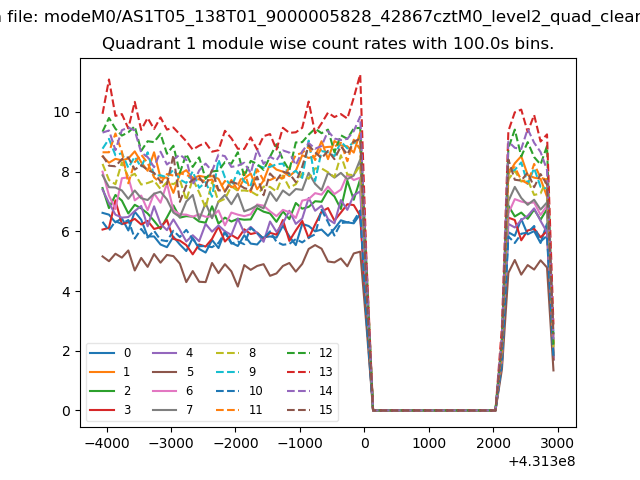
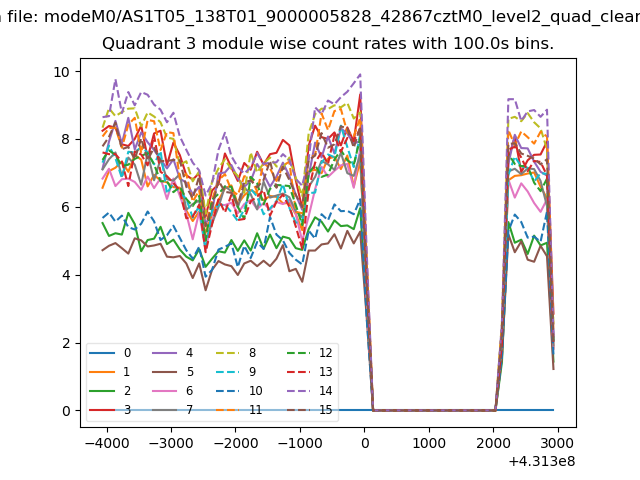
| Module-wise count rates for Quadrant A Data is divided into 100 sec bins |
 |
 |
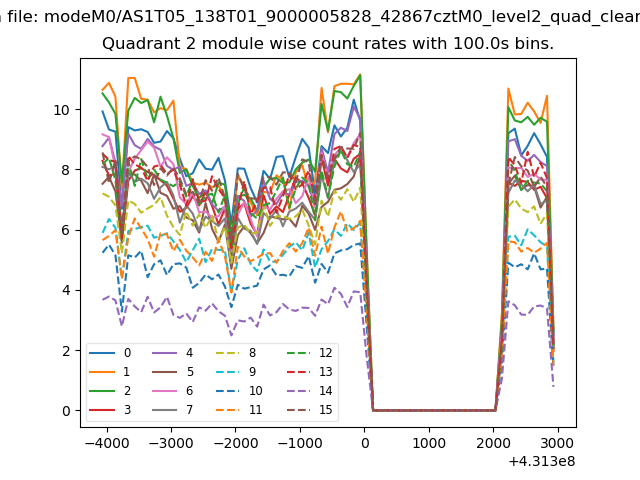
| Module-wise count rates for Quadrant B Data is divided into 100 sec bins |
 |
 |
| Module-wise count rates for Quadrant C Data is divided into 100 sec bins |
 |
 |
| Module-wise count rates for Quadrant D Data is divided into 100 sec bins |
 |
 |
| Parameter | Plot |
|---|---|
| CZT HV Monitor | 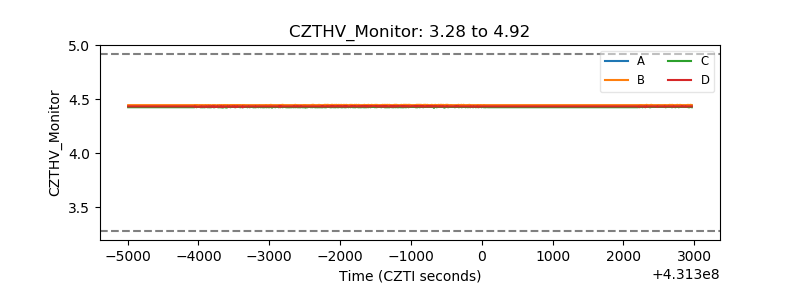 |
| D_VDD | 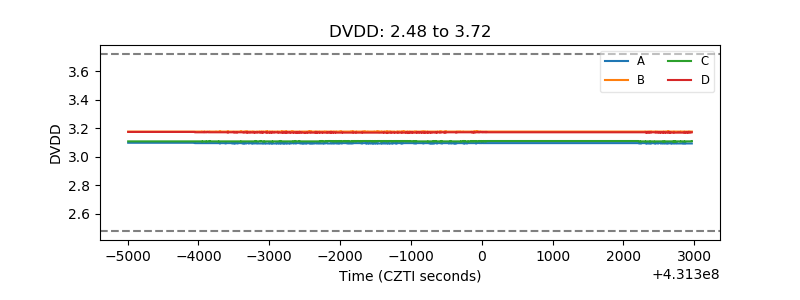 |
| Temperature 1 | 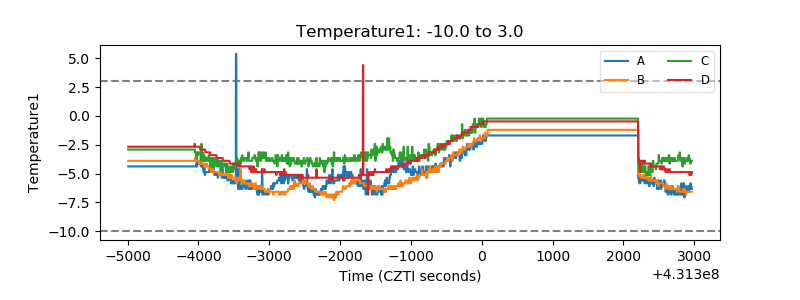 |
| Veto HV Monitor | 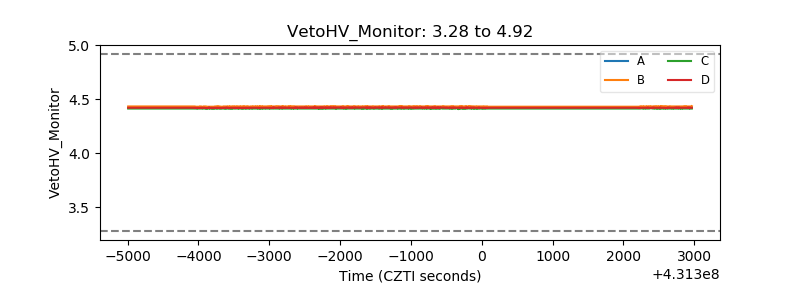 |
| Veto LLD | 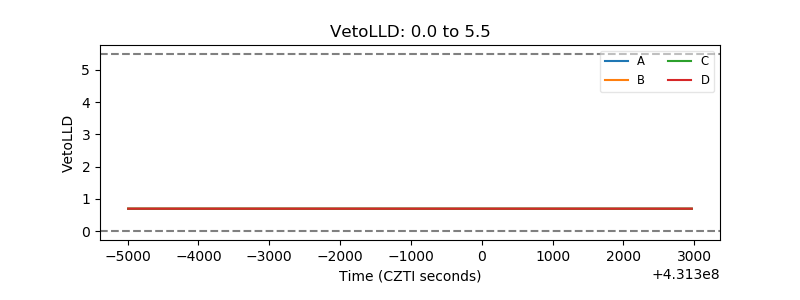 |
| Alpha Counter | 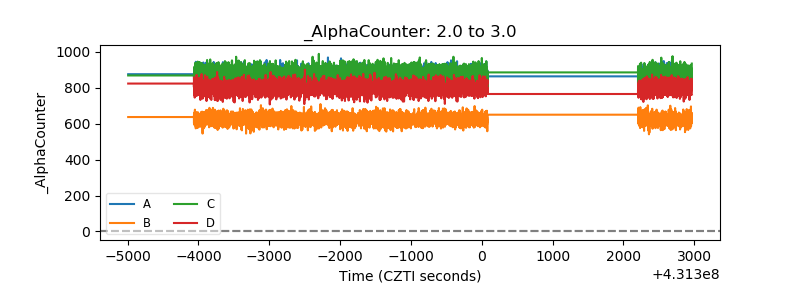 |
| _CPM_Rate | 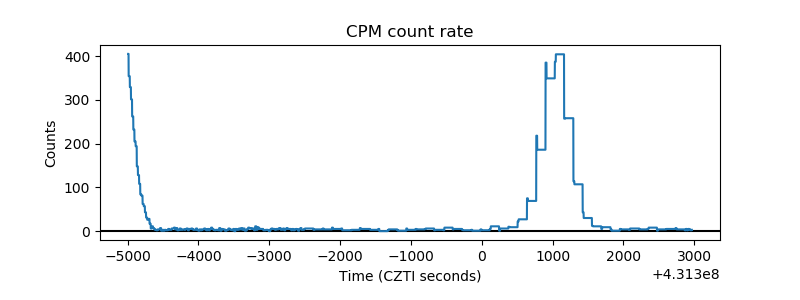 |
| CZT Counter | 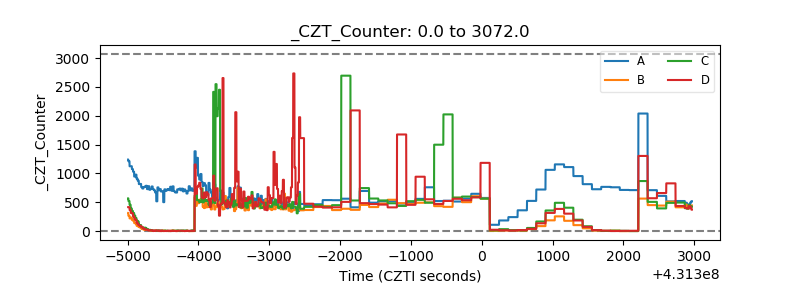 |
| +2.5 Volts monitor | 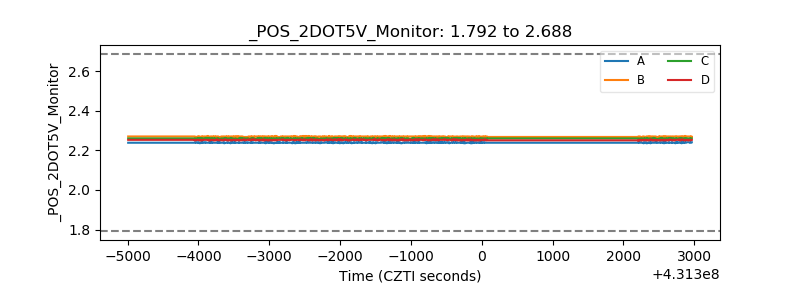 |
| +5 Volts monitor |  |
| _ROLL_ROT | 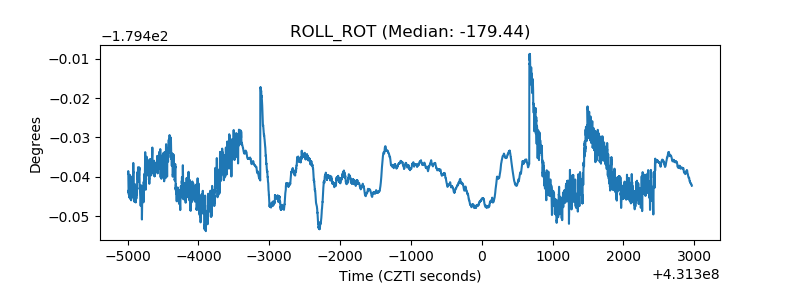 |
| _Roll_DEC | 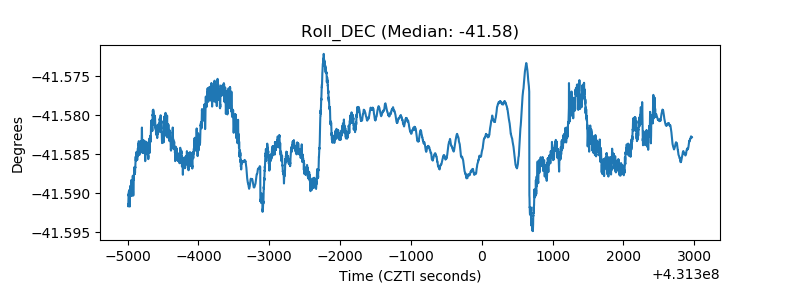 |
| _Roll_RA | 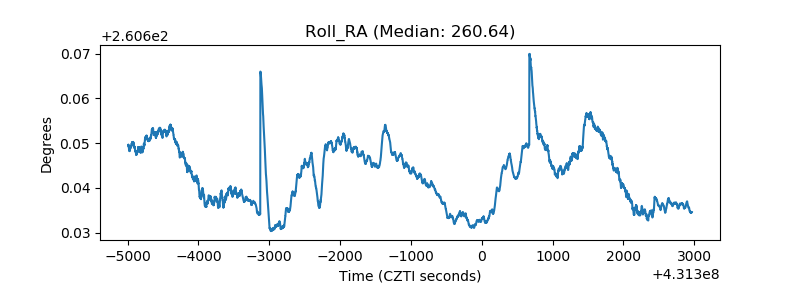 |
| Veto Counter | 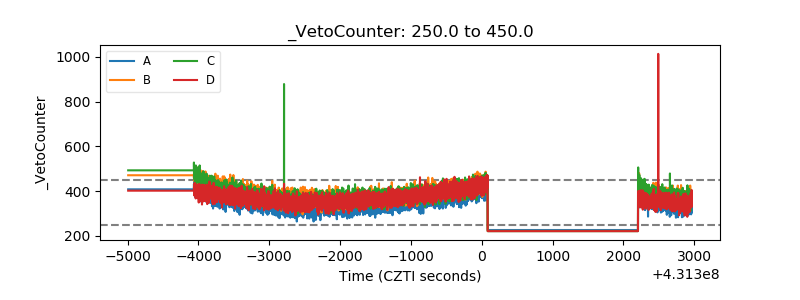 |