| Param | Original file | Final file |
|---|---|---|
| Filename | modeM0/AS1T05_138T01_9000005828_42868cztM0_level2.fits | modeM0/AS1T05_138T01_9000005828_42868cztM0_level2_quad_clean.evt |
| Size (bytes) | 322,142,400 | 82,699,200 |
| Size | 307.2 MB | 78.9 MB |
| Events in quadrant A | 2,889,614 | 549,291 |
| Events in quadrant B | 2,343,311 | 570,203 |
| Events in quadrant C | 2,518,056 | 553,723 |
| Events in quadrant D | 3,781,137 | 477,801 |
| Mode M0 | |||
|---|---|---|---|
| Quadrant | BADHDUFLAG | Total packets | Discarded packets |
| A | 0 | 11657 | 2 |
| B | 0 | 10529 | 2 |
| C | 0 | 10707 | 2 |
| D | 0 | 14733 | 2 |
| Mode M9 | |||
|---|---|---|---|
| Quadrant | BADHDUFLAG | Total packets | Discarded packets |
| A | 0 | 34 | 0 |
| B | 0 | 35 | 0 |
| C | 0 | 35 | 0 |
| D | 0 | 35 | 0 |
| Mode SS | |||
|---|---|---|---|
| Quadrant | BADHDUFLAG | Total packets | Discarded packets |
| A | 0 | 104 | 0 |
| B | 0 | 104 | 0 |
| C | 0 | 104 | 0 |
| D | 0 | 104 | 0 |
| Quadrant | Total seconds | Saturated seconds | Saturation percentage |
|---|---|---|---|
| A | 5035 | 51 | 1.012910% |
| B | 5035 | 19 | 0.377358% |
| C | 5035 | 18 | 0.357498% |
| D | 5035 | 350 | 6.951341% |
Noise dominated data is calculated using 1-second bins in cleaned event files. If a bin has >2000 counts, and if more than 50% of those come from <1% of pixels, then it is considered to be noise-dominated and hence unusable.
| Quadrant | # 1 sec bins | Bins with >0 counts | Bins with >2000 counts | High rate bins dominated by noise | Noise dominated (total time) | Noise dominated (detector-on time) | Marked lightcurve |
|---|---|---|---|---|---|---|---|
| A | 7008 | 5036 | 34 | 34 | 0.49% | 0.68% | 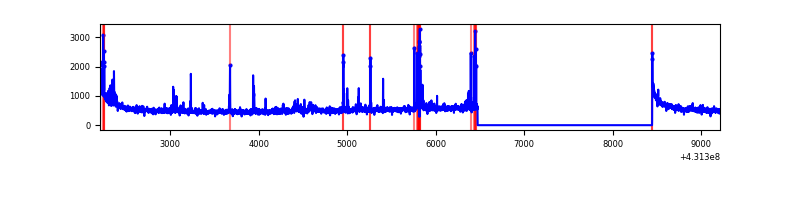 |
| B | 7008 | 5036 | 9 | 9 | 0.13% | 0.18% | 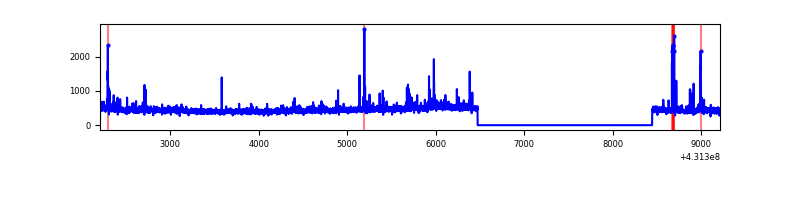 |
| C | 7008 | 5036 | 15 | 15 | 0.21% | 0.30% | 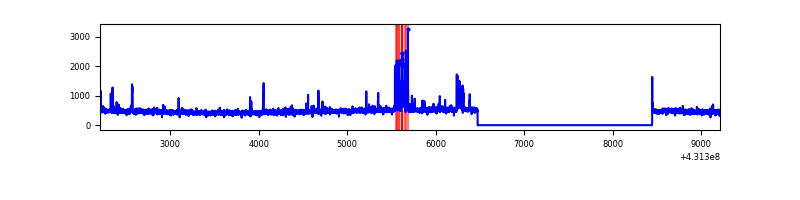 |
| D | 7008 | 5036 | 338 | 338 | 4.82% | 6.71% | 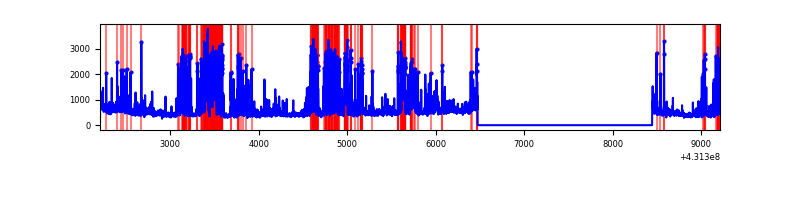 |
Top three noisy pixels from each quadrant. If the there are fewer than three noisy pixels in the level2.evt file, extra rows are filled as -1
| Pixel properties | Quadrant properties | ||||||
|---|---|---|---|---|---|---|---|
| Quadrant | DetID | PixID | Counts | Sigma | Mean | Median | Sigma |
| A | 10 | 83 | 530133 | 4720.48 | 542 | 531 | 112.2 |
| A | 15 | 237 | 120214 | 1066.77 | 542 | 531 | 112.2 |
| A | 12 | 189 | 77616 | 687.08 | 542 | 531 | 112.2 |
| B | 0 | 245 | 47513 | 440.45 | 546 | 531 | 106.7 |
| B | 5 | 172 | 36143 | 333.86 | 546 | 531 | 106.7 |
| B | 5 | 255 | 32904 | 303.49 | 546 | 531 | 106.7 |
| C | 15 | 214 | 203977 | 1599.57 | 538 | 541 | 127.2 |
| C | 0 | 207 | 140519 | 1100.62 | 538 | 541 | 127.2 |
| C | 14 | 254 | 44221 | 343.45 | 538 | 541 | 127.2 |
| D | 12 | 6 | 1085262 | 8447.36 | 516 | 501 | 128.4 |
| D | 2 | 249 | 411980 | 3204.31 | 516 | 501 | 128.4 |
| D | 13 | 249 | 77090 | 596.42 | 516 | 501 | 128.4 |
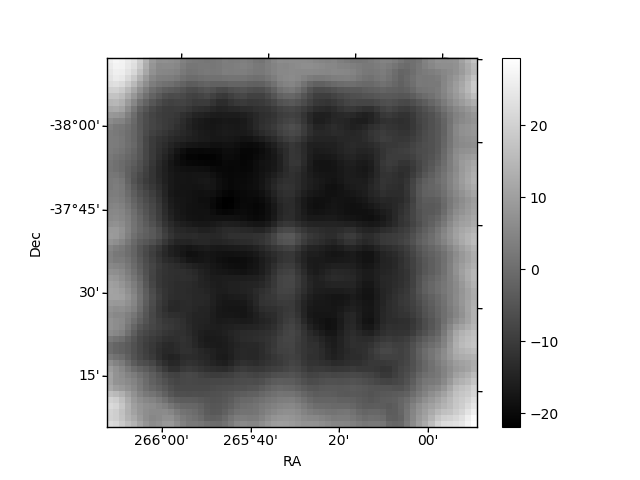
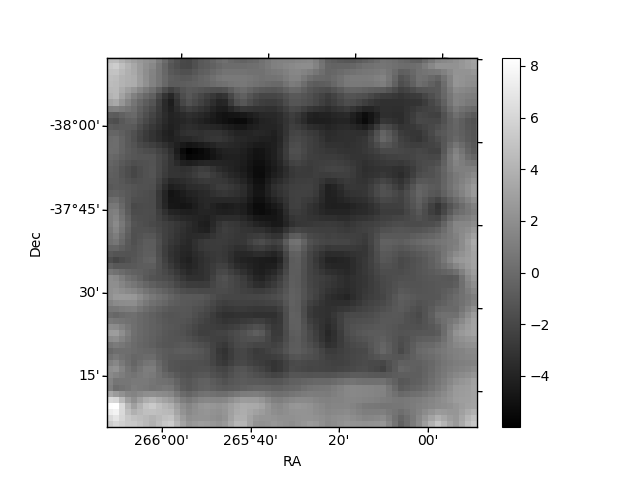
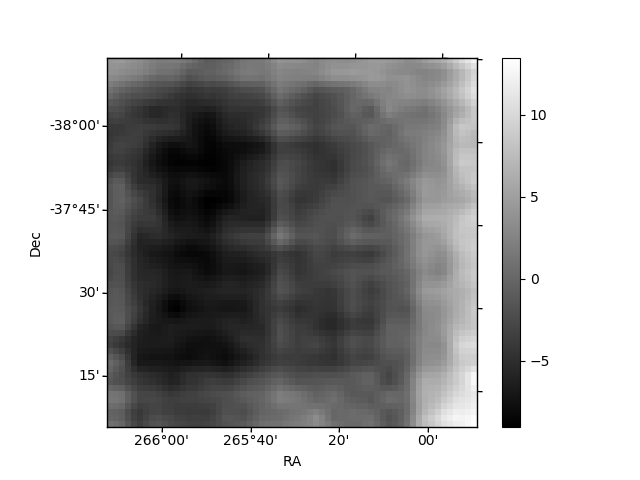
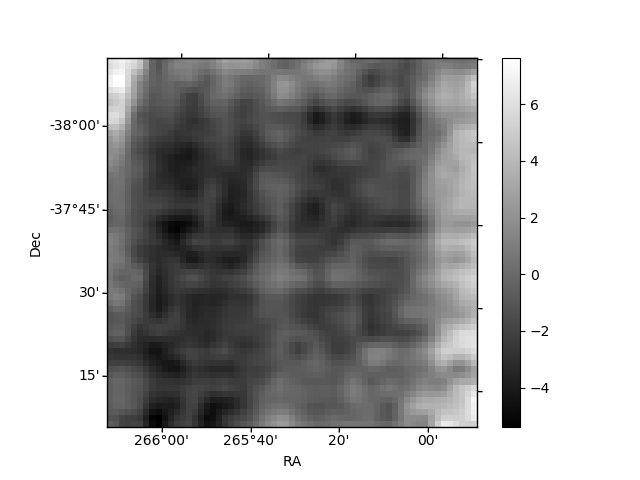
Histogram calculated using DETX and DETY for each event in the final _common_clean file
| Quadrant A | 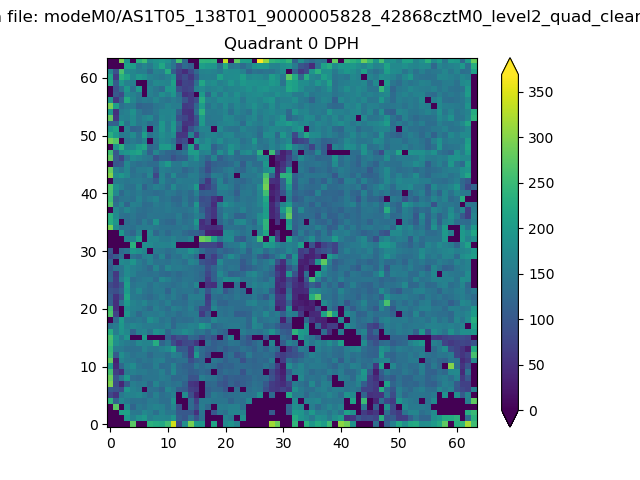 |
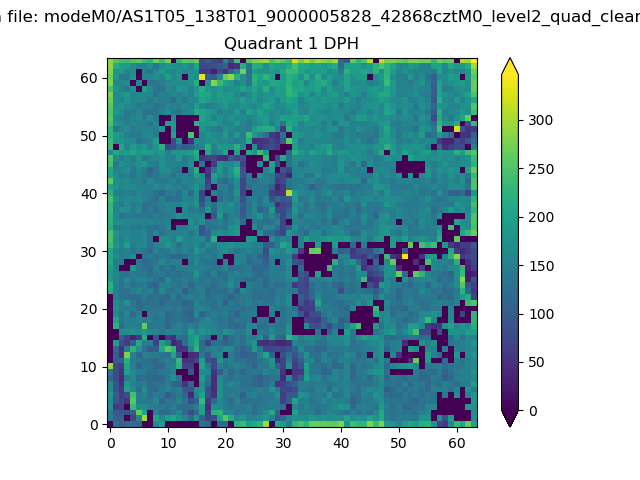 |
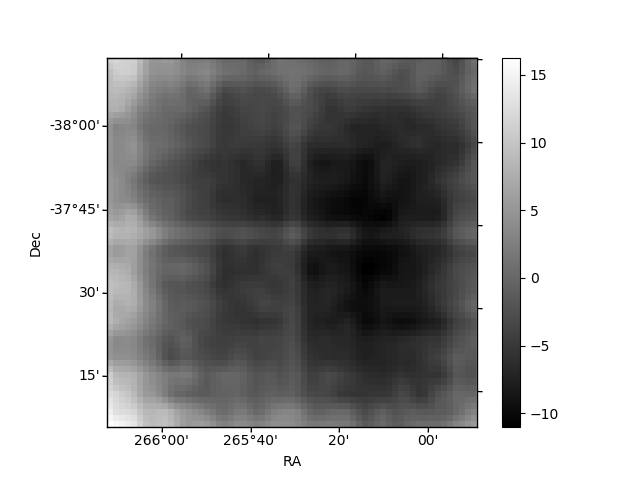
Quadrant B |
|---|---|---|---|
| Quadrant D | 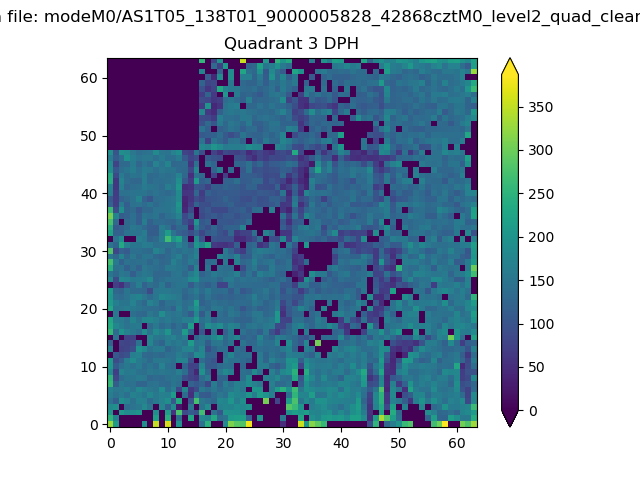 |
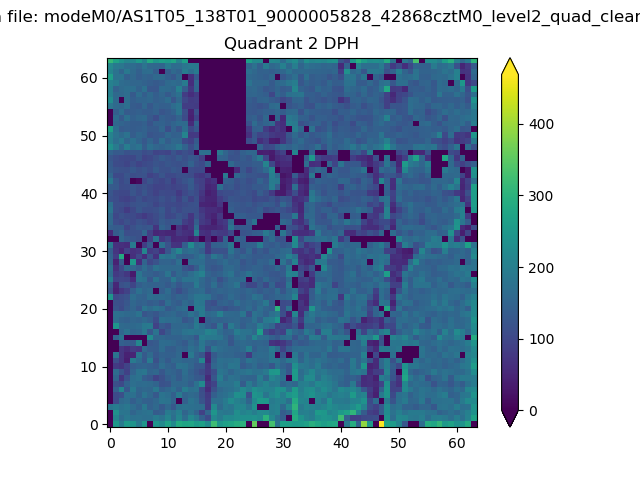 |
Quadrant C |
| Plot type | Count rate plots | Images |
|---|---|---|
| Comparison with Poisson distribution Blue bars denote a histogram of data divided into 1 sec bins. Red curve is a Poisson curve with rate = median count rate of data. |
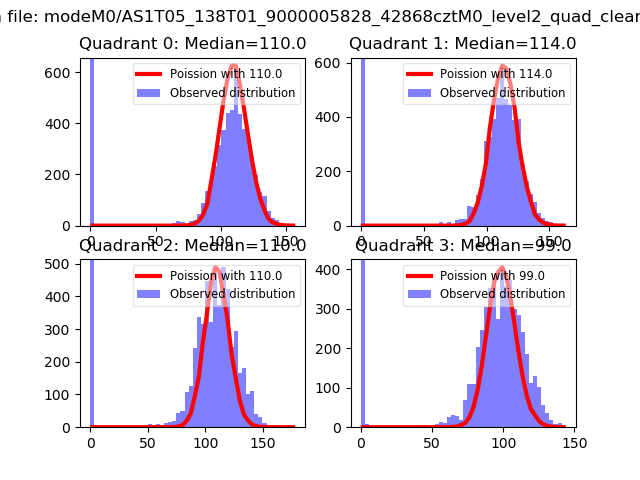 |
 |
| Quadrant-wise count rates Data is divided into 100 sec bins |
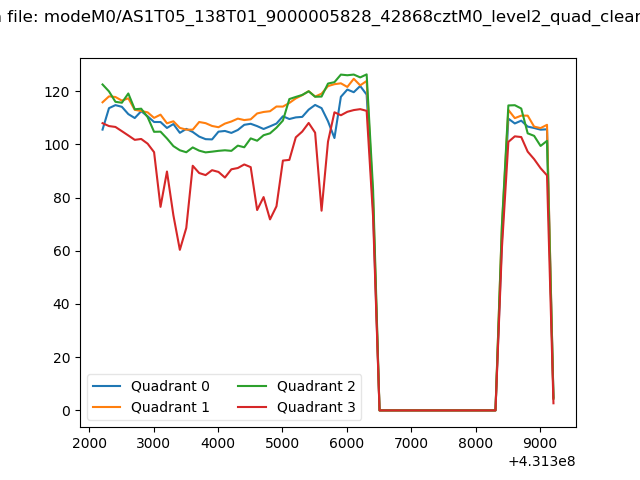 |
|
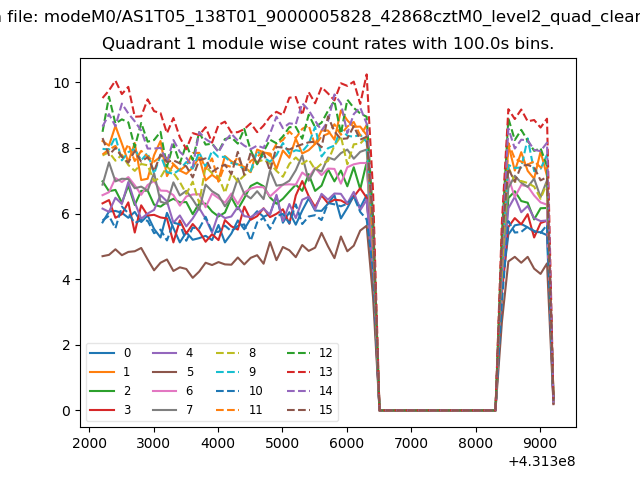
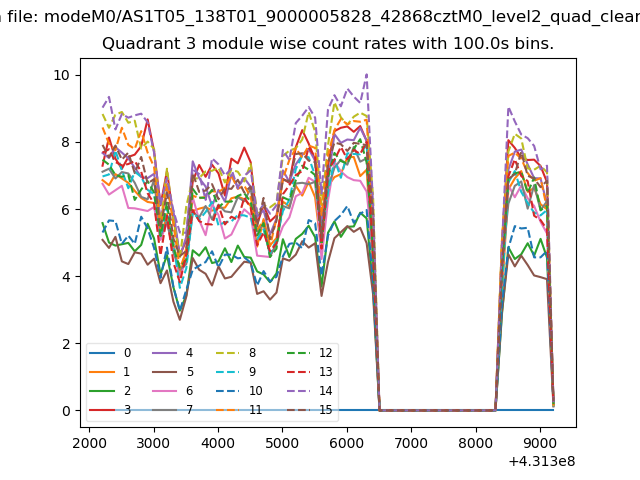
| Module-wise count rates for Quadrant A Data is divided into 100 sec bins |
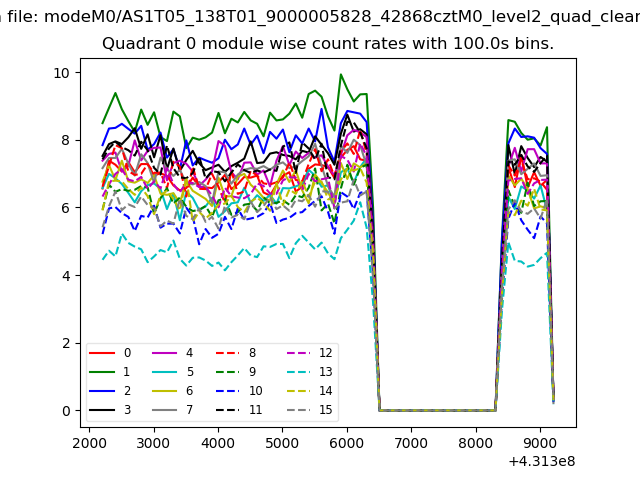 |
 |
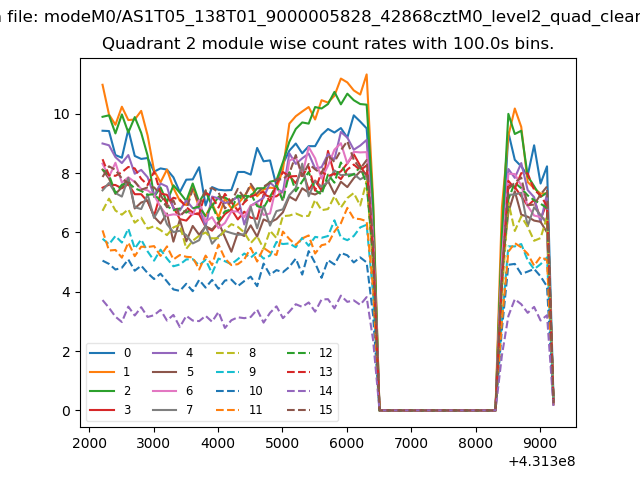
| Module-wise count rates for Quadrant B Data is divided into 100 sec bins |
 |
 |
| Module-wise count rates for Quadrant C Data is divided into 100 sec bins |
 |
 |
| Module-wise count rates for Quadrant D Data is divided into 100 sec bins |
 |
 |
| Parameter | Plot |
|---|---|
| CZT HV Monitor | 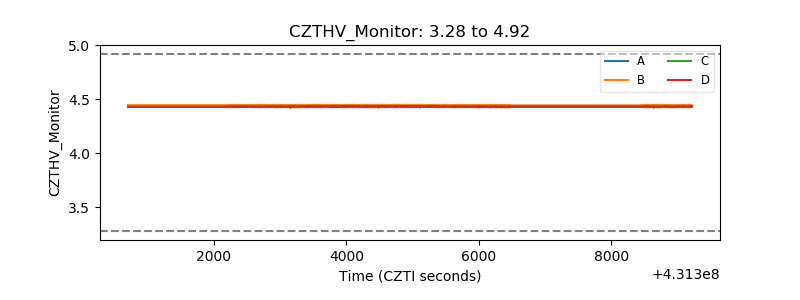 |
| D_VDD | 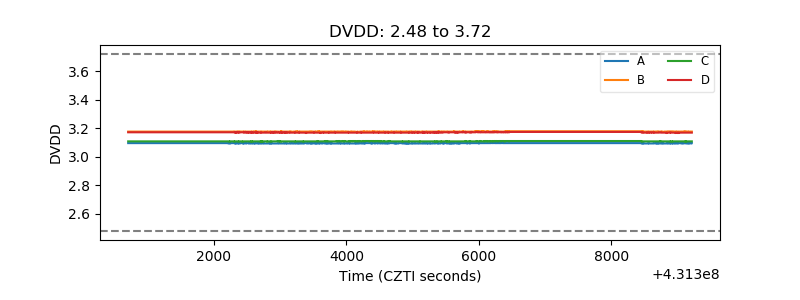 |
| Temperature 1 | 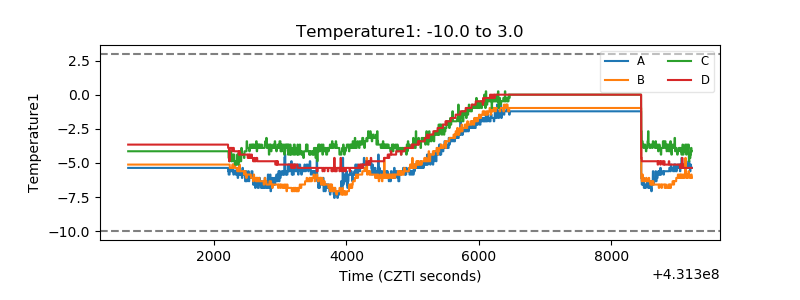 |
| Veto HV Monitor | 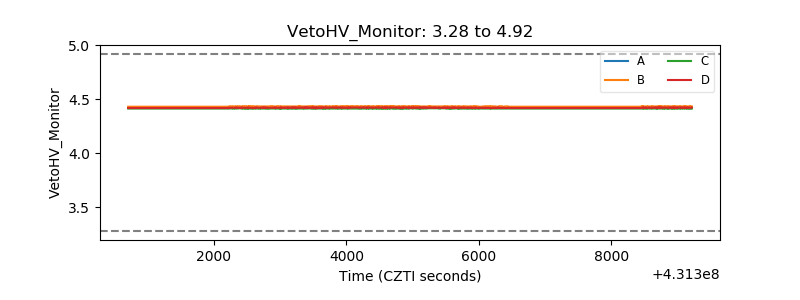 |
| Veto LLD | 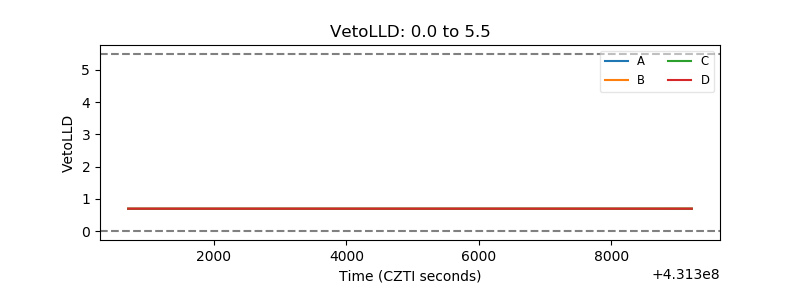 |
| Alpha Counter | 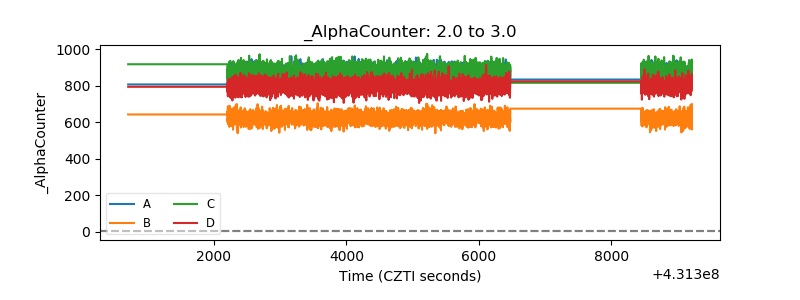 |
| _CPM_Rate |  |
| CZT Counter | 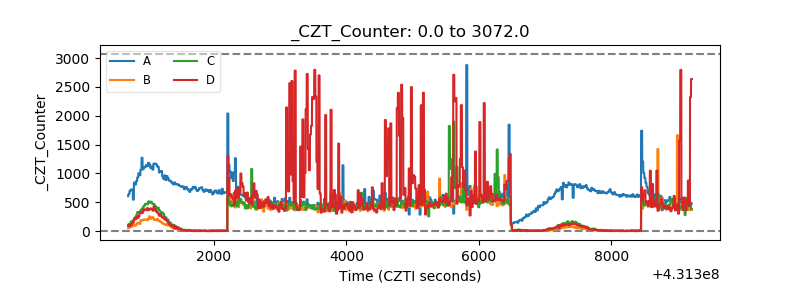 |
| +2.5 Volts monitor | 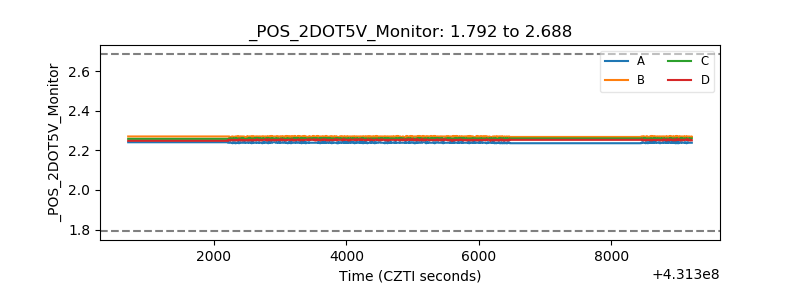 |
| +5 Volts monitor |  |
| _ROLL_ROT | 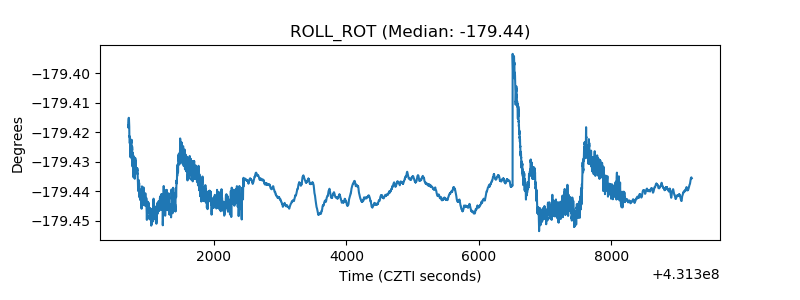 |
| _Roll_DEC | 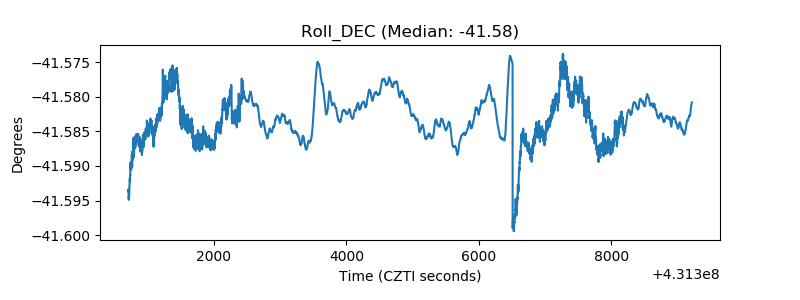 |
| _Roll_RA | 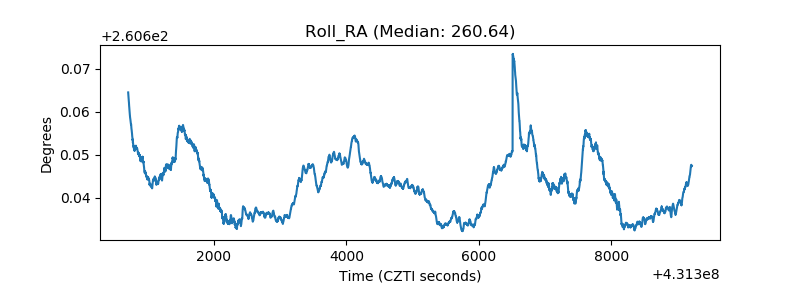 |
| Veto Counter | 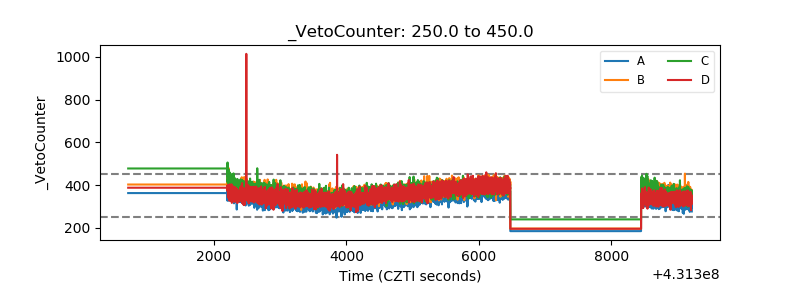 |