| Param | Original file | Final file |
|---|---|---|
| Filename | modeM0/AS1T05_138T01_9000005828_42869cztM0_level2.fits | modeM0/AS1T05_138T01_9000005828_42869cztM0_level2_quad_clean.evt |
| Size (bytes) | 351,993,600 | 88,001,280 |
| Size | 335.7 MB | 83.9 MB |
| Events in quadrant A | 3,020,913 | 586,434 |
| Events in quadrant B | 2,561,303 | 604,822 |
| Events in quadrant C | 2,711,358 | 586,471 |
| Events in quadrant D | 4,309,717 | 504,067 |
| Mode M0 | |||
|---|---|---|---|
| Quadrant | BADHDUFLAG | Total packets | Discarded packets |
| A | 0 | 12312 | 2 |
| B | 0 | 11398 | 2 |
| C | 0 | 11424 | 2 |
| D | 0 | 16618 | 2 |
| Mode M9 | |||
|---|---|---|---|
| Quadrant | BADHDUFLAG | Total packets | Discarded packets |
| A | 0 | 24 | 0 |
| B | 0 | 25 | 0 |
| C | 0 | 25 | 0 |
| D | 0 | 25 | 0 |
| Mode SS | |||
|---|---|---|---|
| Quadrant | BADHDUFLAG | Total packets | Discarded packets |
| A | 0 | 110 | 0 |
| B | 0 | 110 | 0 |
| C | 0 | 110 | 0 |
| D | 0 | 110 | 0 |
| Quadrant | Total seconds | Saturated seconds | Saturation percentage |
|---|---|---|---|
| A | 5473 | 35 | 0.639503% |
| B | 5473 | 24 | 0.438516% |
| C | 5473 | 10 | 0.182715% |
| D | 5473 | 456 | 8.331811% |
Noise dominated data is calculated using 1-second bins in cleaned event files. If a bin has >2000 counts, and if more than 50% of those come from <1% of pixels, then it is considered to be noise-dominated and hence unusable.
| Quadrant | # 1 sec bins | Bins with >0 counts | Bins with >2000 counts | High rate bins dominated by noise | Noise dominated (total time) | Noise dominated (detector-on time) | Marked lightcurve |
|---|---|---|---|---|---|---|---|
| A | 7117 | 5474 | 17 | 17 | 0.24% | 0.31% | 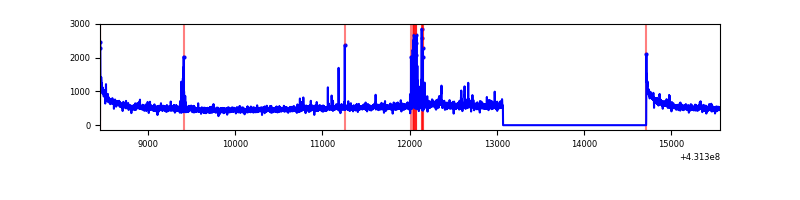 |
| B | 7117 | 5474 | 12 | 12 | 0.17% | 0.22% | 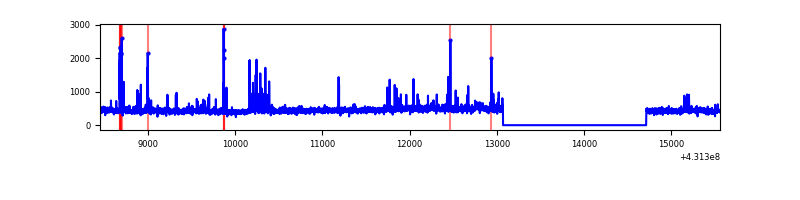 |
| C | 7117 | 5474 | 4 | 4 | 0.06% | 0.07% | 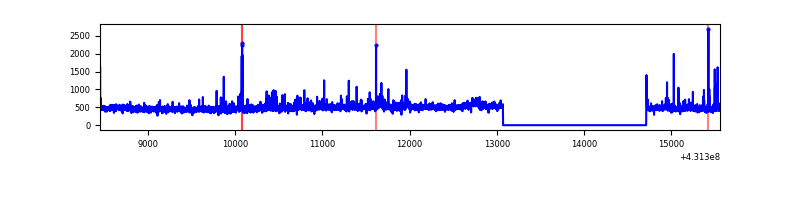 |
| D | 7117 | 5474 | 463 | 463 | 6.51% | 8.46% | 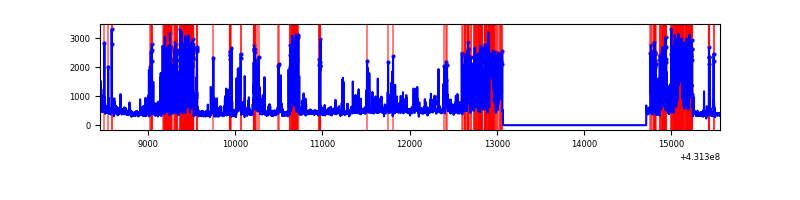 |
Top three noisy pixels from each quadrant. If the there are fewer than three noisy pixels in the level2.evt file, extra rows are filled as -1
| Pixel properties | Quadrant properties | ||||||
|---|---|---|---|---|---|---|---|
| Quadrant | DetID | PixID | Counts | Sigma | Mean | Median | Sigma |
| A | 10 | 83 | 592526 | 4846.97 | 589 | 577 | 122.1 |
| A | 15 | 237 | 72573 | 589.51 | 589 | 577 | 122.1 |
| A | 12 | 189 | 55730 | 451.6 | 589 | 577 | 122.1 |
| B | 0 | 190 | 56018 | 485.66 | 590 | 574 | 114.2 |
| B | 5 | 172 | 51538 | 446.42 | 590 | 574 | 114.2 |
| B | 4 | 171 | 36172 | 311.82 | 590 | 574 | 114.2 |
| C | 15 | 214 | 219749 | 1592.34 | 582 | 585 | 137.6 |
| C | 0 | 207 | 78424 | 565.54 | 582 | 585 | 137.6 |
| C | 12 | 2 | 51892 | 372.77 | 582 | 585 | 137.6 |
| D | 12 | 6 | 1202668 | 8591.47 | 560 | 544 | 139.9 |
| D | 2 | 249 | 255867 | 1824.77 | 560 | 544 | 139.9 |
| D | 12 | 233 | 235048 | 1675.98 | 560 | 544 | 139.9 |
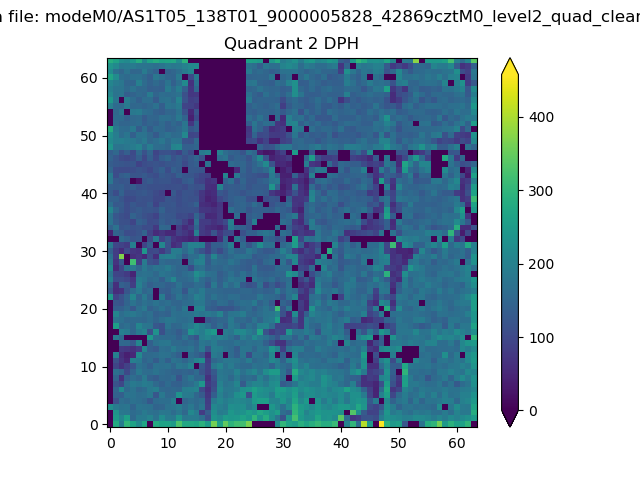
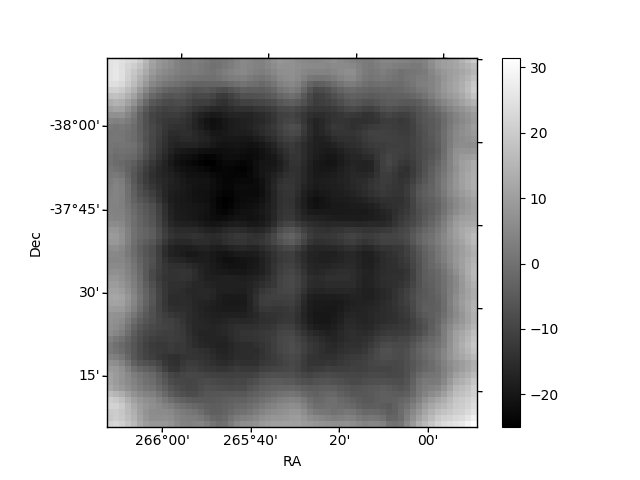
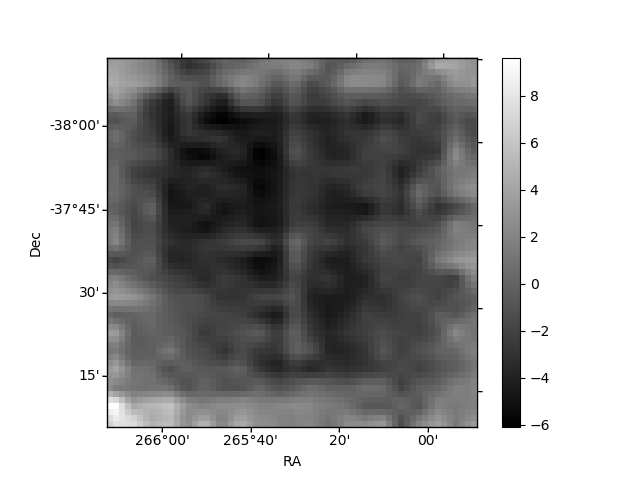
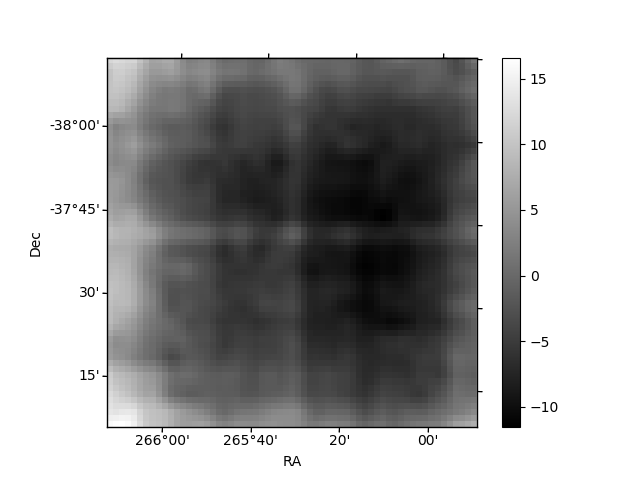
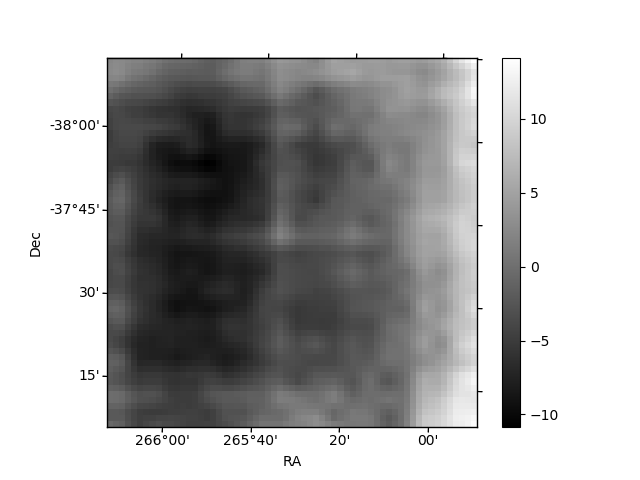
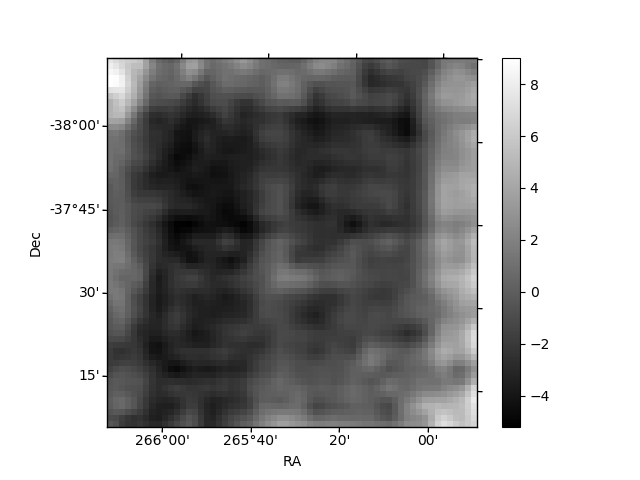
Histogram calculated using DETX and DETY for each event in the final _common_clean file
| Quadrant A | 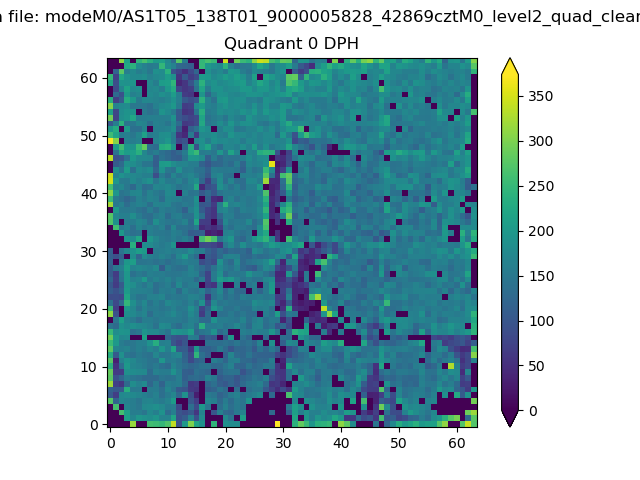 |
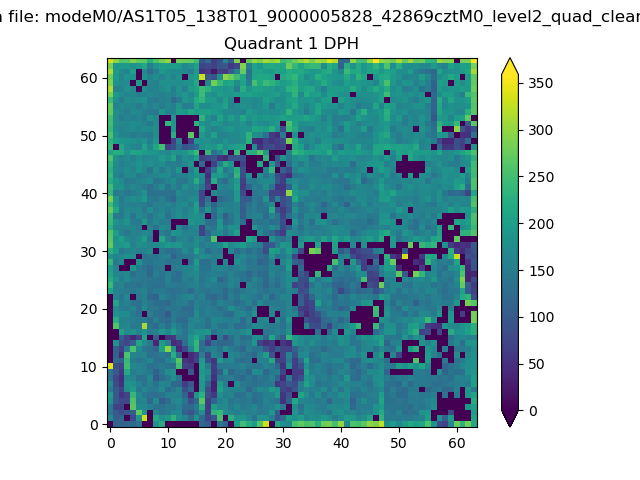 |
Quadrant B |
|---|---|---|---|
| Quadrant D | 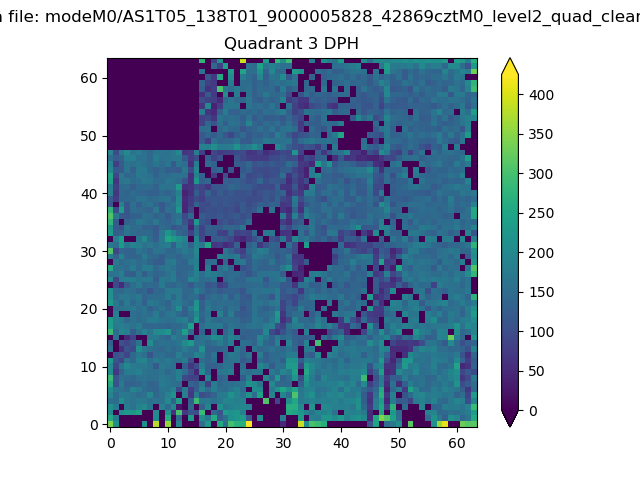 |
 |
Quadrant C |
| Plot type | Count rate plots | Images |
|---|---|---|
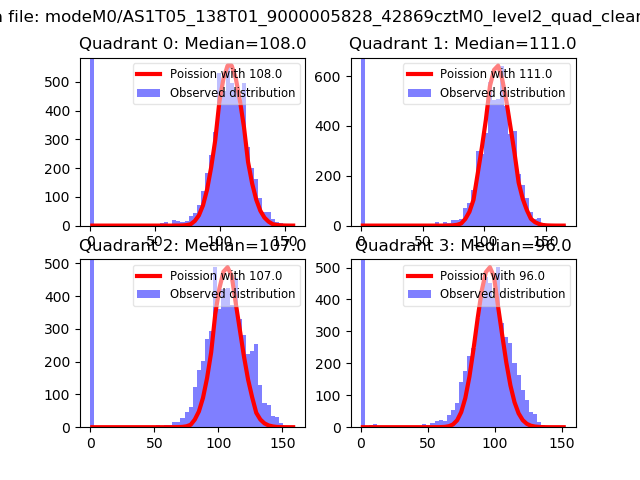
| Comparison with Poisson distribution Blue bars denote a histogram of data divided into 1 sec bins. Red curve is a Poisson curve with rate = median count rate of data. |
 |
 |
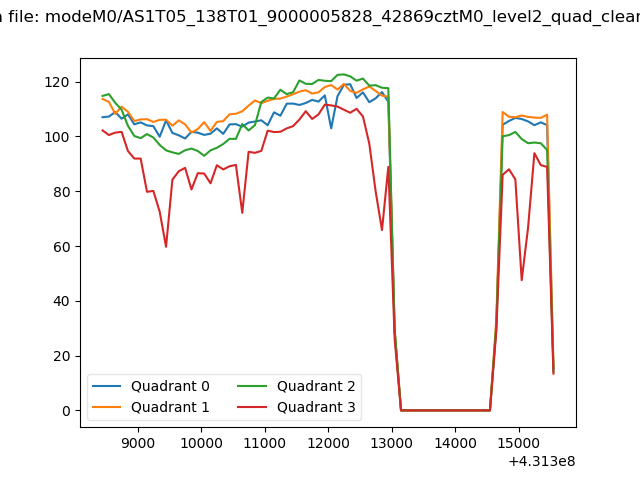
| Quadrant-wise count rates Data is divided into 100 sec bins |
 |
|
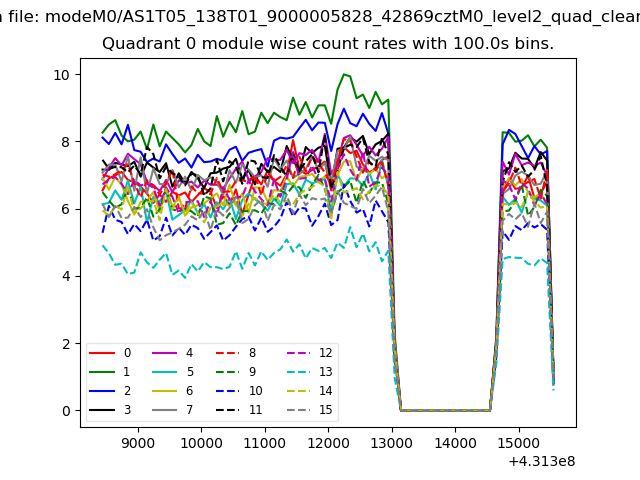
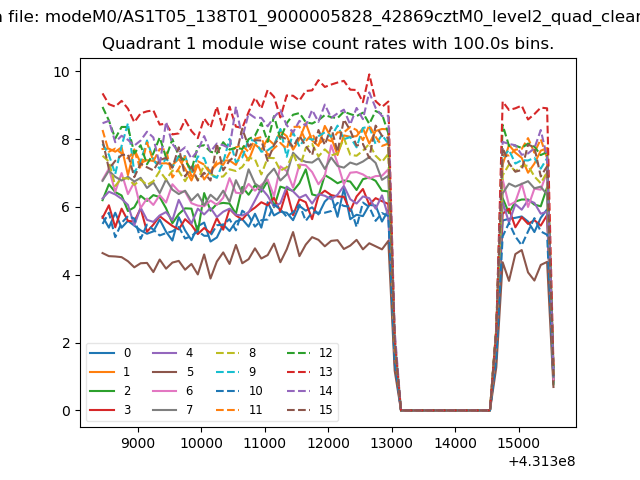
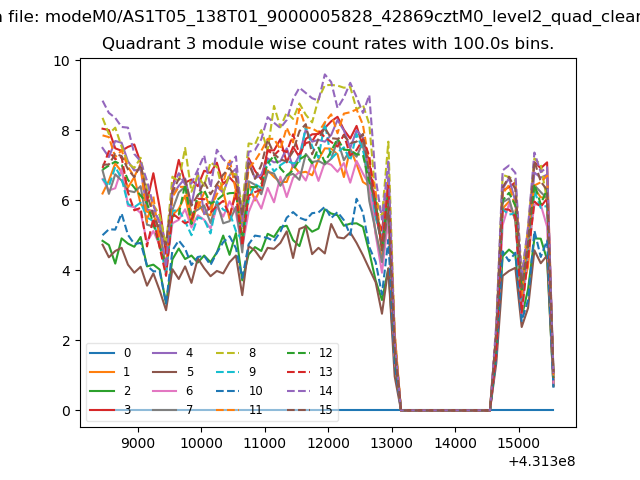
| Module-wise count rates for Quadrant A Data is divided into 100 sec bins |
 |
 |
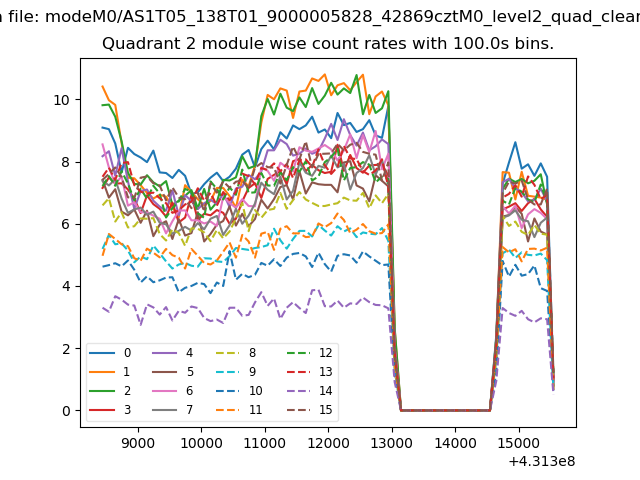
| Module-wise count rates for Quadrant B Data is divided into 100 sec bins |
 |
 |
| Module-wise count rates for Quadrant C Data is divided into 100 sec bins |
 |
 |
| Module-wise count rates for Quadrant D Data is divided into 100 sec bins |
 |
 |
| Parameter | Plot |
|---|---|
| CZT HV Monitor |  |
| D_VDD | 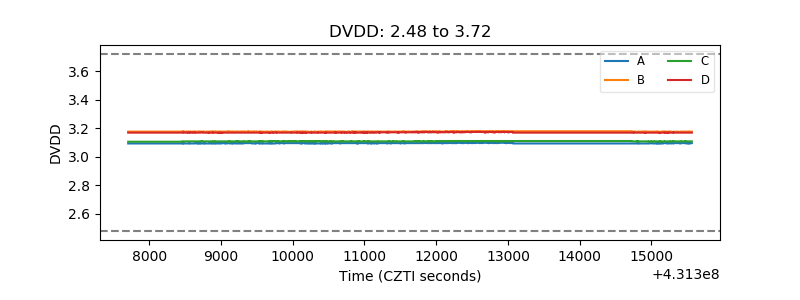 |
| Temperature 1 | 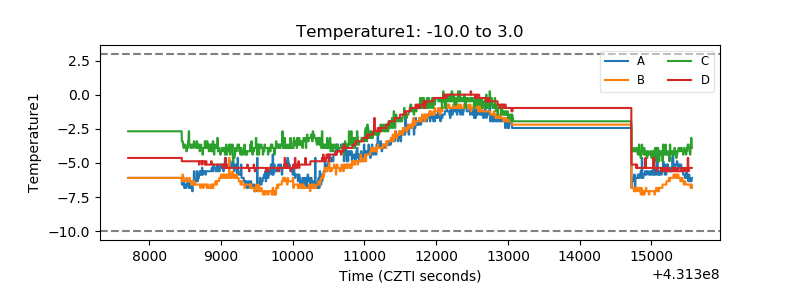 |
| Veto HV Monitor | 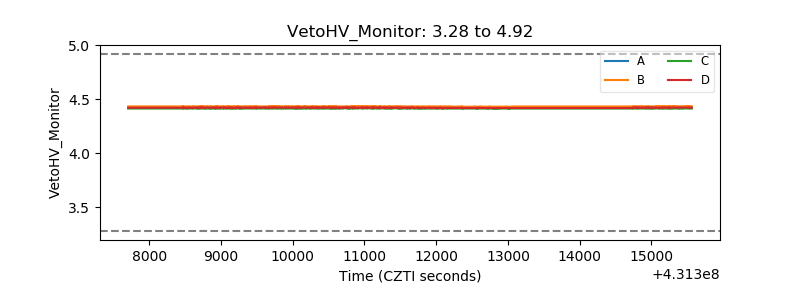 |
| Veto LLD |  |
| Alpha Counter | 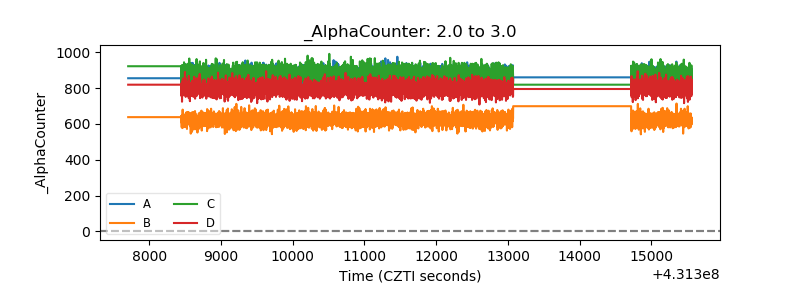 |
| _CPM_Rate | 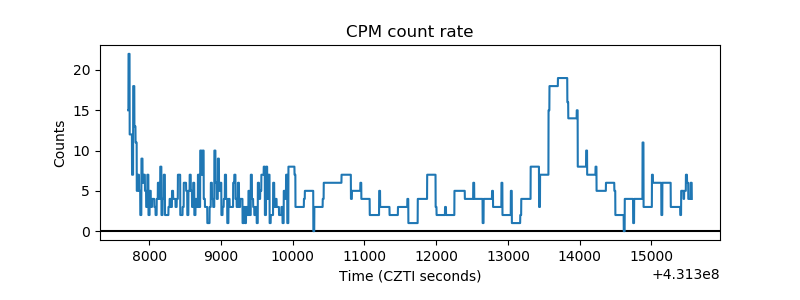 |
| CZT Counter | 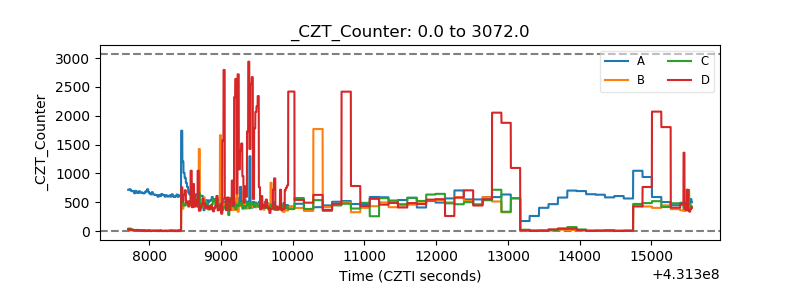 |
| +2.5 Volts monitor | 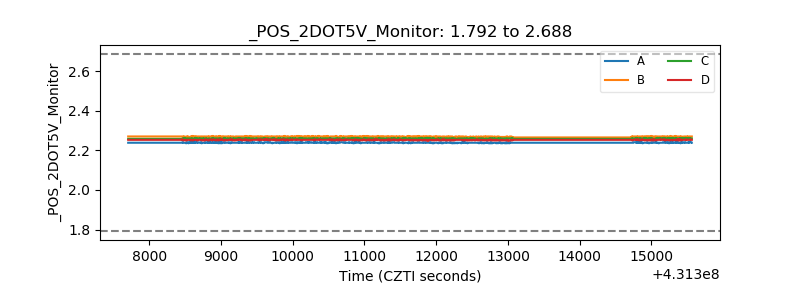 |
| +5 Volts monitor | 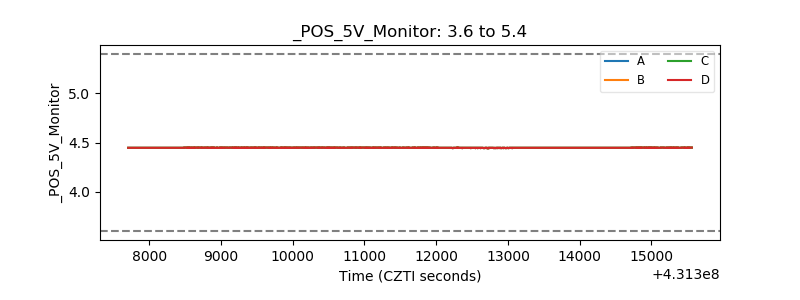 |
| _ROLL_ROT | 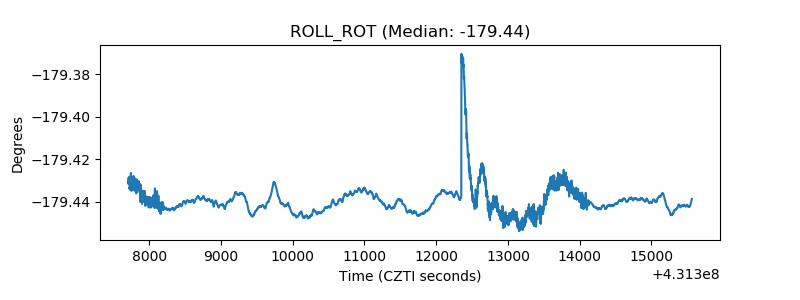 |
| _Roll_DEC | 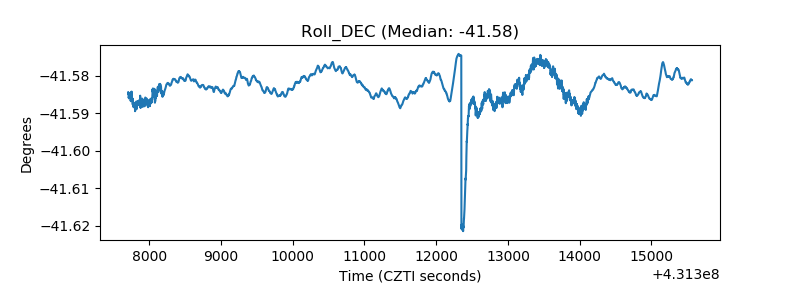 |
| _Roll_RA | 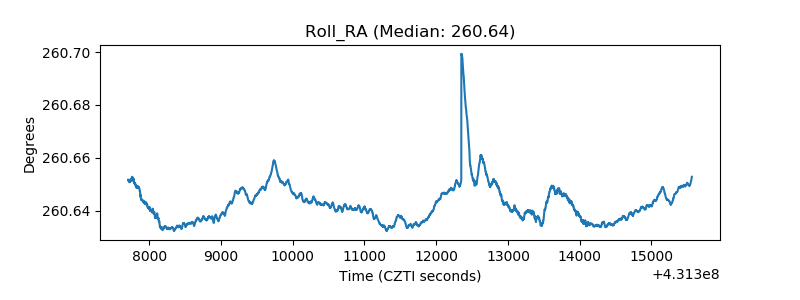 |
| Veto Counter | 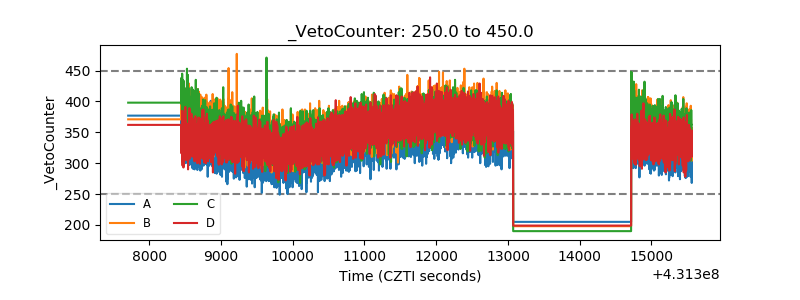 |