| Param | Original file | Final file |
|---|---|---|
| Filename | modeM0/AS1T05_138T01_9000005828_42870cztM0_level2.fits | modeM0/AS1T05_138T01_9000005828_42870cztM0_level2_quad_clean.evt |
| Size (bytes) | 415,670,400 | 95,739,840 |
| Size | 396.4 MB | 91.3 MB |
| Events in quadrant A | 3,389,175 | 644,503 |
| Events in quadrant B | 2,746,374 | 664,846 |
| Events in quadrant C | 3,286,374 | 646,707 |
| Events in quadrant D | 5,495,008 | 520,618 |
| Mode M0 | |||
|---|---|---|---|
| Quadrant | BADHDUFLAG | Total packets | Discarded packets |
| A | 0 | 13659 | 2 |
| B | 0 | 12444 | 2 |
| C | 0 | 13515 | 3 |
| D | 0 | 20575 | 2 |
| Mode M9 | |||
|---|---|---|---|
| Quadrant | BADHDUFLAG | Total packets | Discarded packets |
| A | 0 | 30 | 0 |
| B | 0 | 30 | 0 |
| C | 0 | 30 | 0 |
| D | 0 | 30 | 0 |
| Mode SS | |||
|---|---|---|---|
| Quadrant | BADHDUFLAG | Total packets | Discarded packets |
| A | 0 | 126 | 0 |
| B | 0 | 126 | 0 |
| C | 0 | 126 | 0 |
| D | 0 | 126 | 0 |
| Quadrant | Total seconds | Saturated seconds | Saturation percentage |
|---|---|---|---|
| A | 6039 | 35 | 0.579566% |
| B | 6040 | 11 | 0.182119% |
| C | 6039 | 47 | 0.778275% |
| D | 6039 | 840 | 13.909588% |
Noise dominated data is calculated using 1-second bins in cleaned event files. If a bin has >2000 counts, and if more than 50% of those come from <1% of pixels, then it is considered to be noise-dominated and hence unusable.
| Quadrant | # 1 sec bins | Bins with >0 counts | Bins with >2000 counts | High rate bins dominated by noise | Noise dominated (total time) | Noise dominated (detector-on time) | Marked lightcurve |
|---|---|---|---|---|---|---|---|
| A | 9055 | 6041 | 22 | 22 | 0.24% | 0.36% | 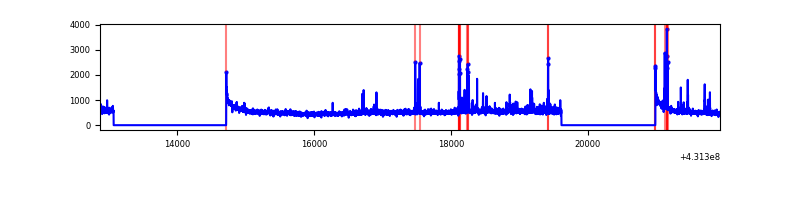 |
| B | 9056 | 6042 | 6 | 6 | 0.07% | 0.10% | 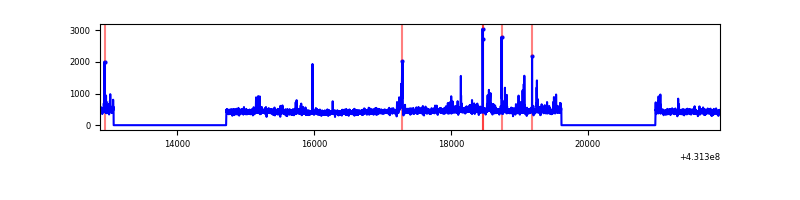 |
| C | 9055 | 6041 | 38 | 38 | 0.42% | 0.63% | 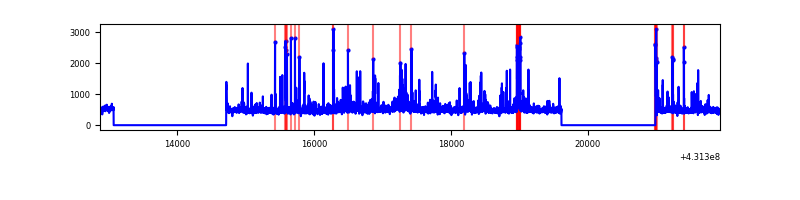 |
| D | 9055 | 6041 | 829 | 829 | 9.16% | 13.72% | 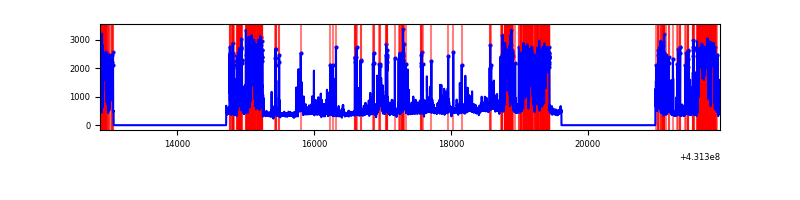 |
Top three noisy pixels from each quadrant. If the there are fewer than three noisy pixels in the level2.evt file, extra rows are filled as -1
| Pixel properties | Quadrant properties | ||||||
|---|---|---|---|---|---|---|---|
| Quadrant | DetID | PixID | Counts | Sigma | Mean | Median | Sigma |
| A | 10 | 83 | 634155 | 4677.18 | 650 | 637 | 135.4 |
| A | 15 | 237 | 109273 | 802.05 | 650 | 637 | 135.4 |
| A | 12 | 189 | 40719 | 295.92 | 650 | 637 | 135.4 |
| B | 15 | 35 | 49739 | 386.16 | 652 | 634 | 127.2 |
| B | 4 | 171 | 44281 | 343.24 | 652 | 634 | 127.2 |
| B | 15 | 85 | 39143 | 302.83 | 652 | 634 | 127.2 |
| C | 15 | 214 | 245735 | 1623.24 | 639 | 644 | 151.0 |
| C | 12 | 2 | 176932 | 1167.56 | 639 | 644 | 151.0 |
| C | 14 | 254 | 138708 | 914.4 | 639 | 644 | 151.0 |
| D | 10 | 118 | 968460 | 6516.84 | 598 | 580 | 148.5 |
| D | 12 | 6 | 946440 | 6368.58 | 598 | 580 | 148.5 |
| D | 13 | 249 | 750442 | 5048.9 | 598 | 580 | 148.5 |
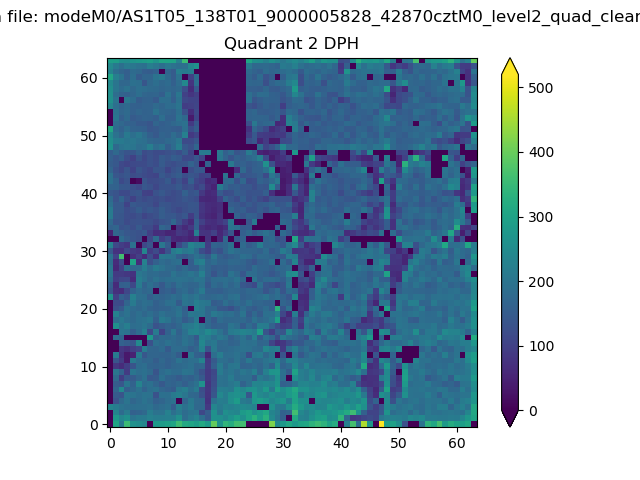
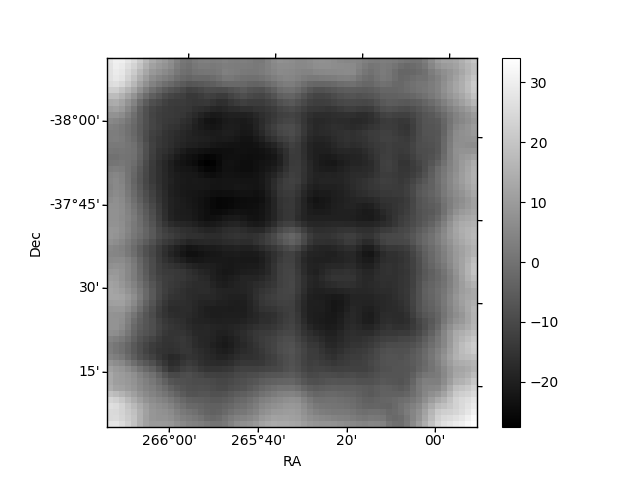
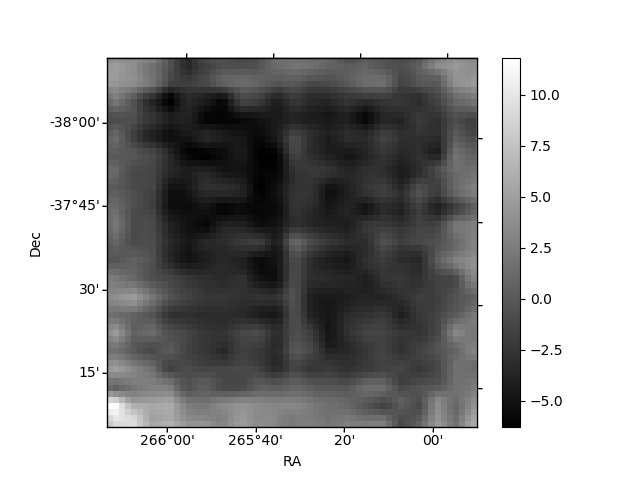
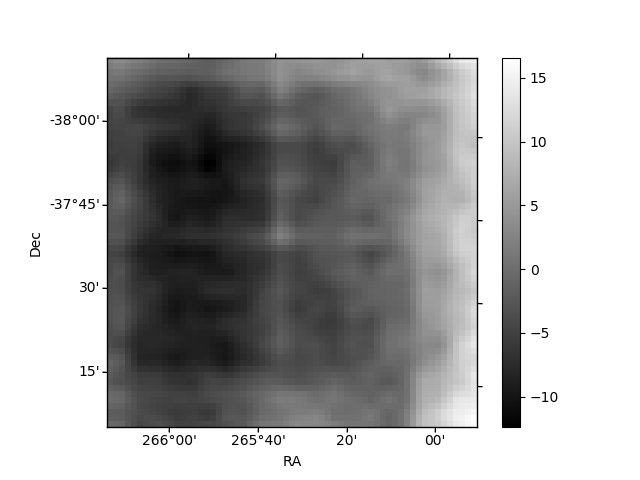
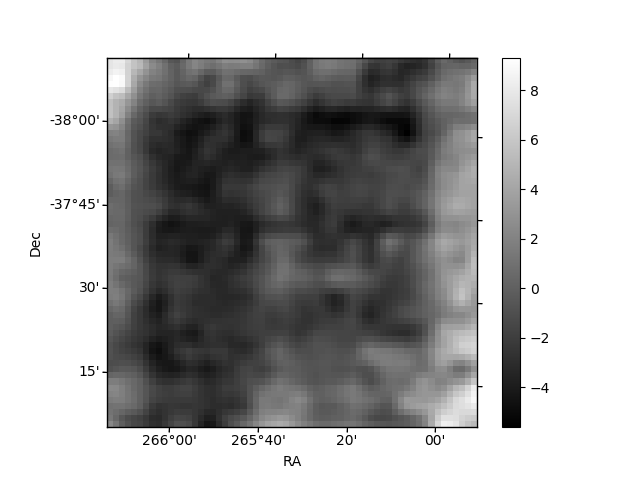
Histogram calculated using DETX and DETY for each event in the final _common_clean file
| Quadrant A | 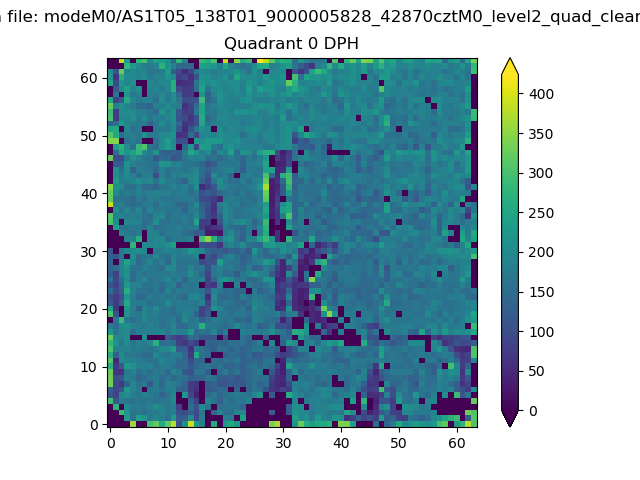 |
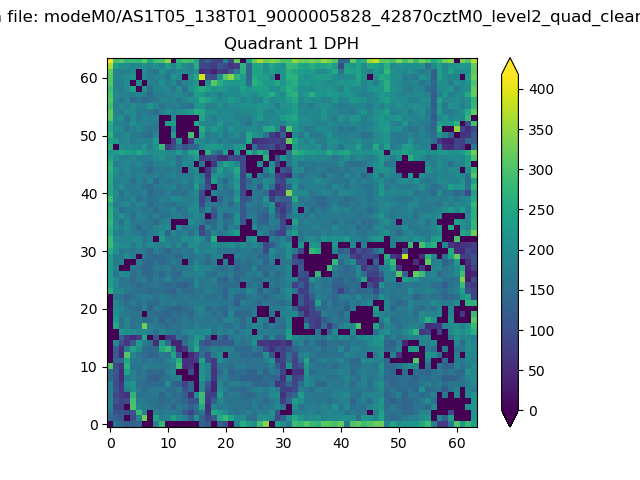 |
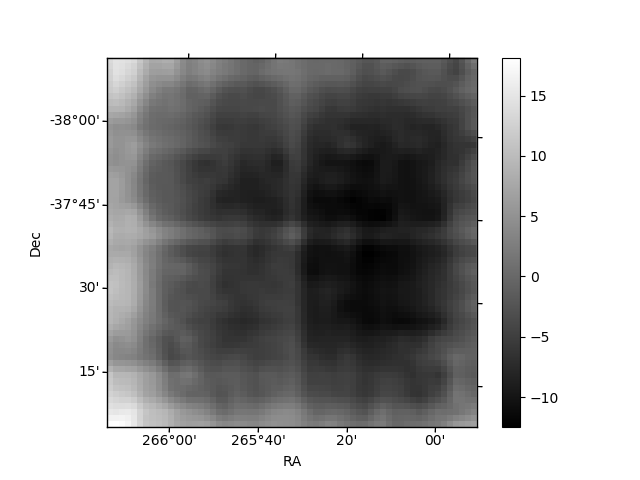
Quadrant B |
|---|---|---|---|
| Quadrant D | 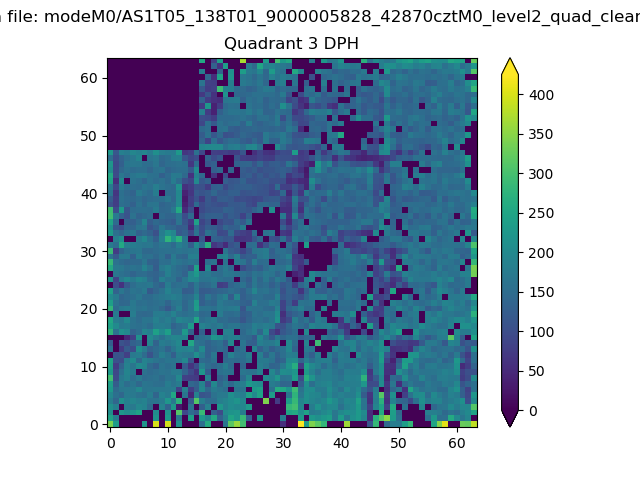 |
 |
Quadrant C |
| Plot type | Count rate plots | Images |
|---|---|---|
| Comparison with Poisson distribution Blue bars denote a histogram of data divided into 1 sec bins. Red curve is a Poisson curve with rate = median count rate of data. |
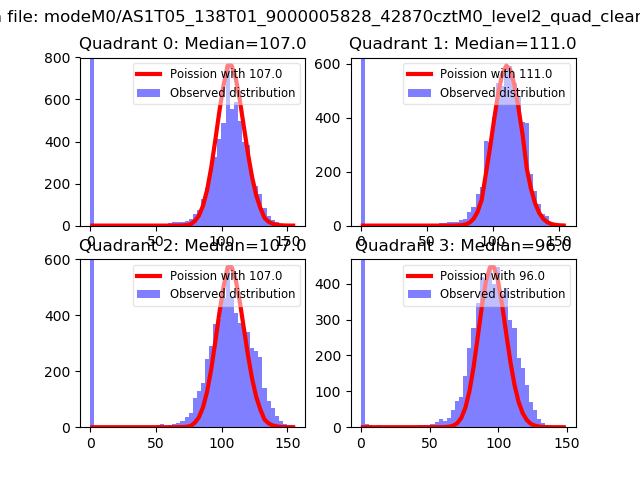 |
 |
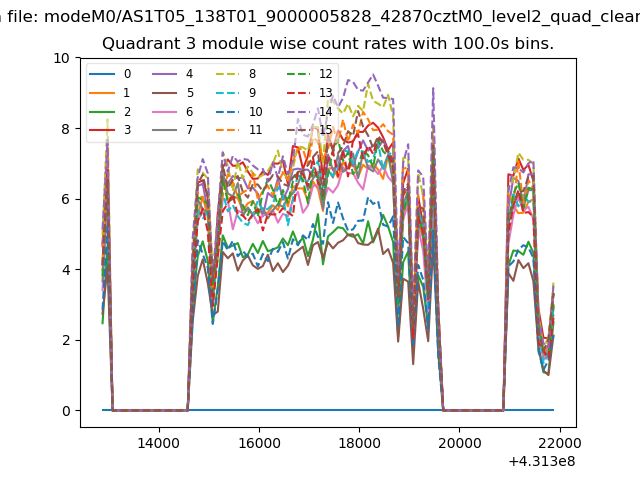
| Quadrant-wise count rates Data is divided into 100 sec bins |
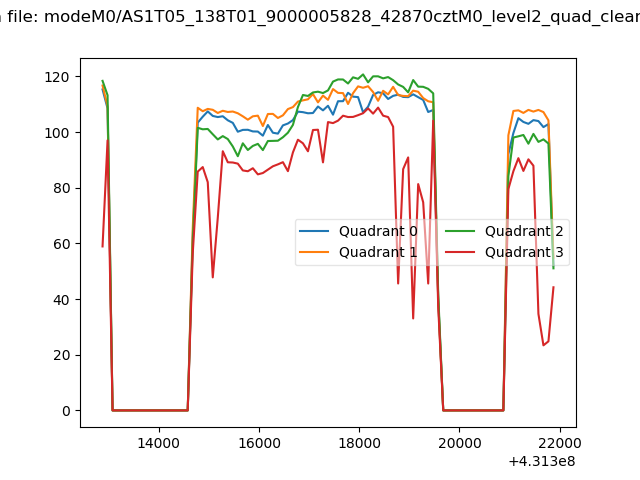 |
|
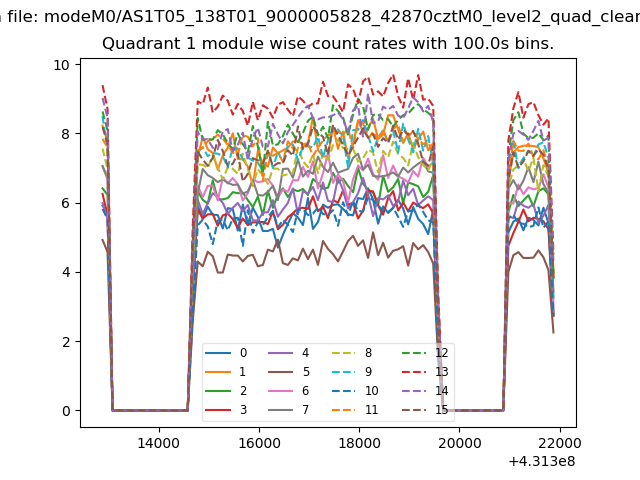
| Module-wise count rates for Quadrant A Data is divided into 100 sec bins |
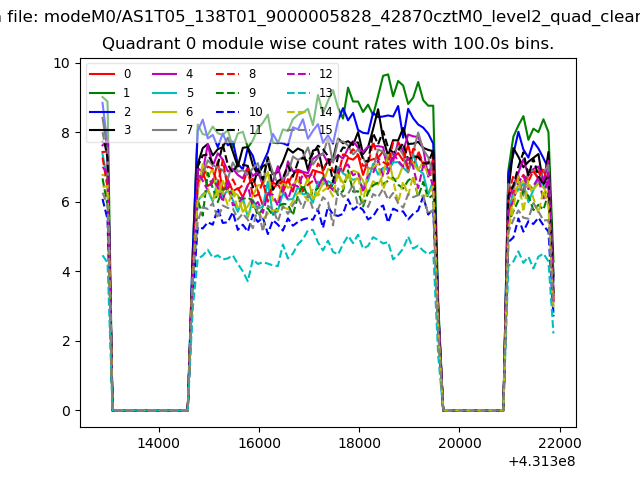 |
 |
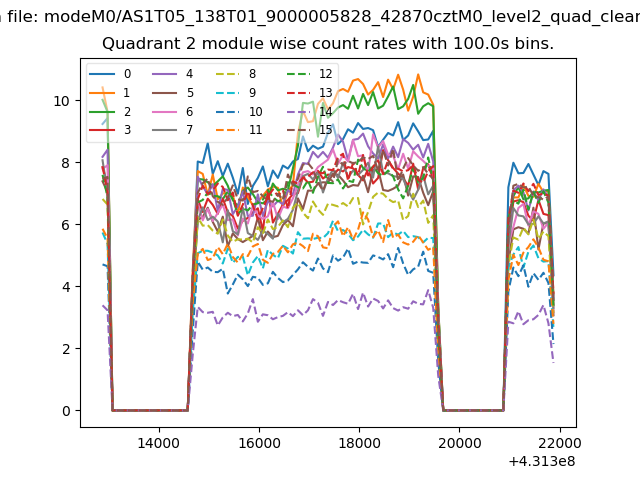
| Module-wise count rates for Quadrant B Data is divided into 100 sec bins |
 |
 |
| Module-wise count rates for Quadrant C Data is divided into 100 sec bins |
 |
 |
| Module-wise count rates for Quadrant D Data is divided into 100 sec bins |
 |
 |
| Parameter | Plot |
|---|---|
| CZT HV Monitor | 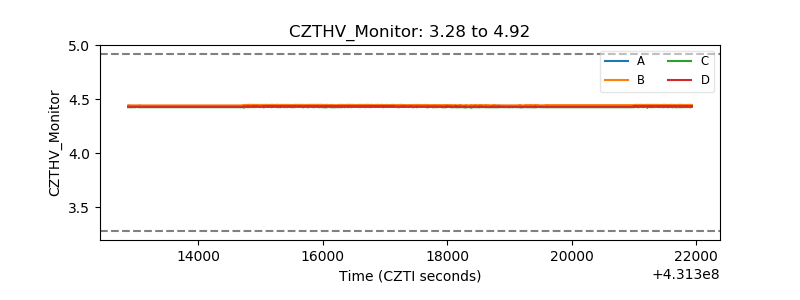 |
| D_VDD | 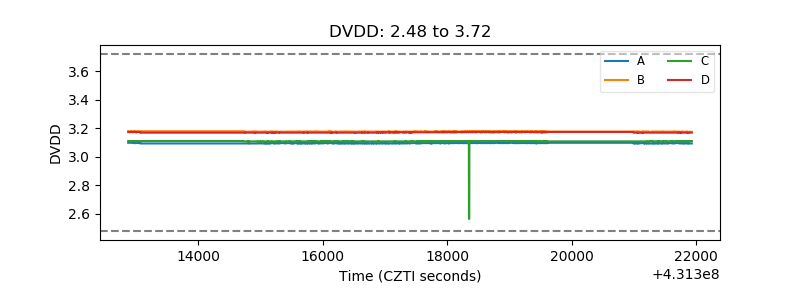 |
| Temperature 1 | 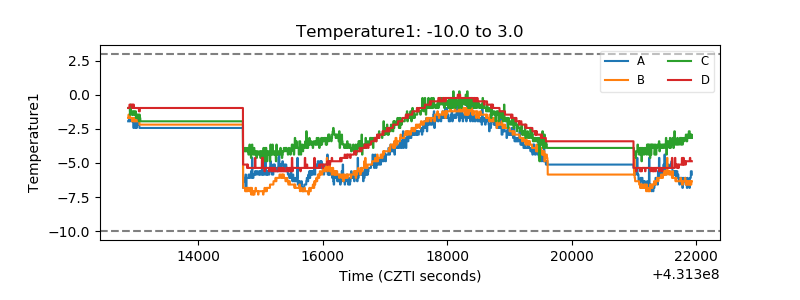 |
| Veto HV Monitor | 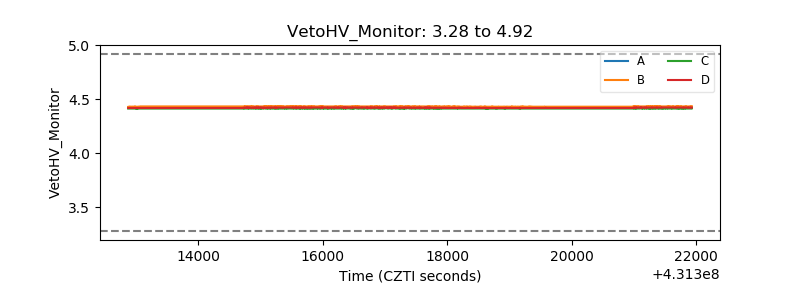 |
| Veto LLD | 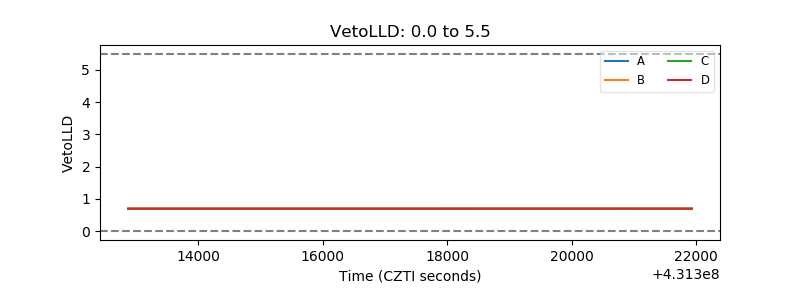 |
| Alpha Counter | 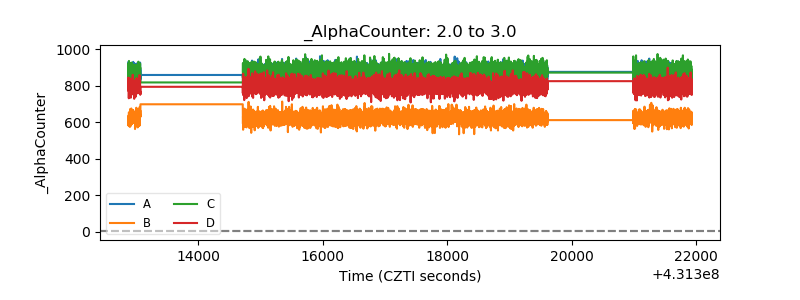 |
| _CPM_Rate | 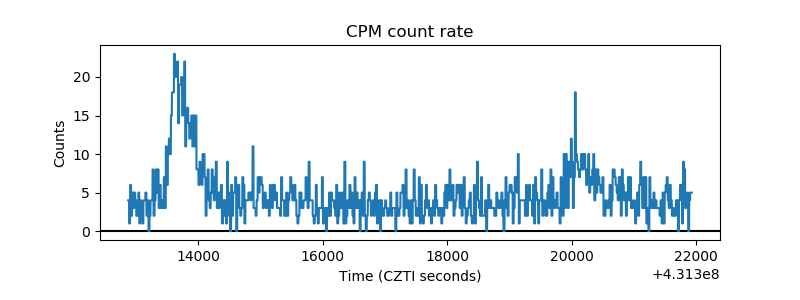 |
| CZT Counter | 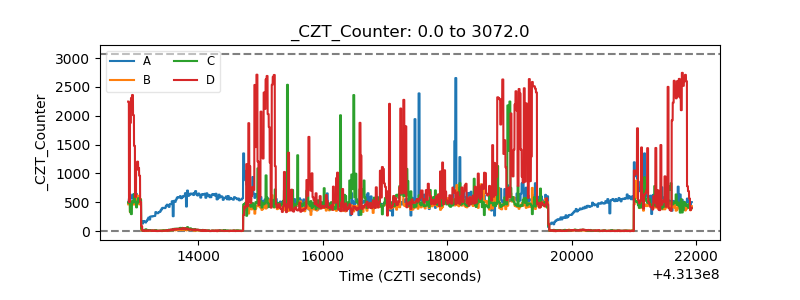 |
| +2.5 Volts monitor | 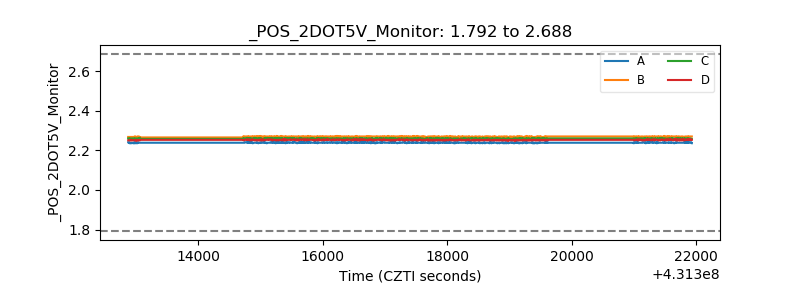 |
| +5 Volts monitor | 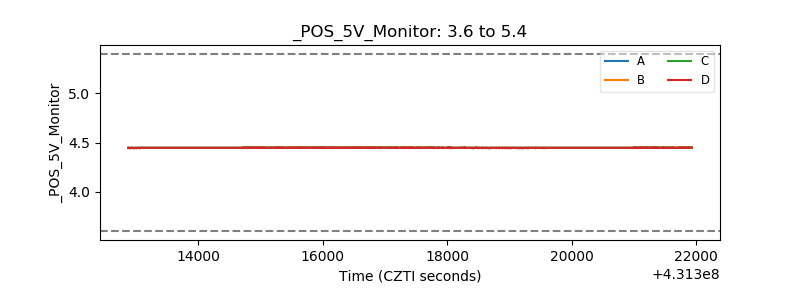 |
| _ROLL_ROT | 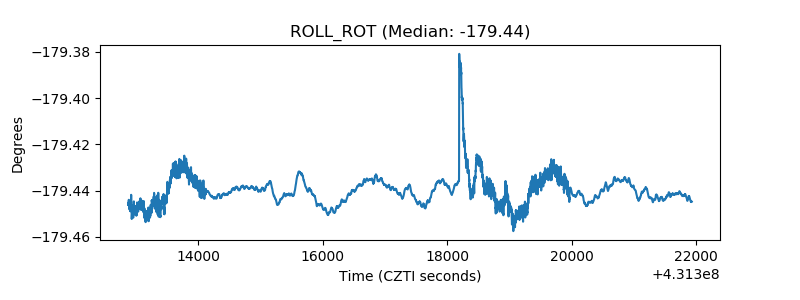 |
| _Roll_DEC | 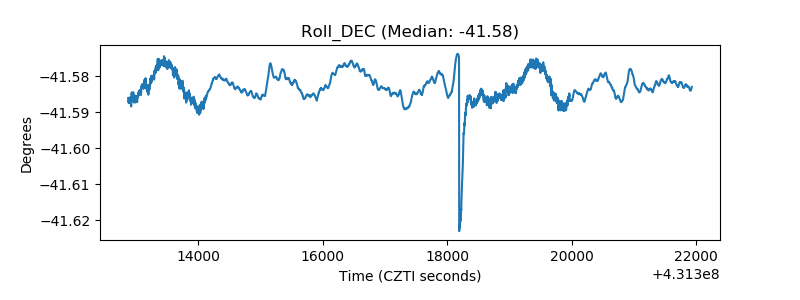 |
| _Roll_RA | 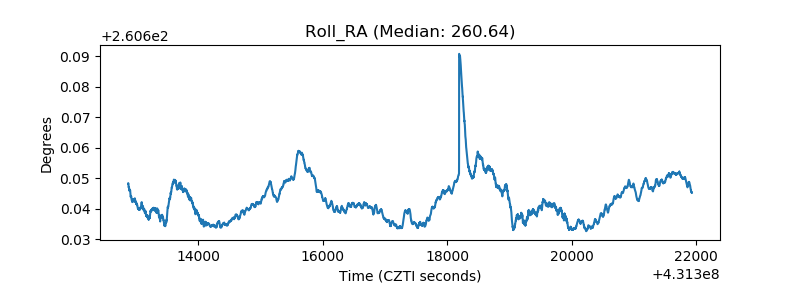 |
| Veto Counter | 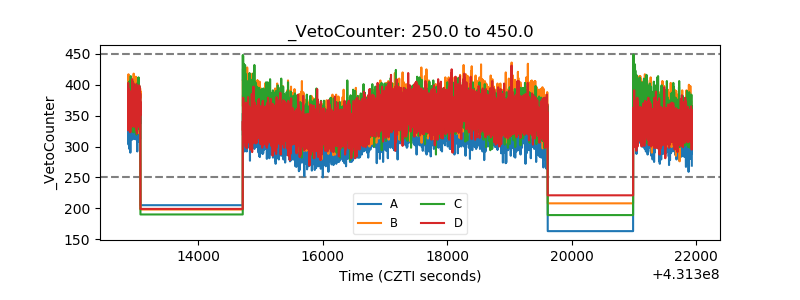 |