| Param | Original file | Final file |
|---|---|---|
| Filename | modeM0/AS1T05_138T01_9000005828_42871cztM0_level2.fits | modeM0/AS1T05_138T01_9000005828_42871cztM0_level2_quad_clean.evt |
| Size (bytes) | 443,332,800 | 91,609,920 |
| Size | 422.8 MB | 87.4 MB |
| Events in quadrant A | 3,406,165 | 626,299 |
| Events in quadrant B | 2,805,454 | 648,783 |
| Events in quadrant C | 3,932,669 | 625,073 |
| Events in quadrant D | 5,806,001 | 459,647 |
| Mode M0 | |||
|---|---|---|---|
| Quadrant | BADHDUFLAG | Total packets | Discarded packets |
| A | 0 | 13566 | 2 |
| B | 0 | 12481 | 2 |
| C | 0 | 15420 | 2 |
| D | 0 | 21246 | 2 |
| Mode M9 | |||
|---|---|---|---|
| Quadrant | BADHDUFLAG | Total packets | Discarded packets |
| A | 0 | 21 | 0 |
| B | 0 | 22 | 0 |
| C | 0 | 22 | 0 |
| D | 0 | 22 | 0 |
| Mode SS | |||
|---|---|---|---|
| Quadrant | BADHDUFLAG | Total packets | Discarded packets |
| A | 0 | 122 | 0 |
| B | 0 | 122 | 0 |
| C | 0 | 122 | 0 |
| D | 0 | 122 | 0 |
| Quadrant | Total seconds | Saturated seconds | Saturation percentage |
|---|---|---|---|
| A | 5917 | 62 | 1.047828% |
| B | 5917 | 36 | 0.608416% |
| C | 5917 | 184 | 3.109684% |
| D | 5917 | 1336 | 22.579010% |
Noise dominated data is calculated using 1-second bins in cleaned event files. If a bin has >2000 counts, and if more than 50% of those come from <1% of pixels, then it is considered to be noise-dominated and hence unusable.
| Quadrant | # 1 sec bins | Bins with >0 counts | Bins with >2000 counts | High rate bins dominated by noise | Noise dominated (total time) | Noise dominated (detector-on time) | Marked lightcurve |
|---|---|---|---|---|---|---|---|
| A | 7230 | 5918 | 40 | 40 | 0.55% | 0.68% | 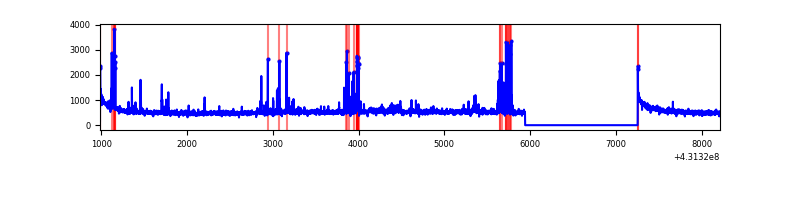 |
| B | 7230 | 5918 | 19 | 19 | 0.26% | 0.32% | 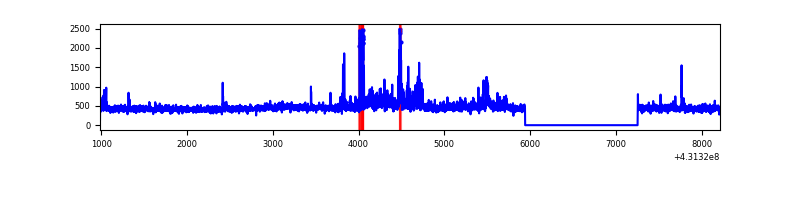 |
| C | 7230 | 5918 | 182 | 182 | 2.52% | 3.08% | 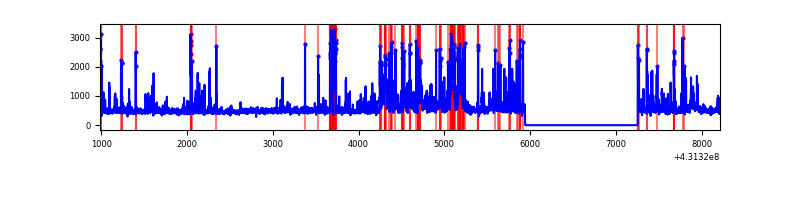 |
| D | 7230 | 5918 | 1050 | 1050 | 14.52% | 17.74% | 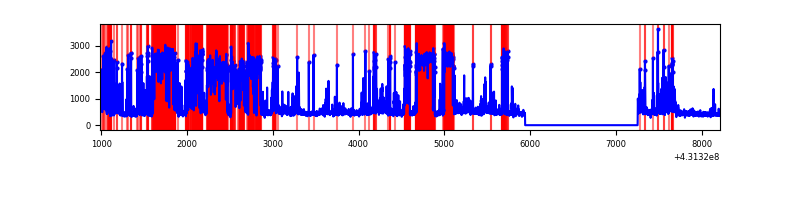 |
Top three noisy pixels from each quadrant. If the there are fewer than three noisy pixels in the level2.evt file, extra rows are filled as -1
| Pixel properties | Quadrant properties | ||||||
|---|---|---|---|---|---|---|---|
| Quadrant | DetID | PixID | Counts | Sigma | Mean | Median | Sigma |
| A | 10 | 83 | 634488 | 4786.74 | 639 | 625 | 132.4 |
| A | 15 | 237 | 178416 | 1342.62 | 639 | 625 | 132.4 |
| A | 10 | 255 | 54408 | 406.15 | 639 | 625 | 132.4 |
| B | 4 | 171 | 66468 | 530.35 | 638 | 619 | 124.2 |
| B | 4 | 81 | 66313 | 529.1 | 638 | 619 | 124.2 |
| B | 0 | 190 | 63064 | 502.93 | 638 | 619 | 124.2 |
| C | 5 | 250 | 555171 | 3759.32 | 626 | 628 | 147.5 |
| C | 12 | 2 | 296029 | 2002.56 | 626 | 628 | 147.5 |
| C | 15 | 214 | 237378 | 1604.96 | 626 | 628 | 147.5 |
| D | 13 | 249 | 2049978 | 15287.54 | 546 | 530 | 134.1 |
| D | 10 | 118 | 840711 | 6267.2 | 546 | 530 | 134.1 |
| D | 12 | 6 | 397599 | 2961.88 | 546 | 530 | 134.1 |
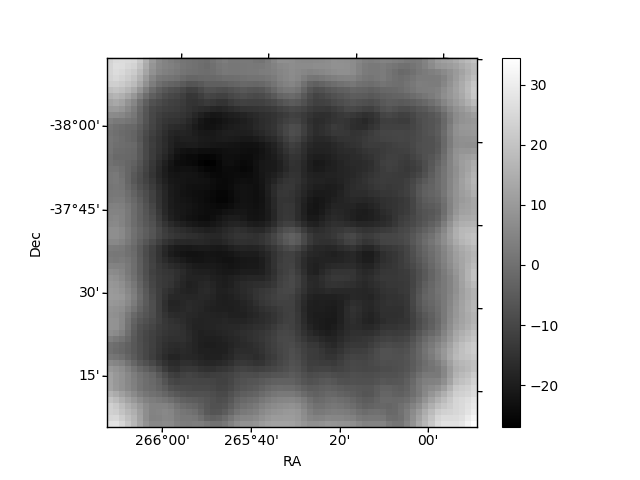
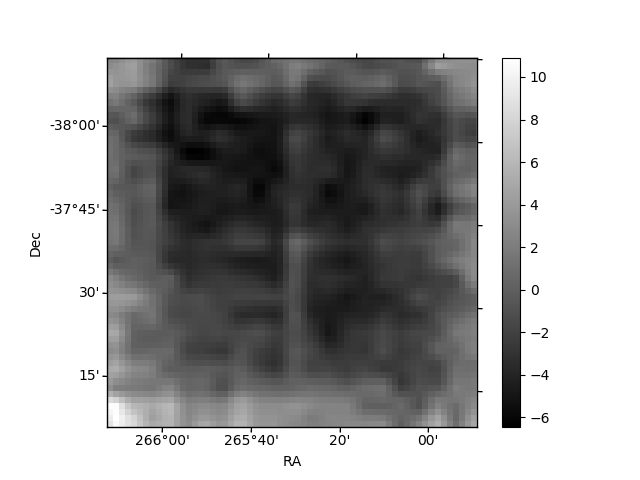
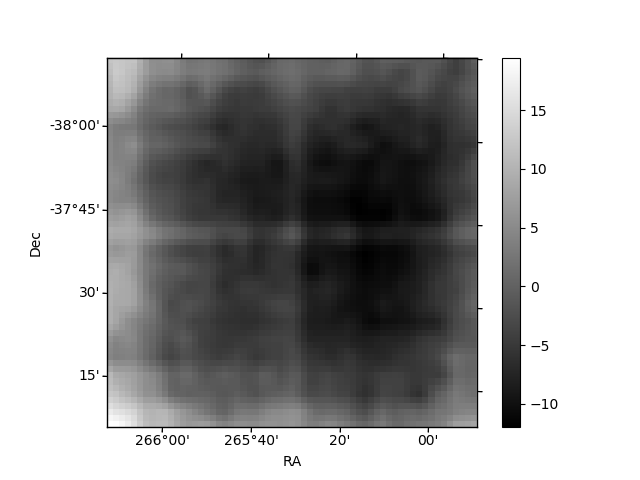
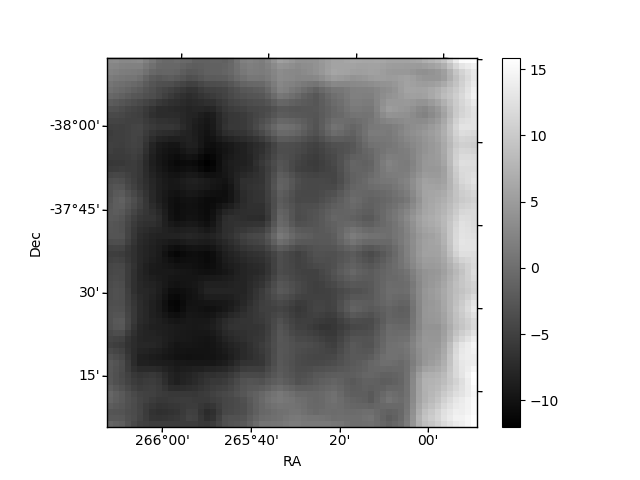
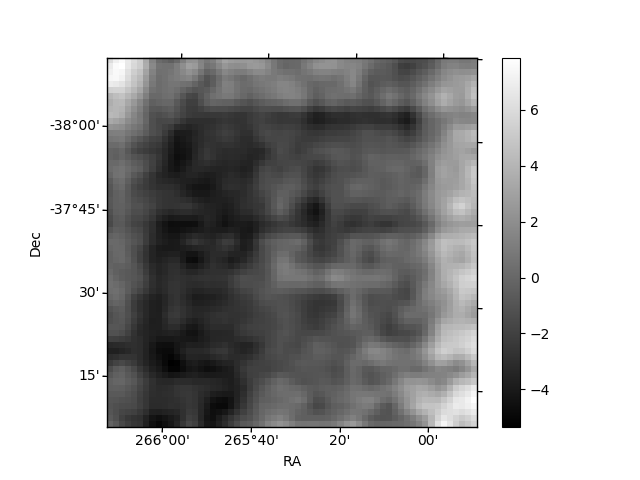
Histogram calculated using DETX and DETY for each event in the final _common_clean file
| Quadrant A | 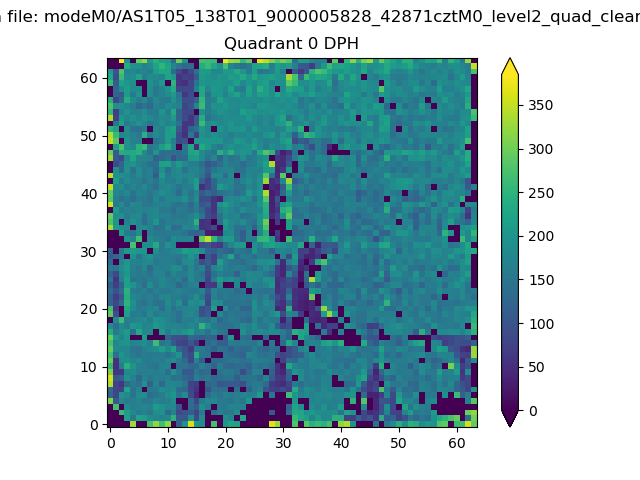 |
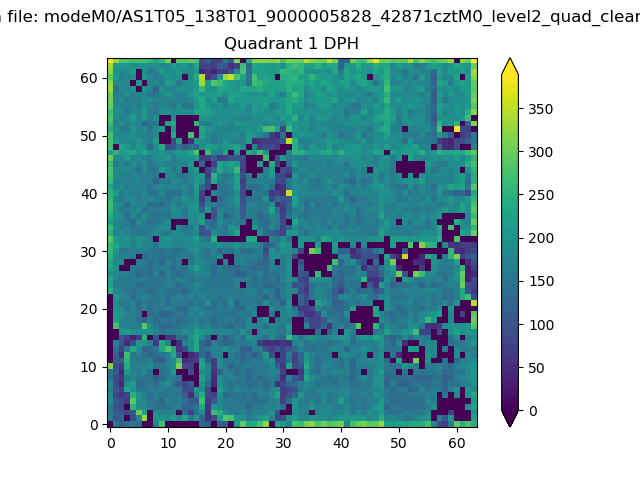 |
Quadrant B |
|---|---|---|---|
| Quadrant D | 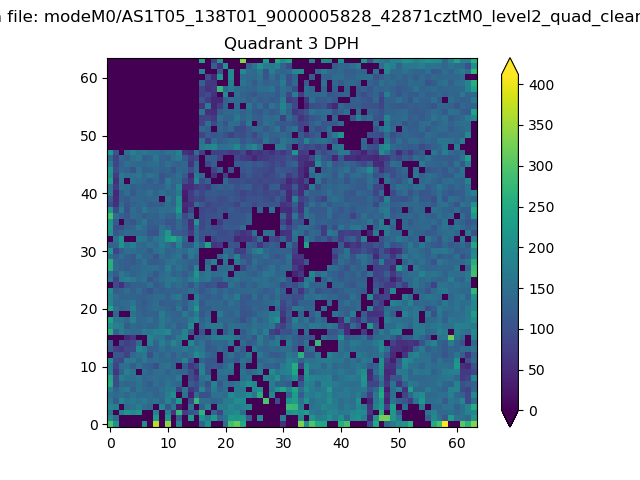 |
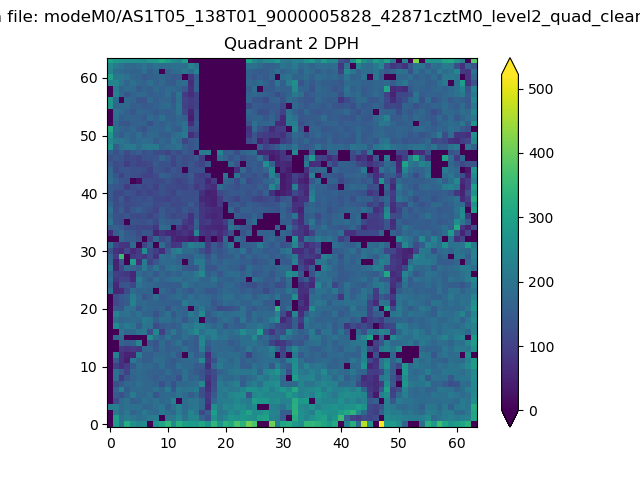 |
Quadrant C |
| Plot type | Count rate plots | Images |
|---|---|---|
| Comparison with Poisson distribution Blue bars denote a histogram of data divided into 1 sec bins. Red curve is a Poisson curve with rate = median count rate of data. |
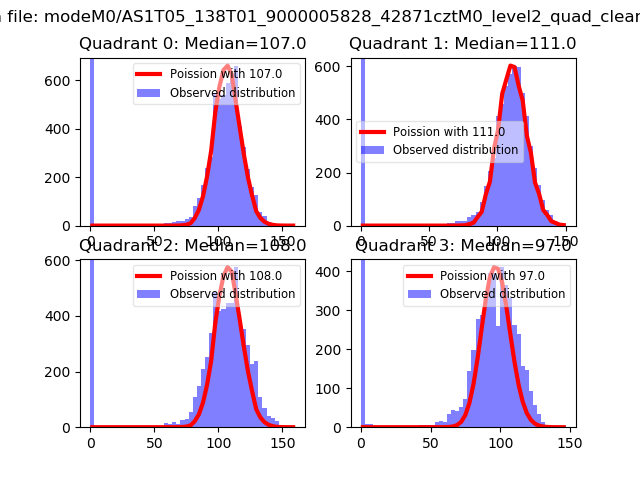 |
 |
| Quadrant-wise count rates Data is divided into 100 sec bins |
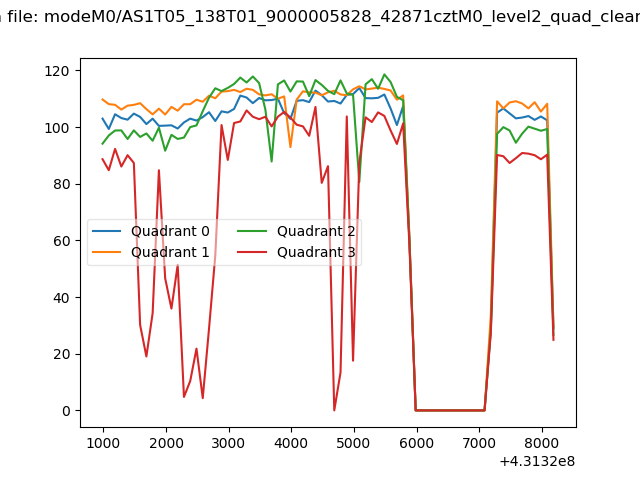 |
|
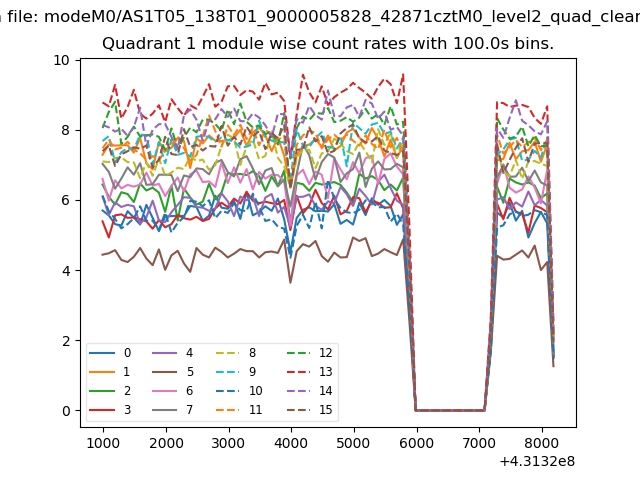
| Module-wise count rates for Quadrant A Data is divided into 100 sec bins |
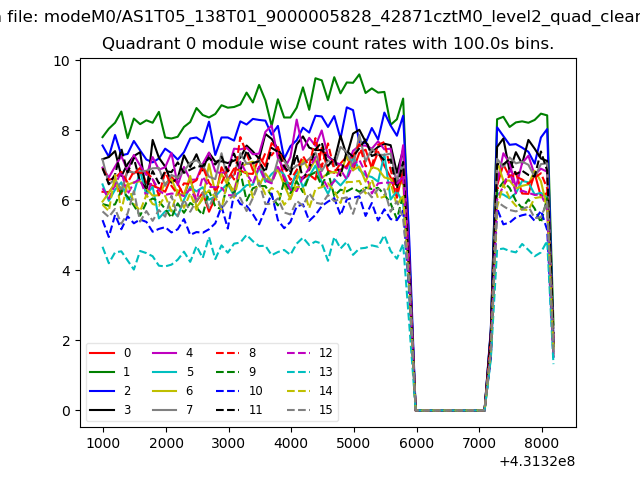 |
 |
| Module-wise count rates for Quadrant B Data is divided into 100 sec bins |
 |
 |
| Module-wise count rates for Quadrant C Data is divided into 100 sec bins |
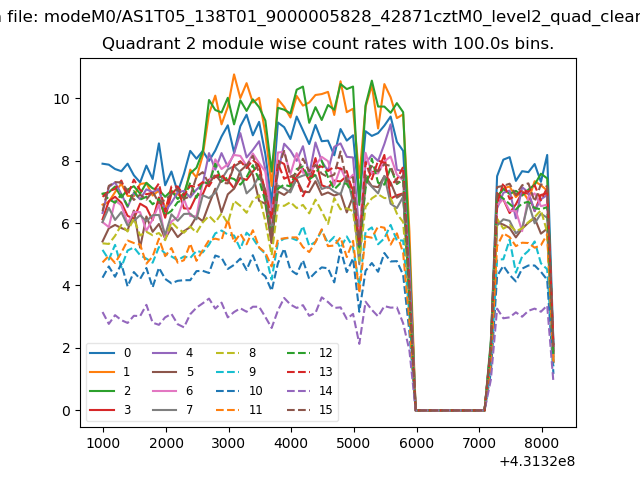 |
 |
| Module-wise count rates for Quadrant D Data is divided into 100 sec bins |
 |
 |
| Parameter | Plot |
|---|---|
| CZT HV Monitor | 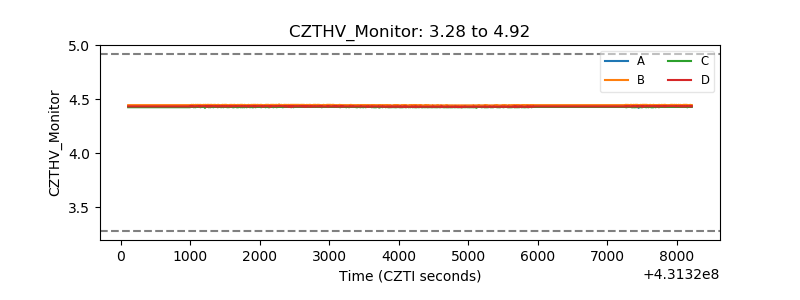 |
| D_VDD | 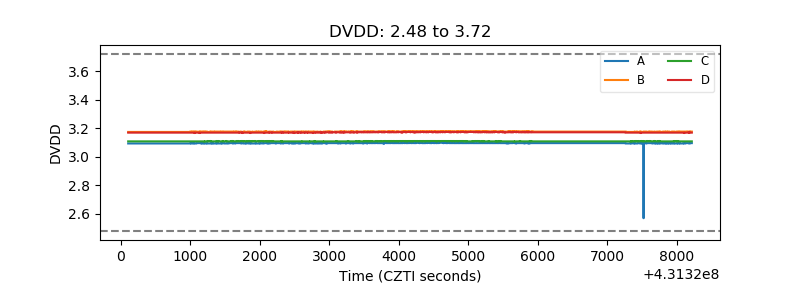 |
| Temperature 1 | 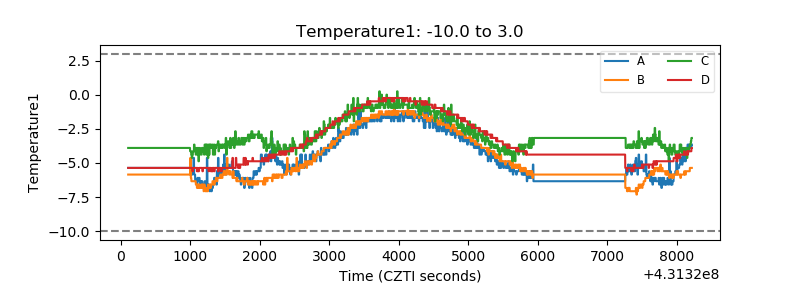 |
| Veto HV Monitor |  |
| Veto LLD | 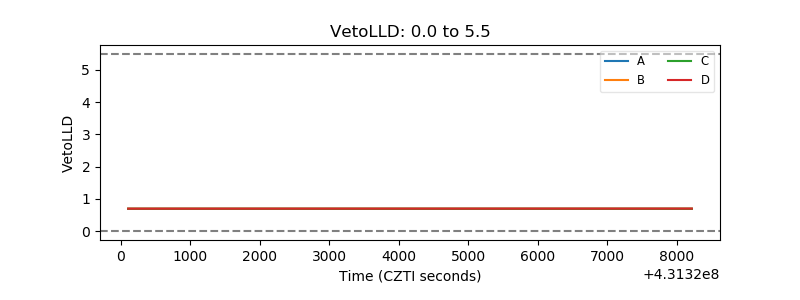 |
| Alpha Counter | 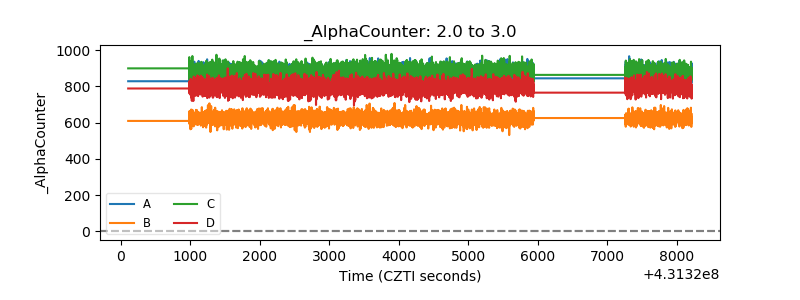 |
| _CPM_Rate | 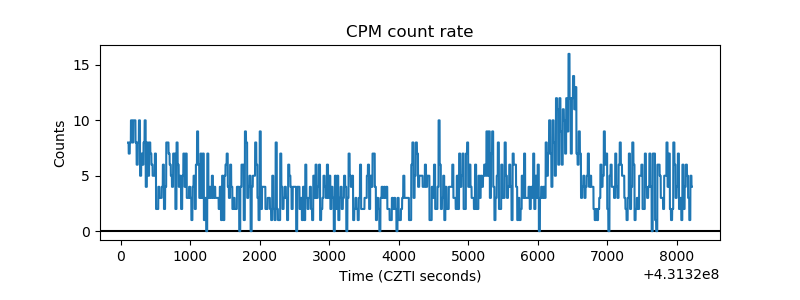 |
| CZT Counter | 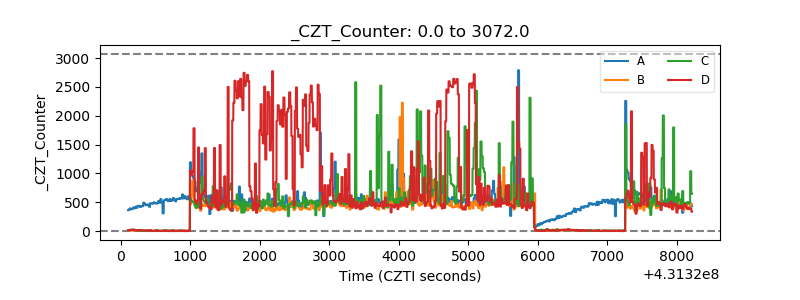 |
| +2.5 Volts monitor | 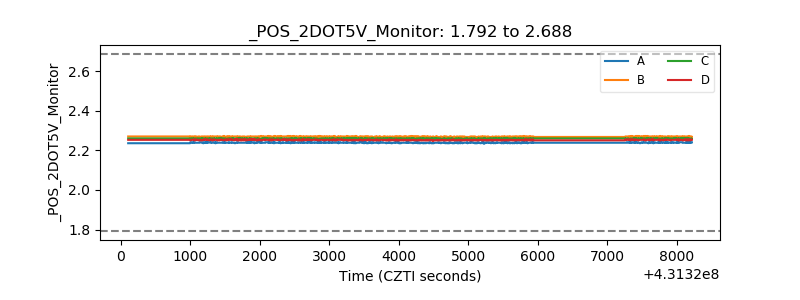 |
| +5 Volts monitor |  |
| _ROLL_ROT | 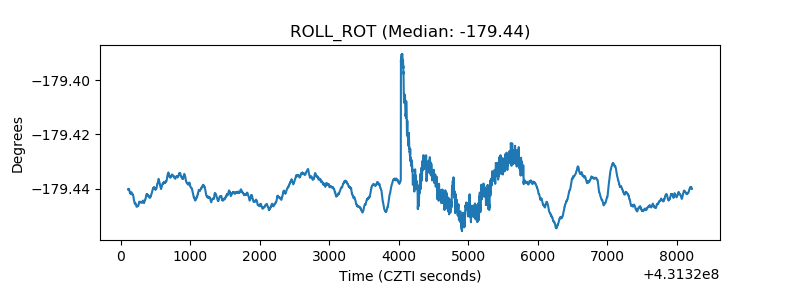 |
| _Roll_DEC | 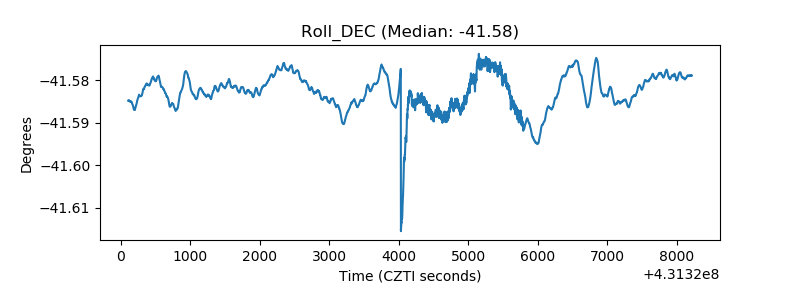 |
| _Roll_RA | 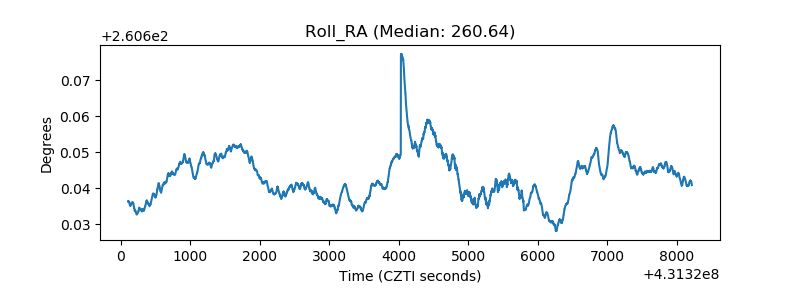 |
| Veto Counter | 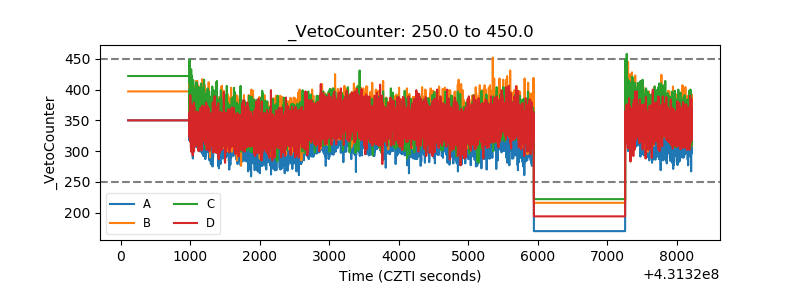 |