| Param | Original file | Final file |
|---|---|---|
| Filename | modeM0/AS1T05_138T01_9000005828_42874cztM0_level2.fits | modeM0/AS1T05_138T01_9000005828_42874cztM0_level2_quad_clean.evt |
| Size (bytes) | 1,077,477,120 | 246,579,840 |
| Size | 1.0 GB | 235.2 MB |
| Events in quadrant A | 9,005,457 | 1,630,386 |
| Events in quadrant B | 7,220,529 | 1,693,460 |
| Events in quadrant C | 10,857,619 | 1,627,210 |
| Events in quadrant D | 11,602,796 | 1,445,759 |
| Mode M0 | |||
|---|---|---|---|
| Quadrant | BADHDUFLAG | Total packets | Discarded packets |
| A | 0 | 35834 | 4 |
| B | 0 | 32203 | 4 |
| C | 0 | 42092 | 4 |
| D | 0 | 44580 | 4 |
| Mode M9 | |||
|---|---|---|---|
| Quadrant | BADHDUFLAG | Total packets | Discarded packets |
| A | 0 | 50 | 0 |
| B | 0 | 51 | 0 |
| C | 0 | 51 | 0 |
| D | 0 | 51 | 0 |
| Mode SS | |||
|---|---|---|---|
| Quadrant | BADHDUFLAG | Total packets | Discarded packets |
| A | 0 | 316 | 0 |
| B | 0 | 316 | 0 |
| C | 0 | 316 | 0 |
| D | 0 | 316 | 0 |
| Quadrant | Total seconds | Saturated seconds | Saturation percentage |
|---|---|---|---|
| A | 15485 | 203 | 1.310946% |
| B | 15485 | 62 | 0.400387% |
| C | 15485 | 718 | 4.636745% |
| D | 15485 | 1099 | 7.097191% |
Noise dominated data is calculated using 1-second bins in cleaned event files. If a bin has >2000 counts, and if more than 50% of those come from <1% of pixels, then it is considered to be noise-dominated and hence unusable.
| Quadrant | # 1 sec bins | Bins with >0 counts | Bins with >2000 counts | High rate bins dominated by noise | Noise dominated (total time) | Noise dominated (detector-on time) | Marked lightcurve |
|---|---|---|---|---|---|---|---|
| A | 19754 | 15487 | 153 | 153 | 0.77% | 0.99% | 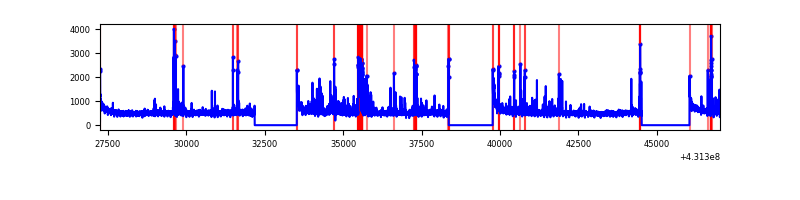 |
| B | 19754 | 15488 | 40 | 40 | 0.20% | 0.26% | 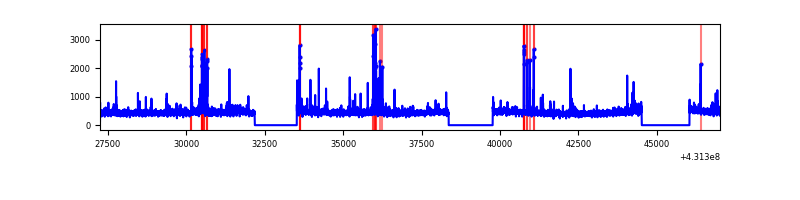 |
| C | 19754 | 15488 | 696 | 696 | 3.52% | 4.49% | 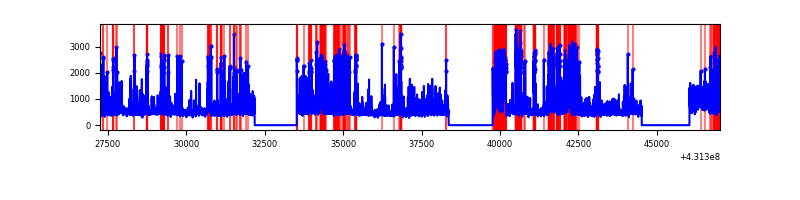 |
| D | 19754 | 15488 | 1054 | 1054 | 5.34% | 6.81% | 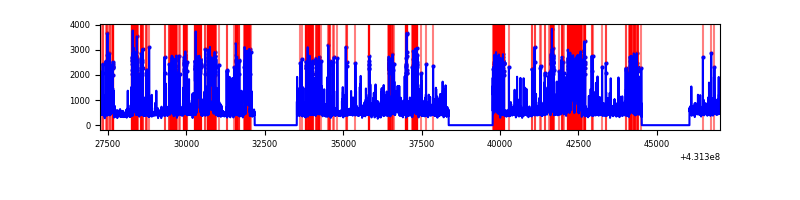 |
Top three noisy pixels from each quadrant. If the there are fewer than three noisy pixels in the level2.evt file, extra rows are filled as -1
| Pixel properties | Quadrant properties | ||||||
|---|---|---|---|---|---|---|---|
| Quadrant | DetID | PixID | Counts | Sigma | Mean | Median | Sigma |
| A | 10 | 83 | 1558991 | 4476.28 | 1696 | 1662 | 347.9 |
| A | 10 | 255 | 372132 | 1064.85 | 1696 | 1662 | 347.9 |
| A | 15 | 237 | 266847 | 762.23 | 1696 | 1662 | 347.9 |
| B | 5 | 255 | 137439 | 415.72 | 1689 | 1638 | 326.7 |
| B | 15 | 85 | 134026 | 405.28 | 1689 | 1638 | 326.7 |
| B | 0 | 190 | 122029 | 368.55 | 1689 | 1638 | 326.7 |
| C | 0 | 207 | 1461871 | 3765.37 | 1652 | 1663 | 387.8 |
| C | 14 | 254 | 1178866 | 3035.59 | 1652 | 1663 | 387.8 |
| C | 15 | 214 | 611006 | 1571.28 | 1652 | 1663 | 387.8 |
| D | 2 | 249 | 1295125 | 3224.08 | 1631 | 1589 | 401.2 |
| D | 10 | 118 | 1050013 | 2613.15 | 1631 | 1589 | 401.2 |
| D | 12 | 6 | 854315 | 2125.38 | 1631 | 1589 | 401.2 |
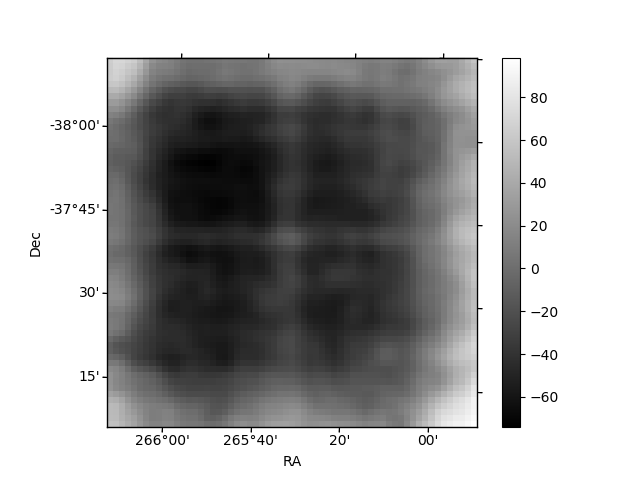
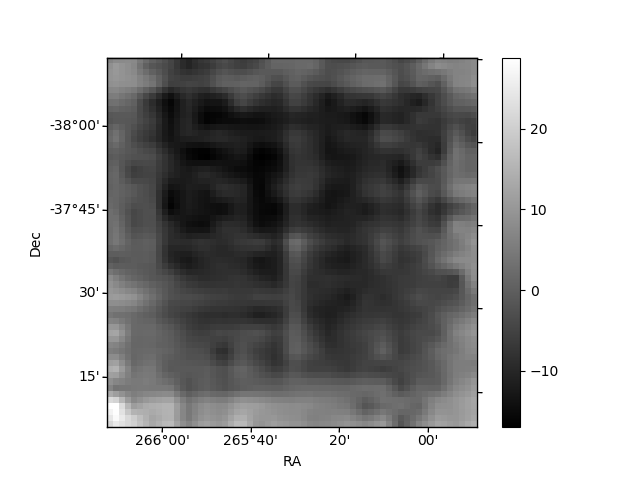
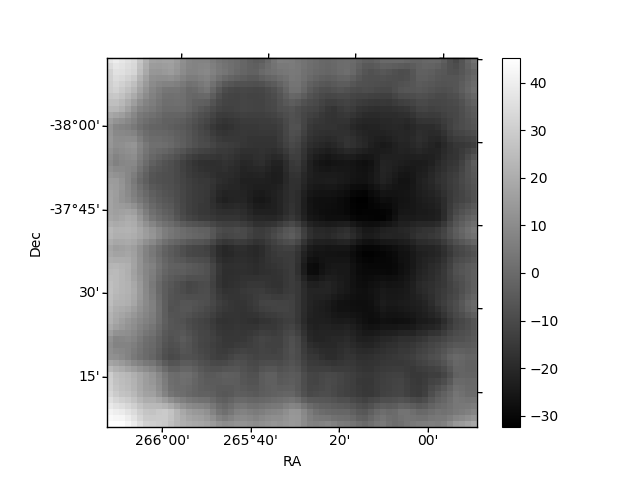
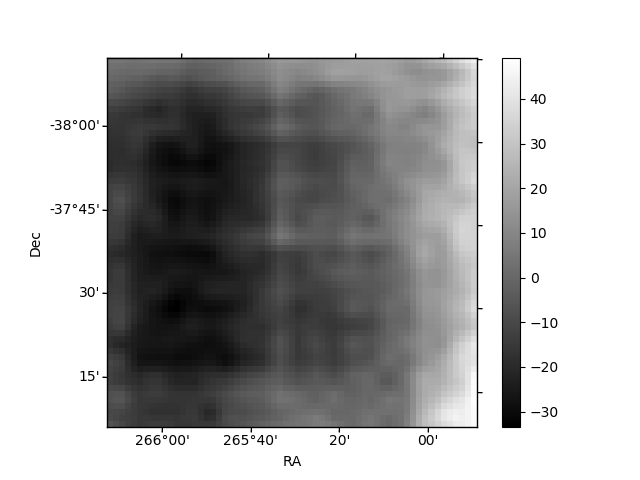
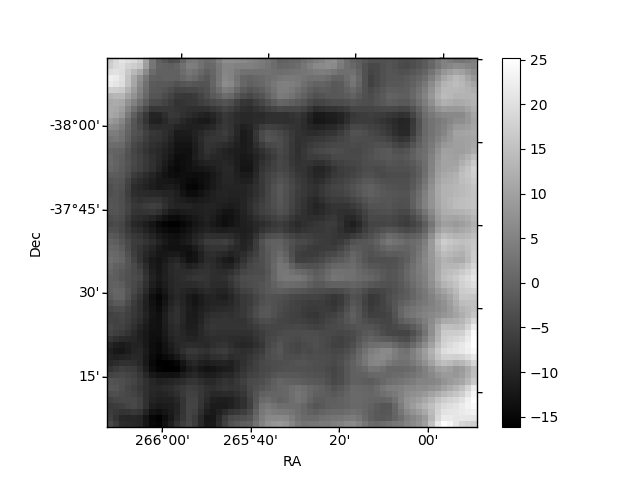
Histogram calculated using DETX and DETY for each event in the final _common_clean file
| Quadrant A | 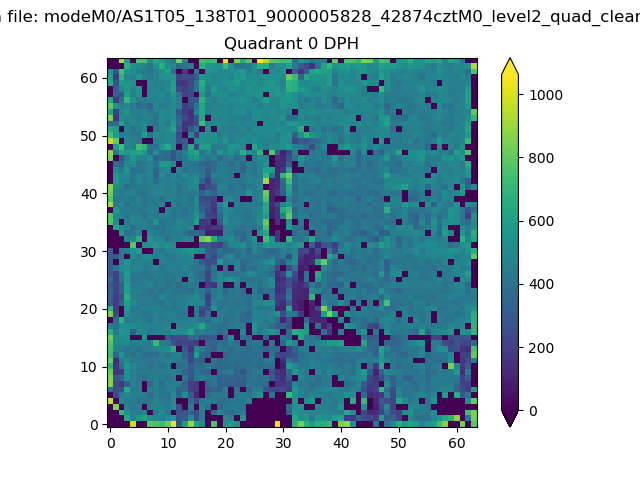 |
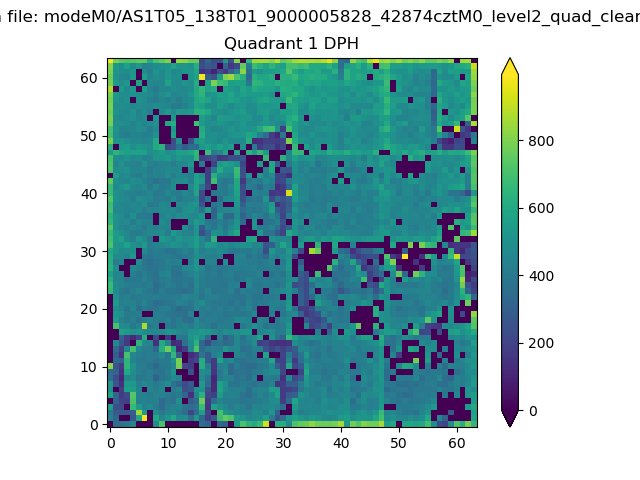 |
Quadrant B |
|---|---|---|---|
| Quadrant D | 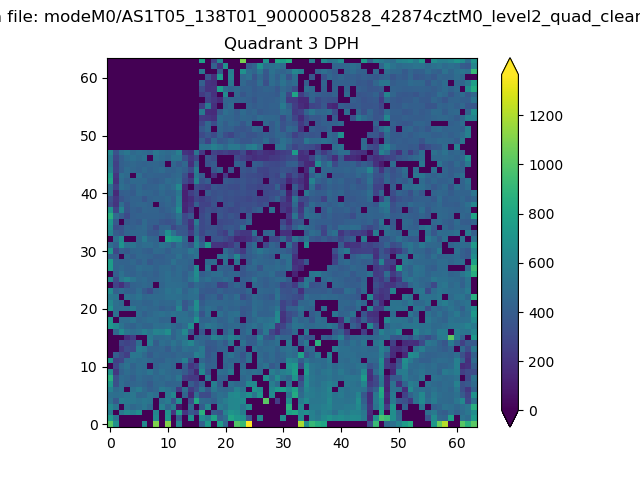 |
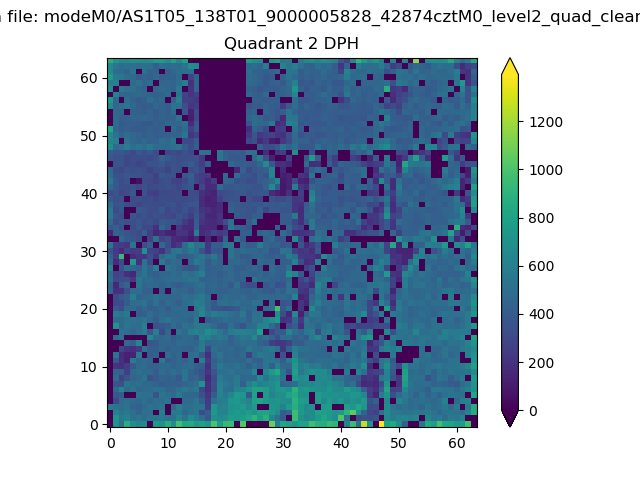 |
Quadrant C |
| Plot type | Count rate plots | Images |
|---|---|---|
| Comparison with Poisson distribution Blue bars denote a histogram of data divided into 1 sec bins. Red curve is a Poisson curve with rate = median count rate of data. |
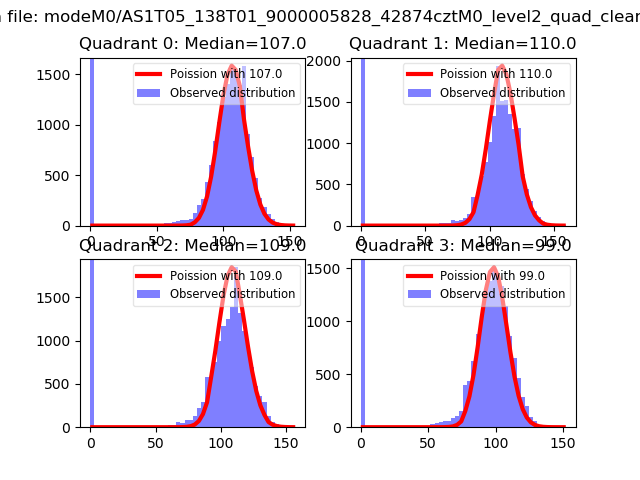 |
 |
| Quadrant-wise count rates Data is divided into 100 sec bins |
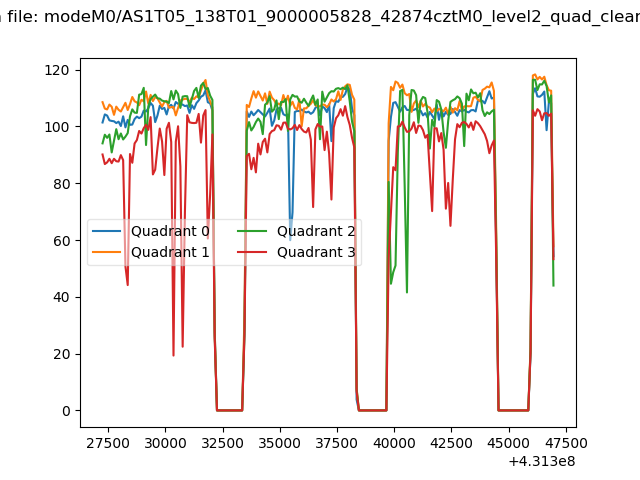 |
|
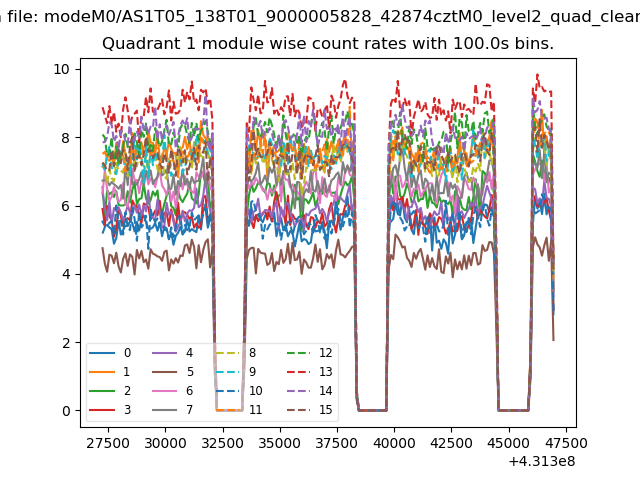
| Module-wise count rates for Quadrant A Data is divided into 100 sec bins |
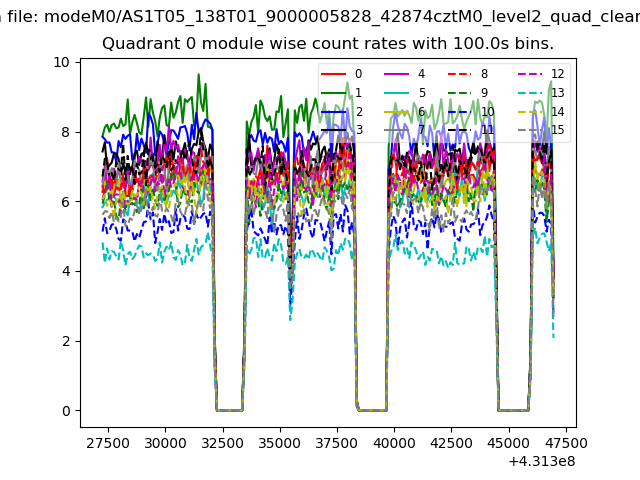 |
 |
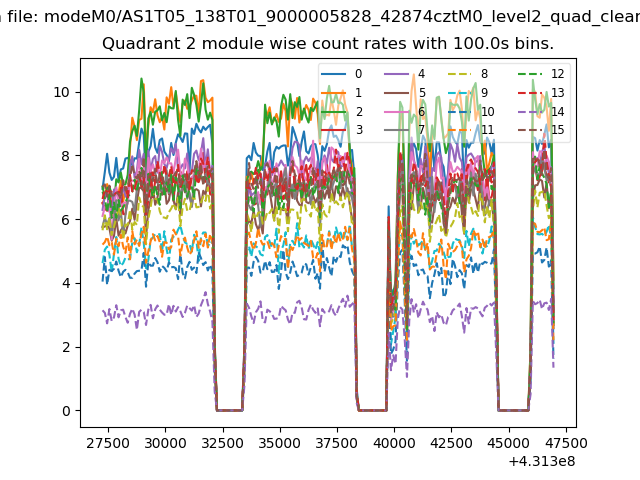
| Module-wise count rates for Quadrant B Data is divided into 100 sec bins |
 |
 |
| Module-wise count rates for Quadrant C Data is divided into 100 sec bins |
 |
 |
| Module-wise count rates for Quadrant D Data is divided into 100 sec bins |
 |
 |
| Parameter | Plot |
|---|---|
| CZT HV Monitor | 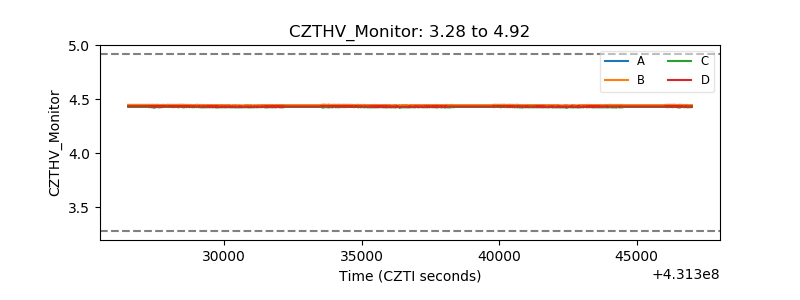 |
| D_VDD | 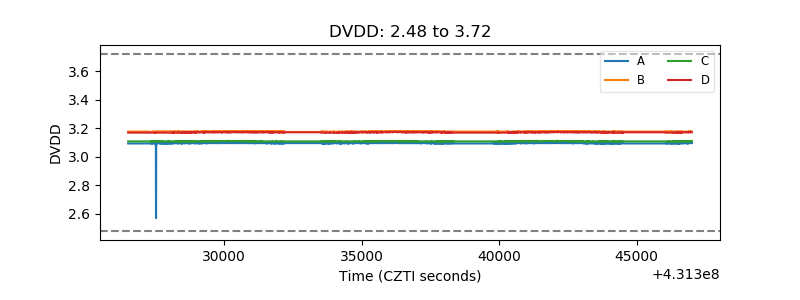 |
| Temperature 1 | 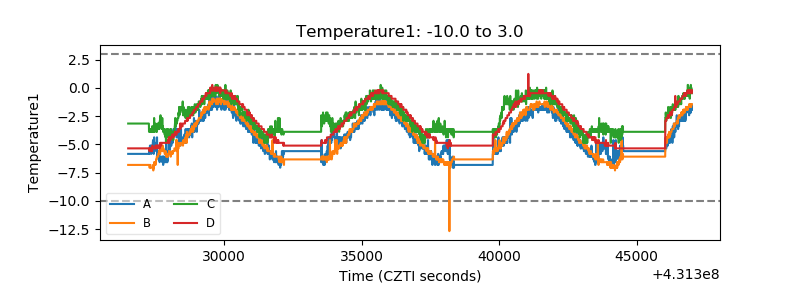 |
| Veto HV Monitor | 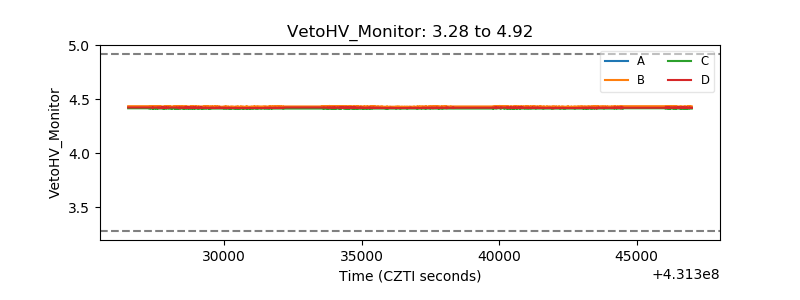 |
| Veto LLD | 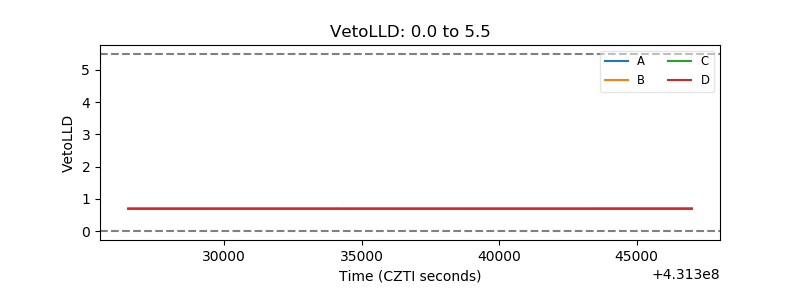 |
| Alpha Counter |  |
| _CPM_Rate | 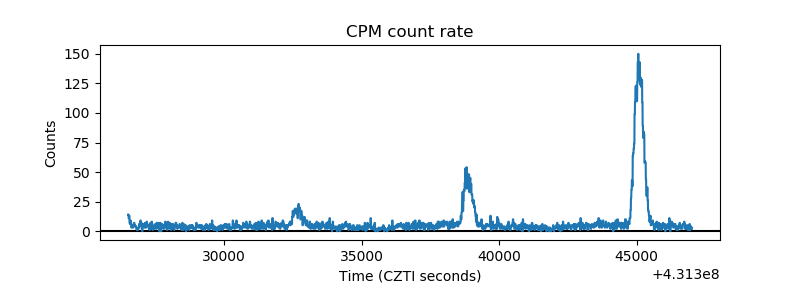 |
| CZT Counter | 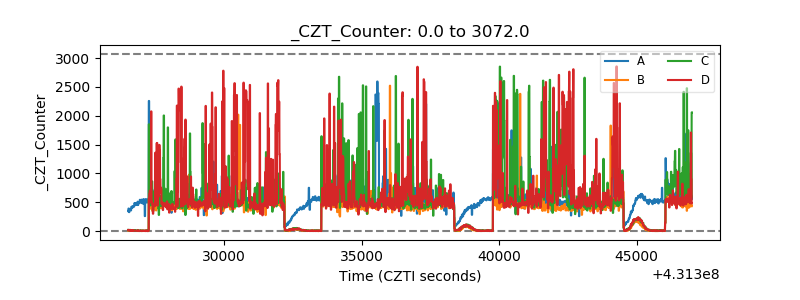 |
| +2.5 Volts monitor | 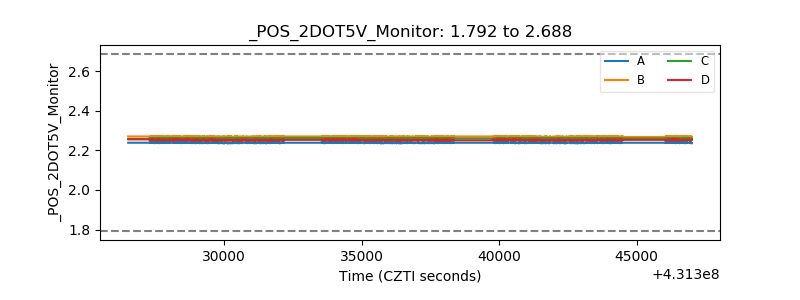 |
| +5 Volts monitor |  |
| _ROLL_ROT | 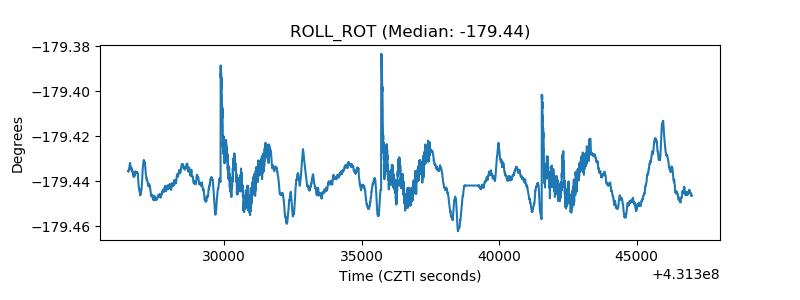 |
| _Roll_DEC | 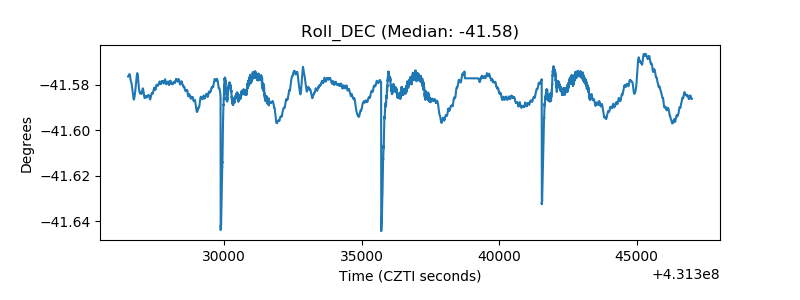 |
| _Roll_RA | 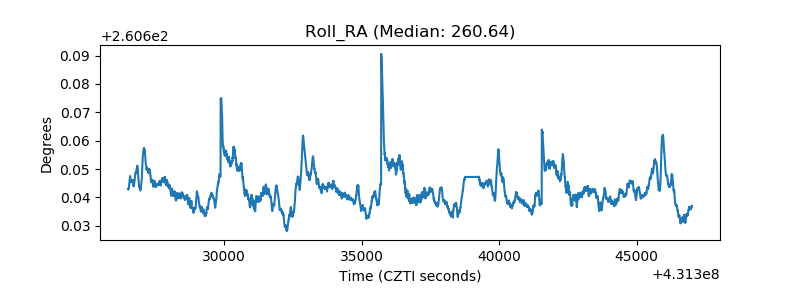 |
| Veto Counter | 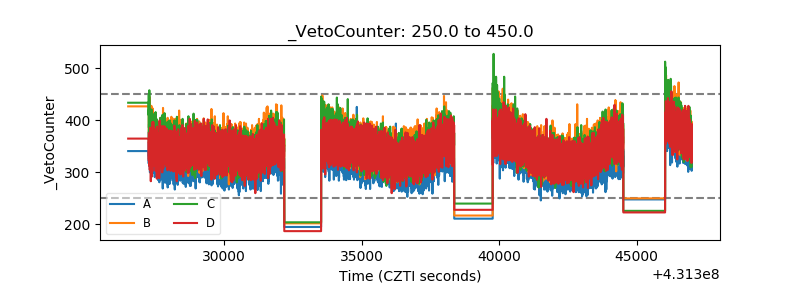 |