| Param | Original file | Final file |
|---|---|---|
| Filename | modeM0/AS1T05_138T01_9000005828_42875cztM0_level2.fits | modeM0/AS1T05_138T01_9000005828_42875cztM0_level2_quad_clean.evt |
| Size (bytes) | 428,788,800 | 90,432,000 |
| Size | 408.9 MB | 86.2 MB |
| Events in quadrant A | 3,248,543 | 602,549 |
| Events in quadrant B | 2,583,193 | 620,934 |
| Events in quadrant C | 3,592,928 | 620,260 |
| Events in quadrant D | 6,020,241 | 508,754 |
| Mode M0 | |||
|---|---|---|---|
| Quadrant | BADHDUFLAG | Total packets | Discarded packets |
| A | 0 | 13091 | 2 |
| B | 0 | 11370 | 2 |
| C | 0 | 14339 | 2 |
| D | 0 | 21633 | 2 |
| Mode M9 | |||
|---|---|---|---|
| Quadrant | BADHDUFLAG | Total packets | Discarded packets |
| A | 0 | 16 | 0 |
| B | 0 | 16 | 0 |
| C | 0 | 16 | 0 |
| D | 0 | 16 | 0 |
| Mode SS | |||
|---|---|---|---|
| Quadrant | BADHDUFLAG | Total packets | Discarded packets |
| A | 0 | 114 | 0 |
| B | 0 | 114 | 0 |
| C | 0 | 114 | 0 |
| D | 0 | 114 | 0 |
| Quadrant | Total seconds | Saturated seconds | Saturation percentage |
|---|---|---|---|
| A | 5502 | 76 | 1.381316% |
| B | 5503 | 15 | 0.272579% |
| C | 5503 | 108 | 1.962566% |
| D | 5503 | 810 | 14.719244% |
Noise dominated data is calculated using 1-second bins in cleaned event files. If a bin has >2000 counts, and if more than 50% of those come from <1% of pixels, then it is considered to be noise-dominated and hence unusable.
| Quadrant | # 1 sec bins | Bins with >0 counts | Bins with >2000 counts | High rate bins dominated by noise | Noise dominated (total time) | Noise dominated (detector-on time) | Marked lightcurve |
|---|---|---|---|---|---|---|---|
| A | 7145 | 5503 | 54 | 54 | 0.76% | 0.98% | 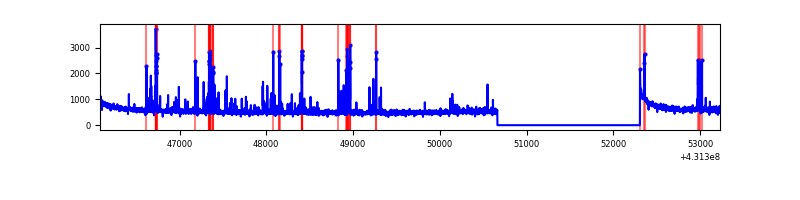 |
| B | 7146 | 5504 | 6 | 6 | 0.08% | 0.11% | 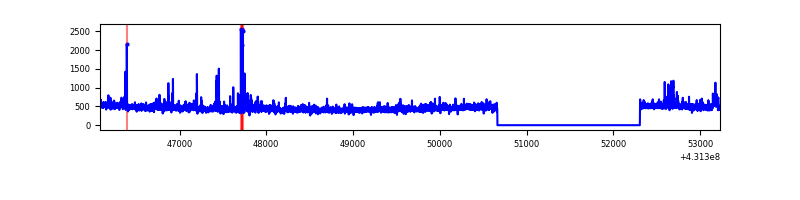 |
| C | 7146 | 5504 | 115 | 115 | 1.61% | 2.09% | 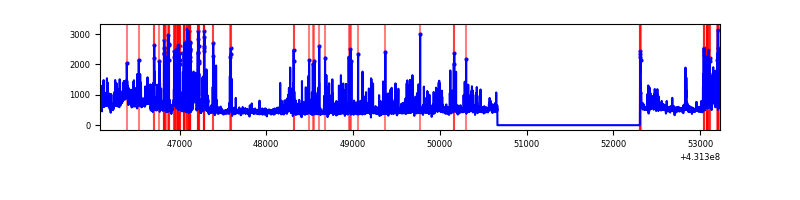 |
| D | 7145 | 5503 | 780 | 780 | 10.92% | 14.17% | 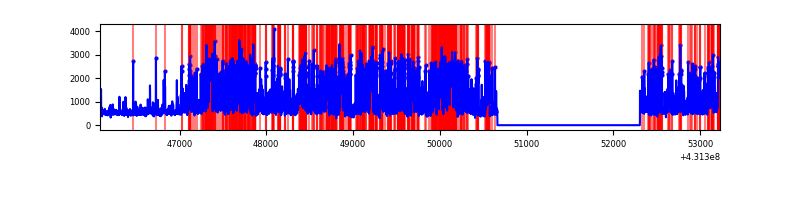 |
Top three noisy pixels from each quadrant. If the there are fewer than three noisy pixels in the level2.evt file, extra rows are filled as -1
| Pixel properties | Quadrant properties | ||||||
|---|---|---|---|---|---|---|---|
| Quadrant | DetID | PixID | Counts | Sigma | Mean | Median | Sigma |
| A | 10 | 83 | 578086 | 4516.57 | 610 | 597 | 127.9 |
| A | 15 | 237 | 156214 | 1217.09 | 610 | 597 | 127.9 |
| A | 2 | 79 | 93347 | 725.4 | 610 | 597 | 127.9 |
| B | 0 | 190 | 97195 | 811.34 | 605 | 589 | 119.1 |
| B | 4 | 171 | 43406 | 359.6 | 605 | 589 | 119.1 |
| B | 15 | 85 | 30044 | 247.38 | 605 | 589 | 119.1 |
| C | 5 | 250 | 405204 | 2864.44 | 599 | 604 | 141.2 |
| C | 2 | 16 | 292608 | 2067.29 | 599 | 604 | 141.2 |
| C | 15 | 214 | 220205 | 1554.7 | 599 | 604 | 141.2 |
| D | 1 | 52 | 2511653 | 17730.72 | 567 | 551 | 141.6 |
| D | 2 | 249 | 328493 | 2315.58 | 567 | 551 | 141.6 |
| D | 12 | 6 | 269128 | 1896.4 | 567 | 551 | 141.6 |
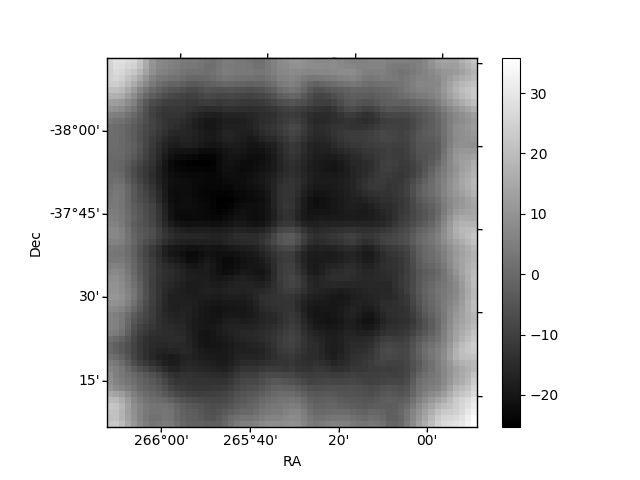
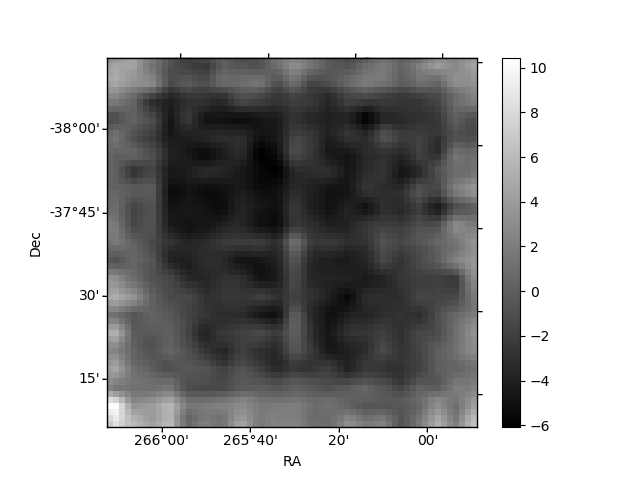
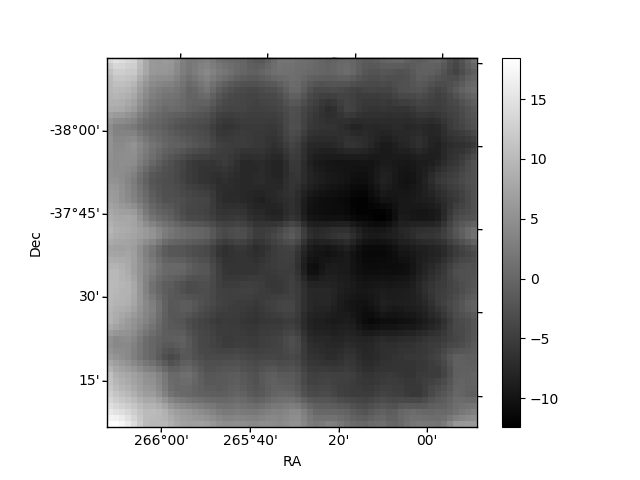
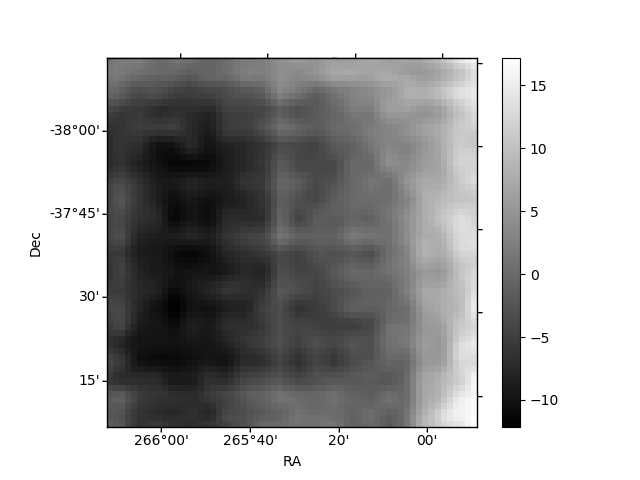
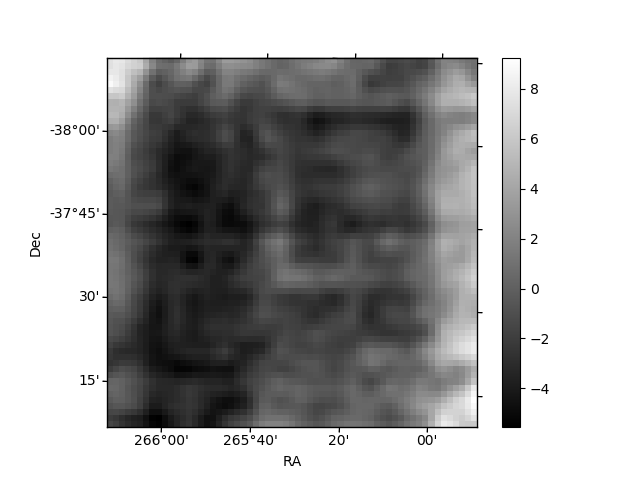
Histogram calculated using DETX and DETY for each event in the final _common_clean file
| Quadrant A | 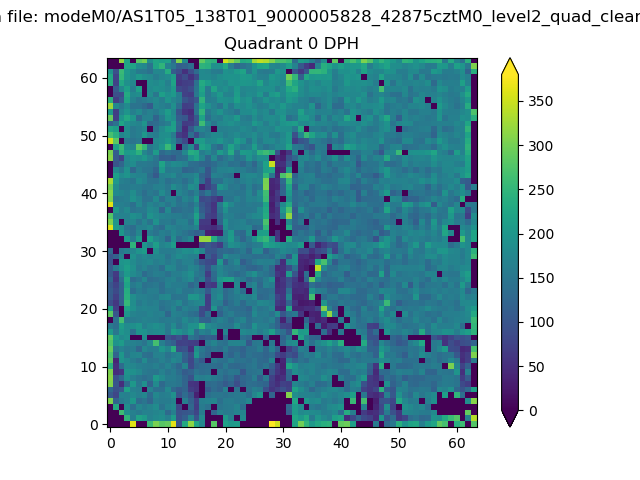 |
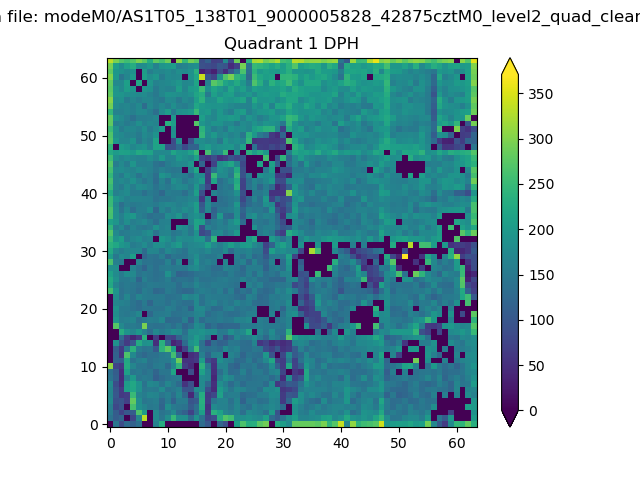 |
Quadrant B |
|---|---|---|---|
| Quadrant D | 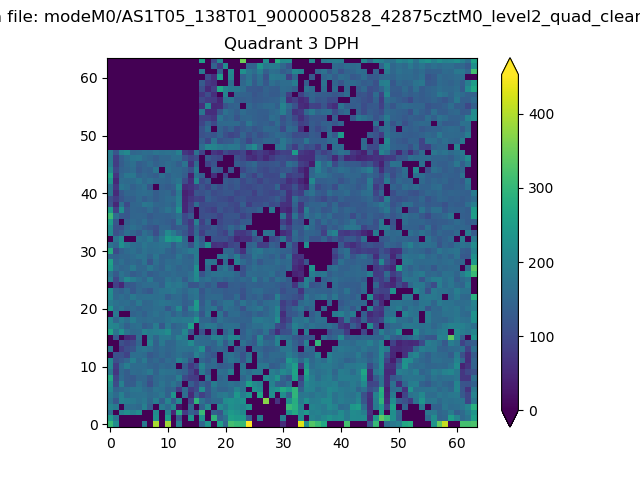 |
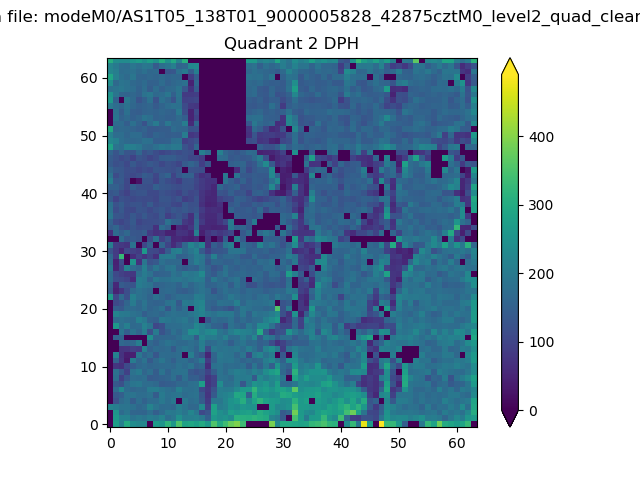 |
Quadrant C |
| Plot type | Count rate plots | Images |
|---|---|---|
| Comparison with Poisson distribution Blue bars denote a histogram of data divided into 1 sec bins. Red curve is a Poisson curve with rate = median count rate of data. |
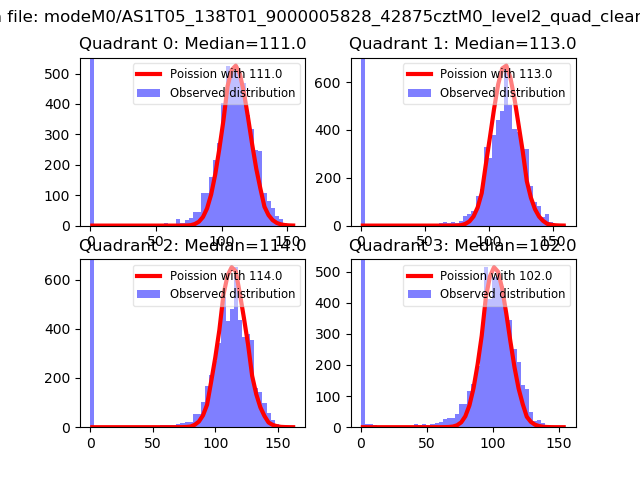 |
 |
| Quadrant-wise count rates Data is divided into 100 sec bins |
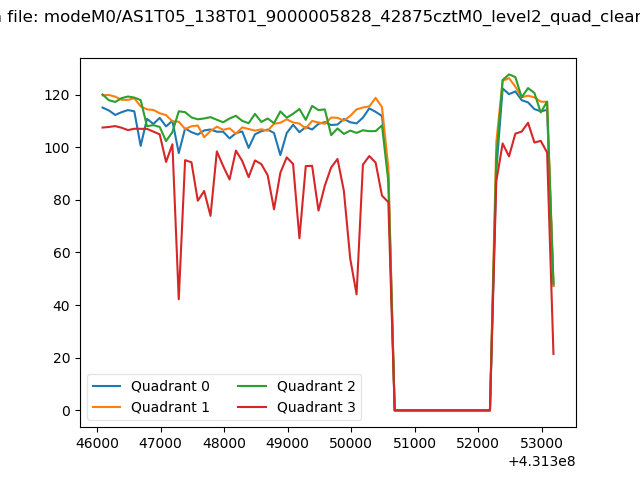 |
|
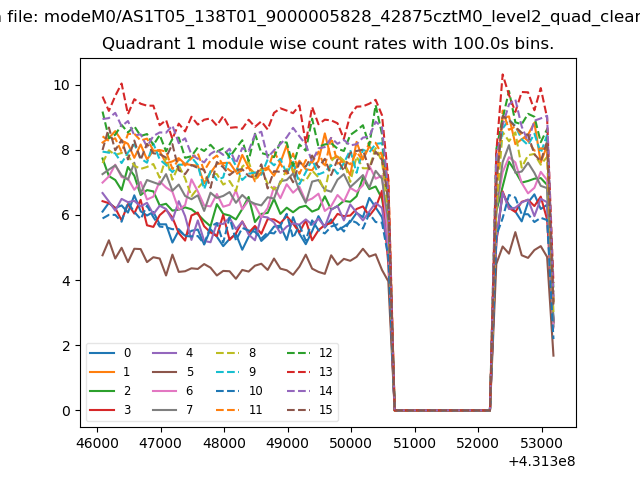
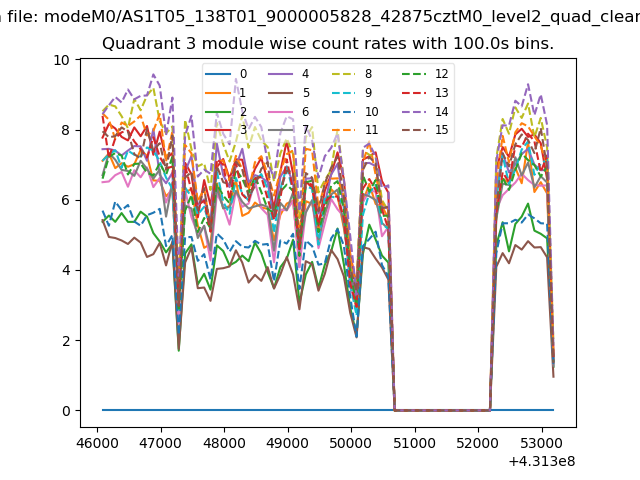
| Module-wise count rates for Quadrant A Data is divided into 100 sec bins |
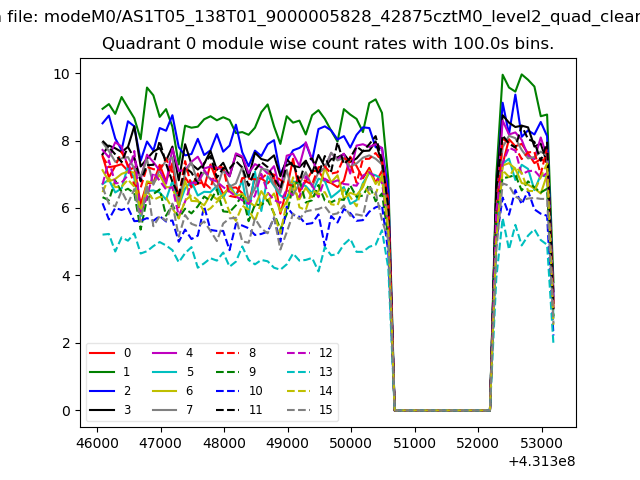 |
 |
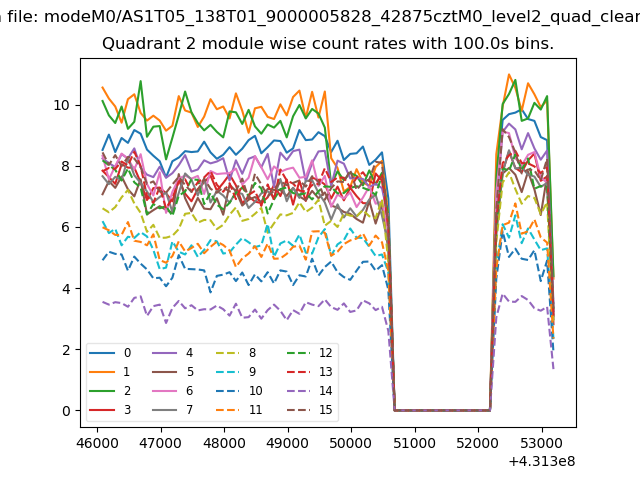
| Module-wise count rates for Quadrant B Data is divided into 100 sec bins |
 |
 |
| Module-wise count rates for Quadrant C Data is divided into 100 sec bins |
 |
 |
| Module-wise count rates for Quadrant D Data is divided into 100 sec bins |
 |
 |
| Parameter | Plot |
|---|---|
| CZT HV Monitor |  |
| D_VDD | 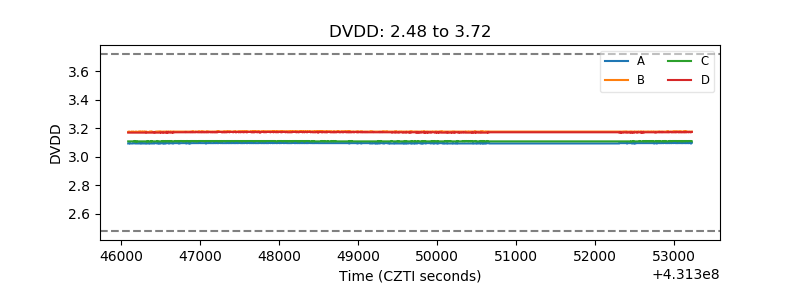 |
| Temperature 1 | 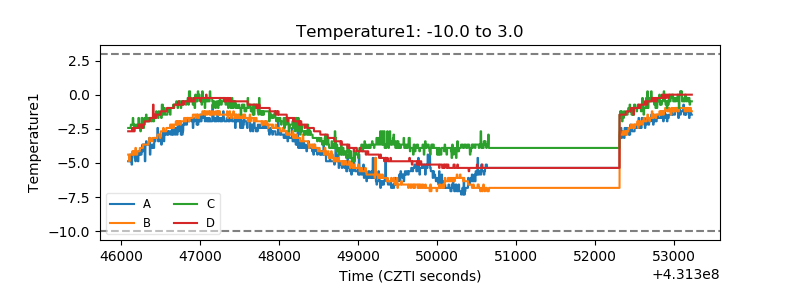 |
| Veto HV Monitor | 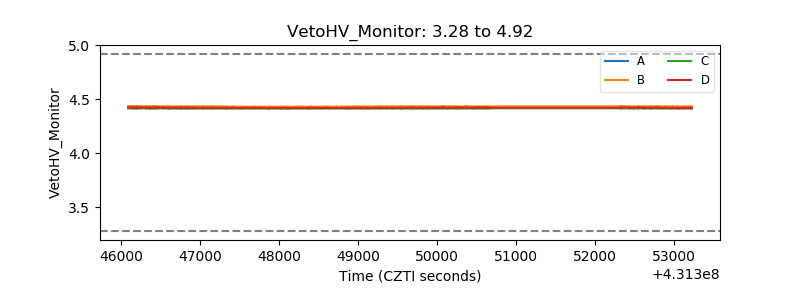 |
| Veto LLD |  |
| Alpha Counter | 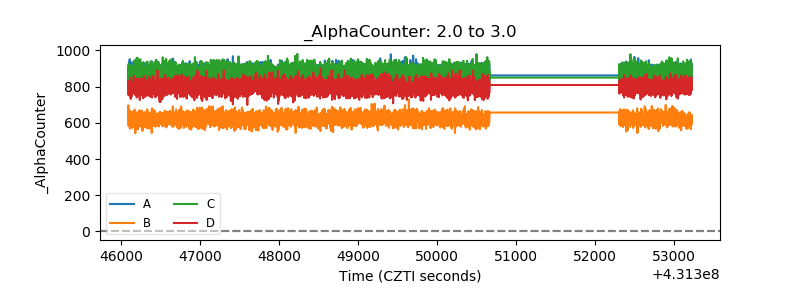 |
| _CPM_Rate | 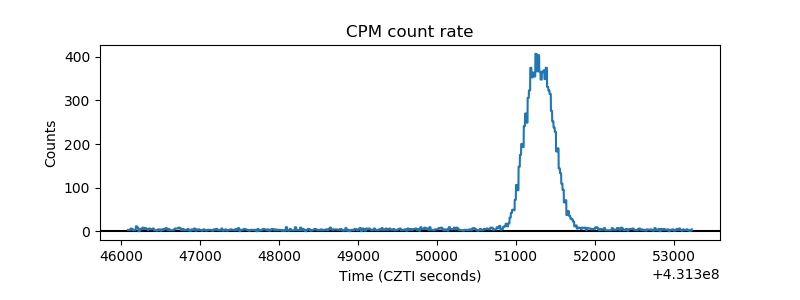 |
| CZT Counter | 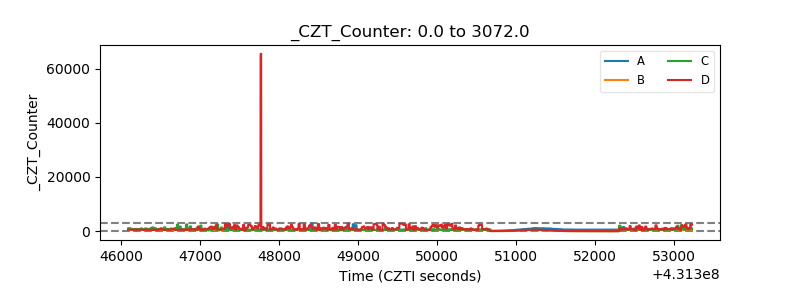 |
| +2.5 Volts monitor | 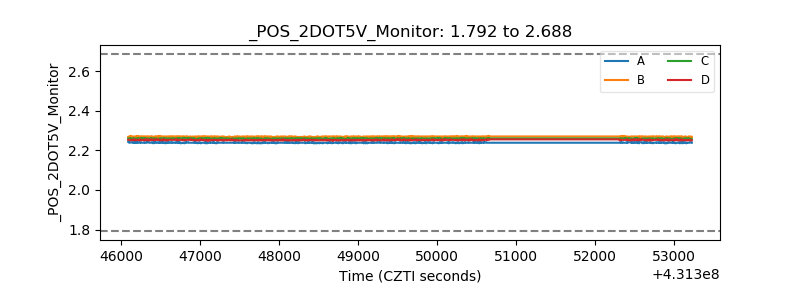 |
| +5 Volts monitor | 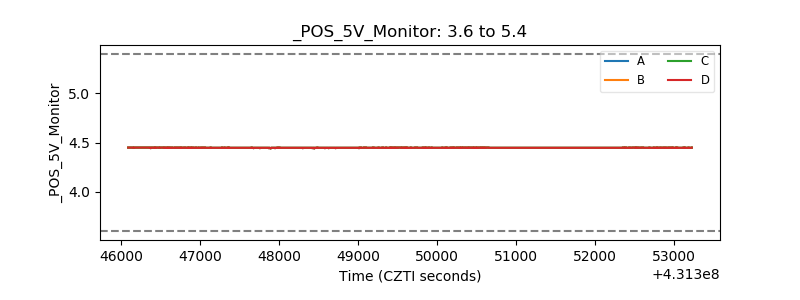 |
| _ROLL_ROT | 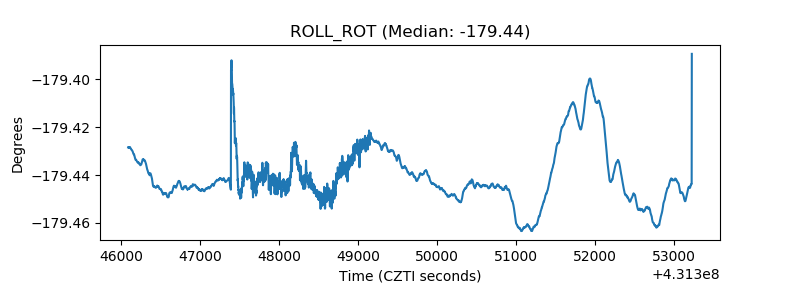 |
| _Roll_DEC |  |
| _Roll_RA | 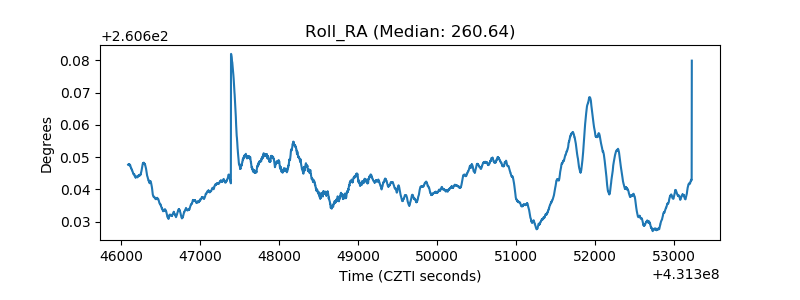 |
| Veto Counter | 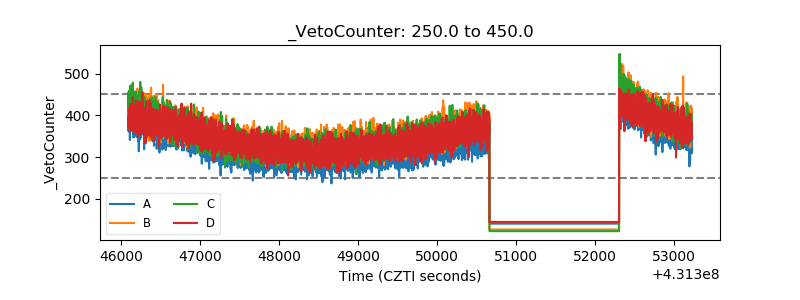 |