| Param | Original file | Final file |
|---|---|---|
| Filename | modeM0/AS1T05_138T01_9000005828_42878cztM0_level2.fits | modeM0/AS1T05_138T01_9000005828_42878cztM0_level2_quad_clean.evt |
| Size (bytes) | 115,254,720 | 26,259,840 |
| Size | 109.9 MB | 25.0 MB |
| Events in quadrant A | 882,306 | 175,952 |
| Events in quadrant B | 738,075 | 180,261 |
| Events in quadrant C | 787,051 | 181,455 |
| Events in quadrant D | 1,737,920 | 144,686 |
| Mode M0 | |||
|---|---|---|---|
| Quadrant | BADHDUFLAG | Total packets | Discarded packets |
| A | 0 | 3576 | 0 |
| B | 0 | 3234 | 0 |
| C | 0 | 3285 | 0 |
| D | 0 | 6217 | 0 |
| Mode SS | |||
|---|---|---|---|
| Quadrant | BADHDUFLAG | Total packets | Discarded packets |
| A | 0 | 32 | 0 |
| B | 0 | 32 | 0 |
| C | 0 | 32 | 0 |
| D | 0 | 32 | 0 |
| Quadrant | Total seconds | Saturated seconds | Saturation percentage |
|---|---|---|---|
| A | 1520 | 24 | 1.578947% |
| B | 1520 | 4 | 0.263158% |
| C | 1521 | 14 | 0.920447% |
| D | 1521 | 254 | 16.699540% |
Noise dominated data is calculated using 1-second bins in cleaned event files. If a bin has >2000 counts, and if more than 50% of those come from <1% of pixels, then it is considered to be noise-dominated and hence unusable.
| Quadrant | # 1 sec bins | Bins with >0 counts | Bins with >2000 counts | High rate bins dominated by noise | Noise dominated (total time) | Noise dominated (detector-on time) | Marked lightcurve |
|---|---|---|---|---|---|---|---|
| A | 1520 | 1520 | 15 | 15 | 0.99% | 0.99% | 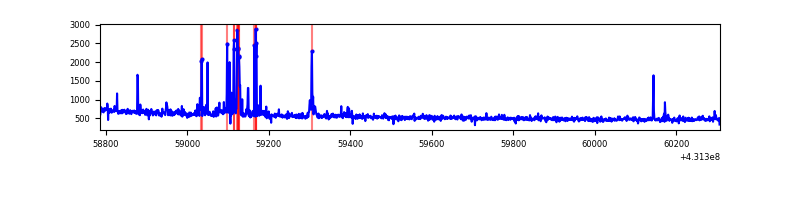 |
| B | 1520 | 1520 | 2 | 2 | 0.13% | 0.13% | 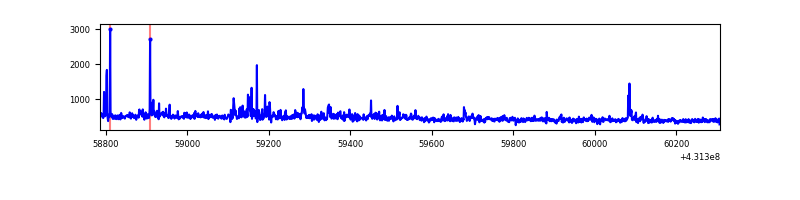 |
| C | 1521 | 1521 | 13 | 13 | 0.85% | 0.85% | 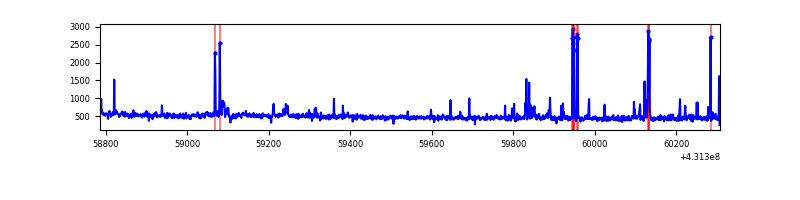 |
| D | 1521 | 1521 | 252 | 252 | 16.57% | 16.57% | 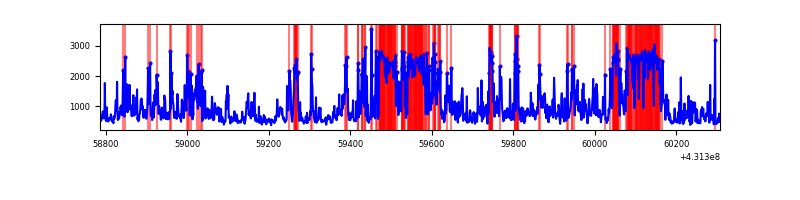 |
Top three noisy pixels from each quadrant. If the there are fewer than three noisy pixels in the level2.evt file, extra rows are filled as -1
| Pixel properties | Quadrant properties | ||||||
|---|---|---|---|---|---|---|---|
| Quadrant | DetID | PixID | Counts | Sigma | Mean | Median | Sigma |
| A | 10 | 83 | 156733 | 4283.18 | 168 | 165 | 36.6 |
| A | 15 | 237 | 52310 | 1426.51 | 168 | 165 | 36.6 |
| A | 13 | 248 | 15689 | 424.69 | 168 | 165 | 36.6 |
| B | 0 | 190 | 26070 | 768.14 | 165 | 161 | 33.7 |
| B | 4 | 171 | 16474 | 483.64 | 165 | 161 | 33.7 |
| B | 15 | 85 | 15783 | 463.15 | 165 | 161 | 33.7 |
| C | 15 | 214 | 61234 | 1541.44 | 162 | 163 | 39.6 |
| C | 2 | 16 | 27477 | 689.41 | 162 | 163 | 39.6 |
| C | 14 | 254 | 21845 | 547.26 | 162 | 163 | 39.6 |
| D | 10 | 118 | 481240 | 12274.43 | 152 | 148 | 39.2 |
| D | 1 | 52 | 391999 | 9997.57 | 152 | 148 | 39.2 |
| D | 13 | 249 | 74283 | 1891.46 | 152 | 148 | 39.2 |
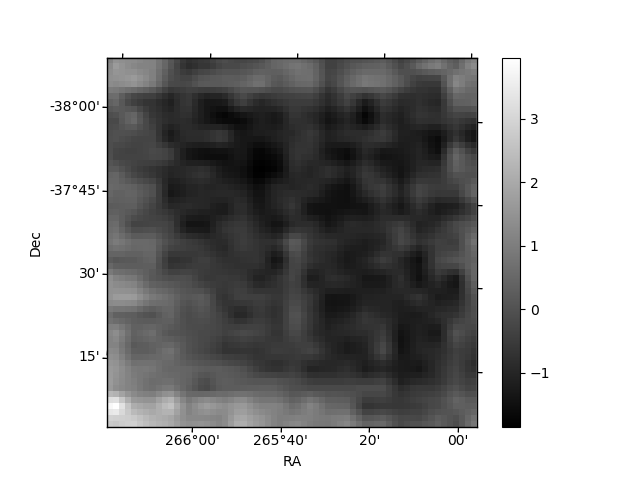
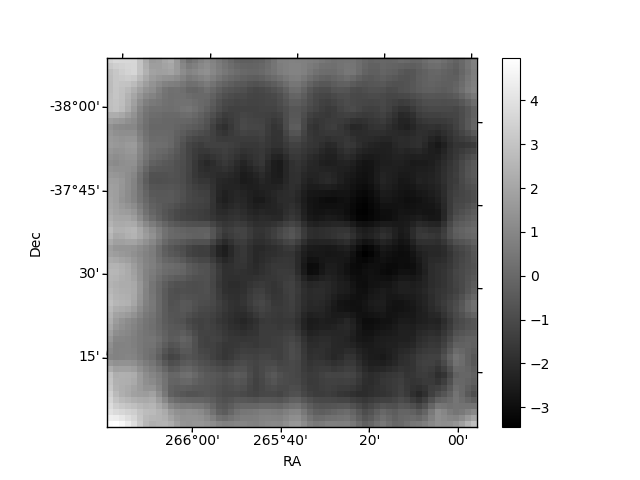
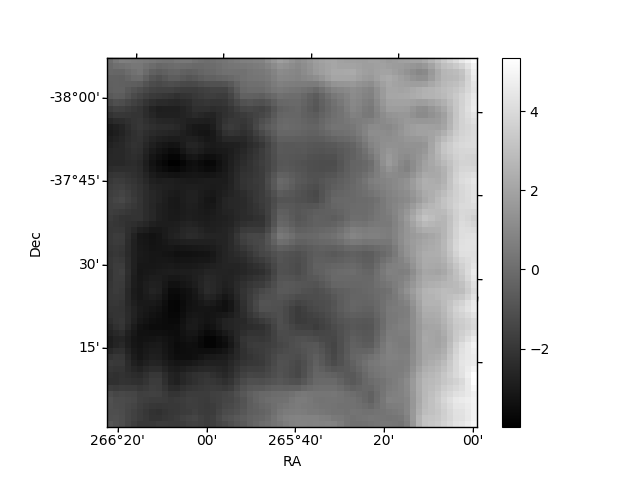
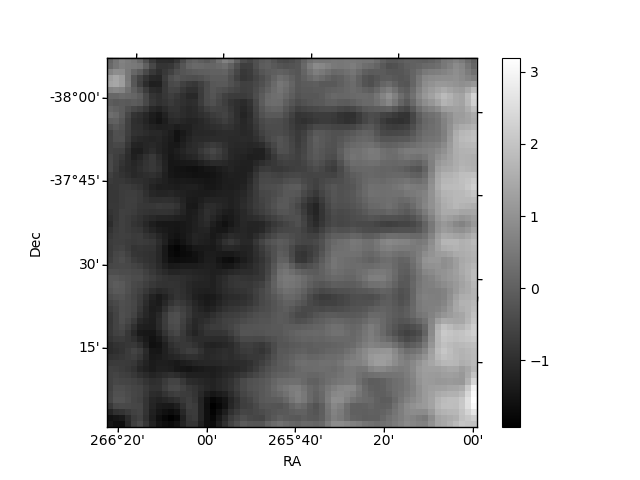
Histogram calculated using DETX and DETY for each event in the final _common_clean file
| Quadrant A | 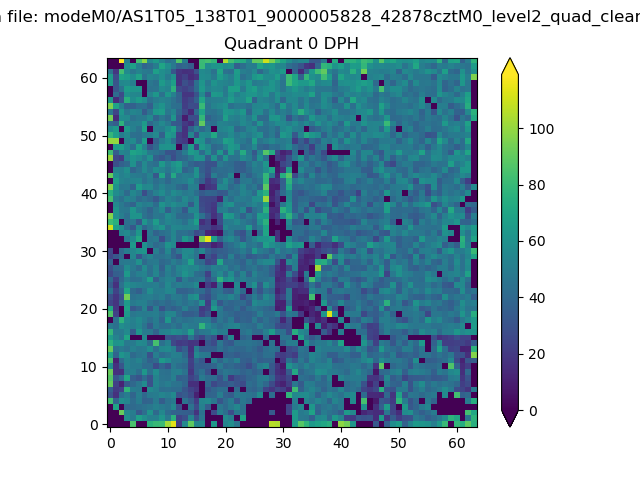 |
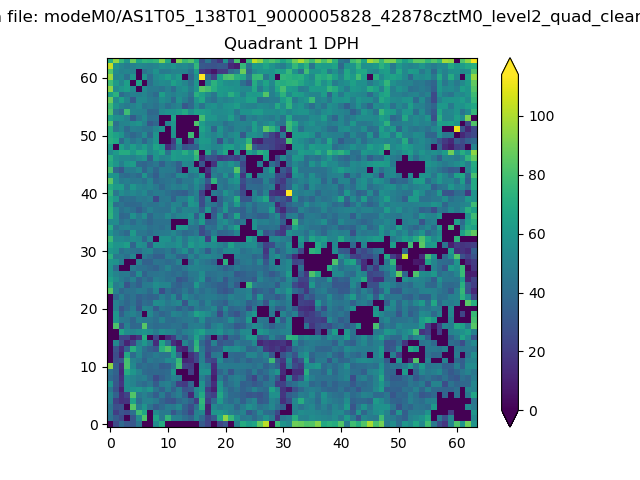 |
Quadrant B |
|---|---|---|---|
| Quadrant D | 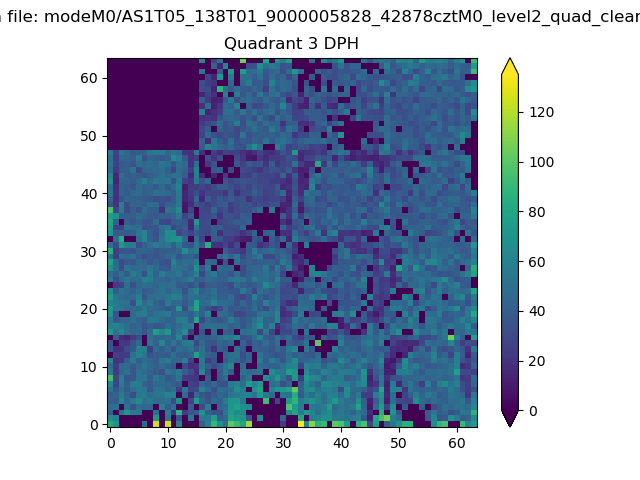 |
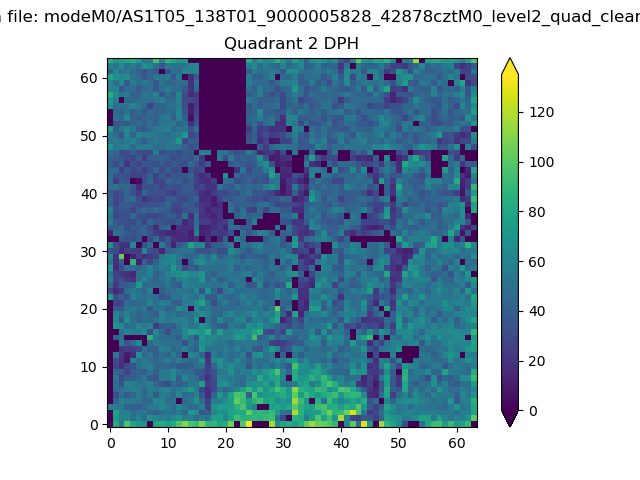 |
Quadrant C |
| Plot type | Count rate plots | Images |
|---|---|---|
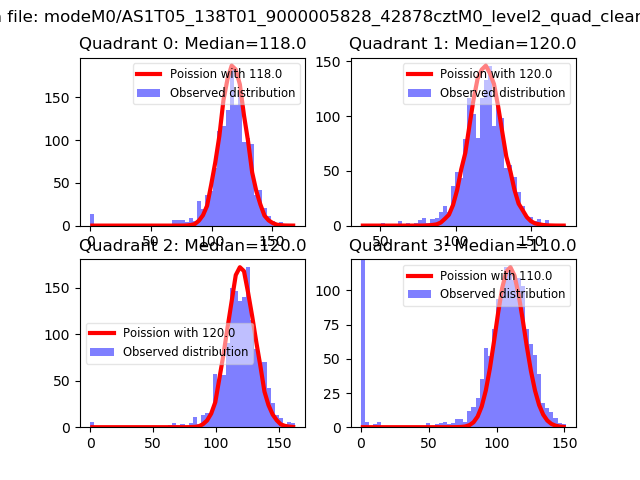
| Comparison with Poisson distribution Blue bars denote a histogram of data divided into 1 sec bins. Red curve is a Poisson curve with rate = median count rate of data. |
 |
 |
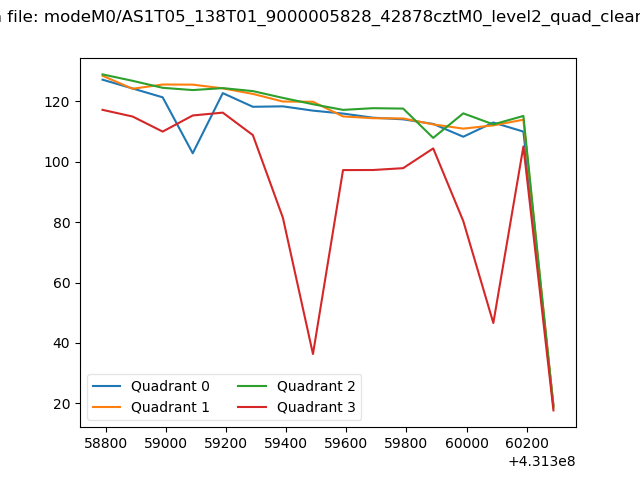
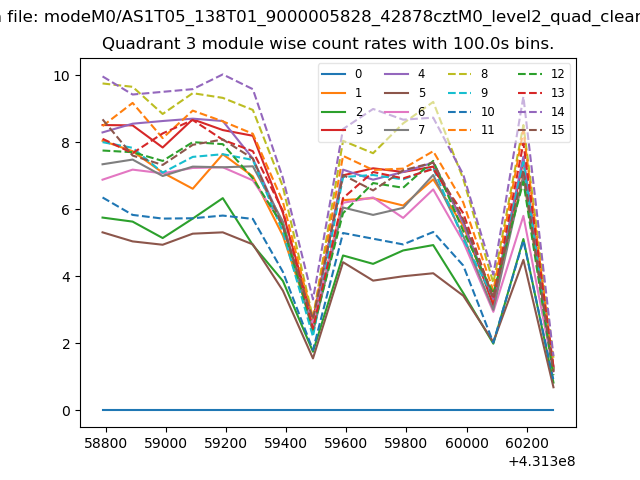
| Quadrant-wise count rates Data is divided into 100 sec bins |
 |
|
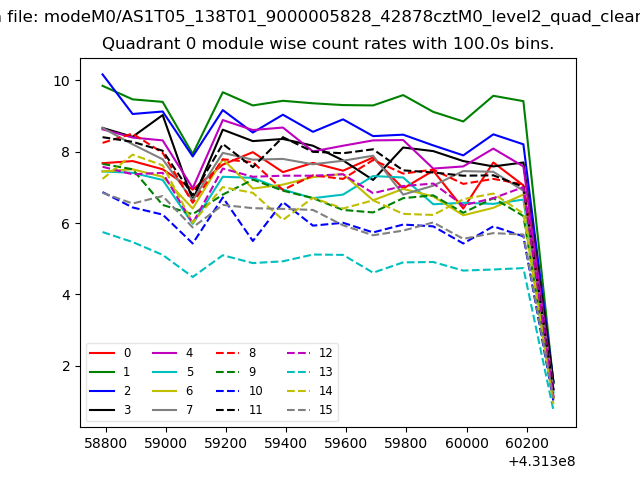
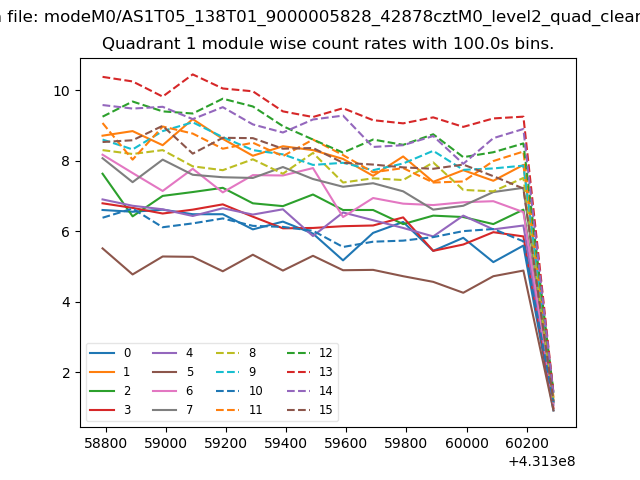
| Module-wise count rates for Quadrant A Data is divided into 100 sec bins |
 |
 |
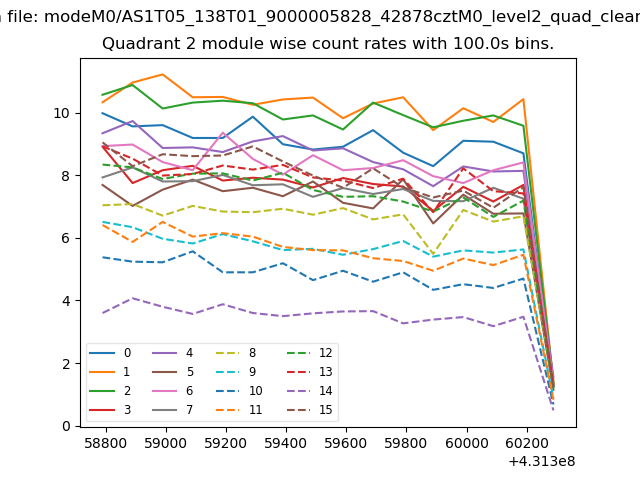
| Module-wise count rates for Quadrant B Data is divided into 100 sec bins |
 |
 |
| Module-wise count rates for Quadrant C Data is divided into 100 sec bins |
 |
 |
| Module-wise count rates for Quadrant D Data is divided into 100 sec bins |
 |
 |
| Parameter | Plot |
|---|---|
| CZT HV Monitor | 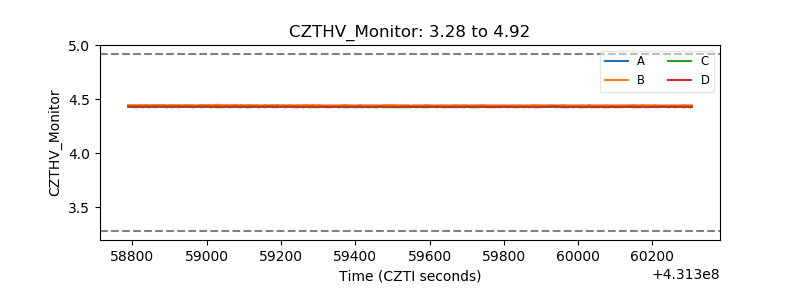 |
| D_VDD | 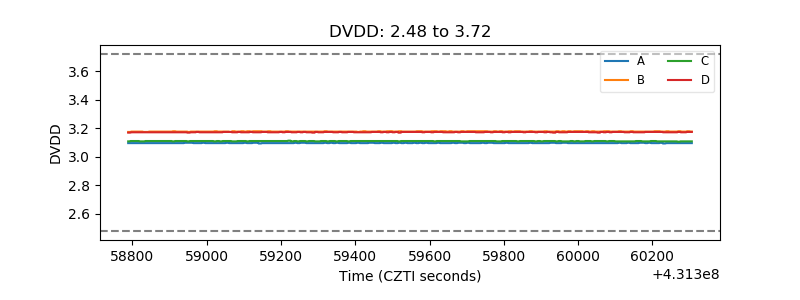 |
| Temperature 1 | 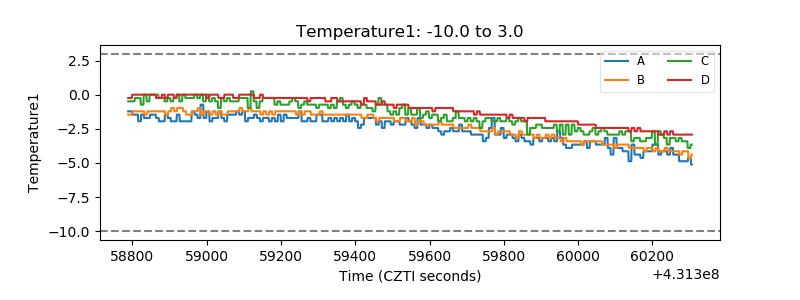 |
| Veto HV Monitor | 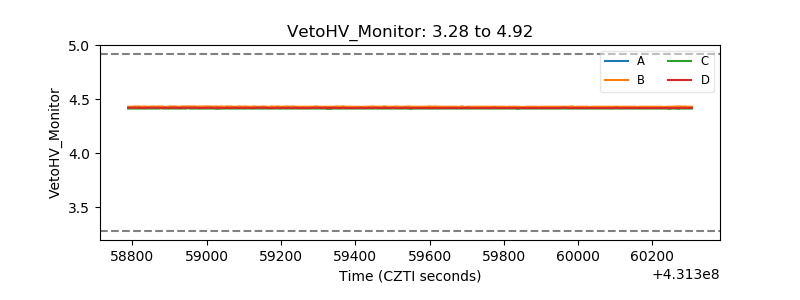 |
| Veto LLD | 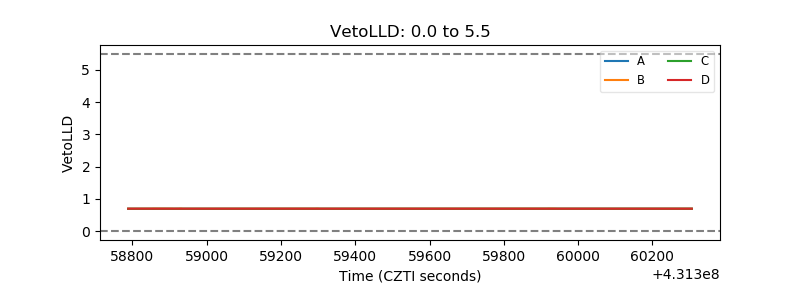 |
| Alpha Counter | 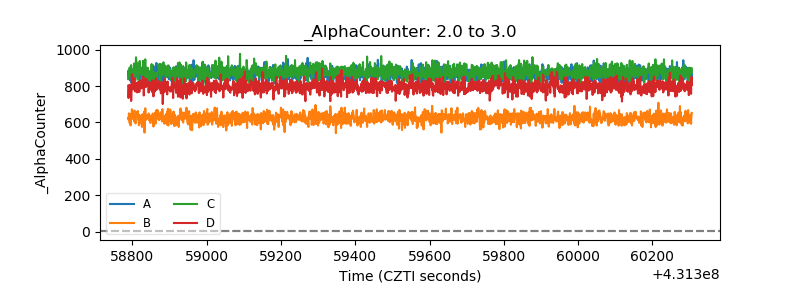 |
| _CPM_Rate | 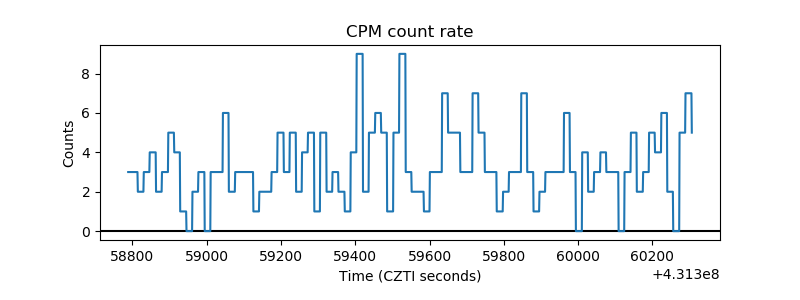 |
| CZT Counter | 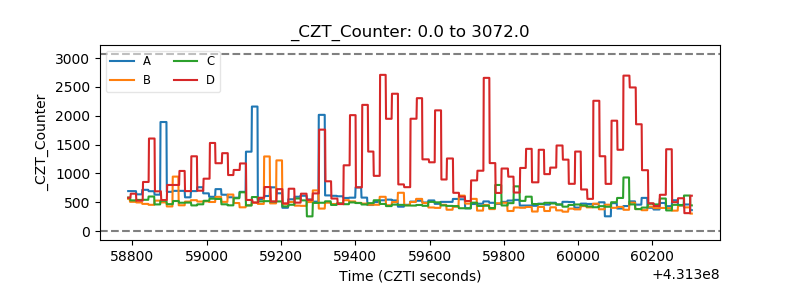 |
| +2.5 Volts monitor | 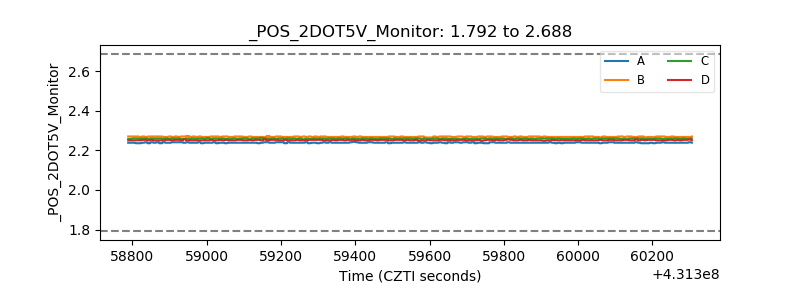 |
| +5 Volts monitor | 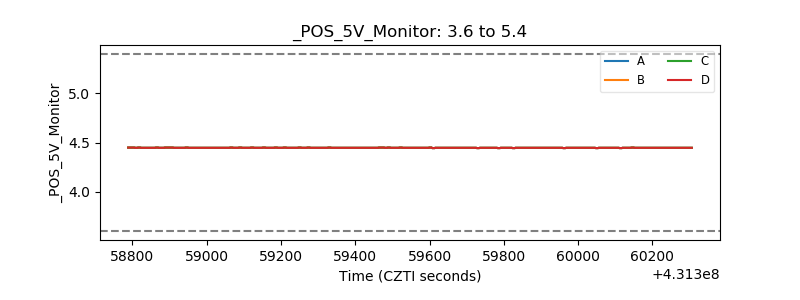 |
| _ROLL_ROT |  |
| _Roll_DEC | 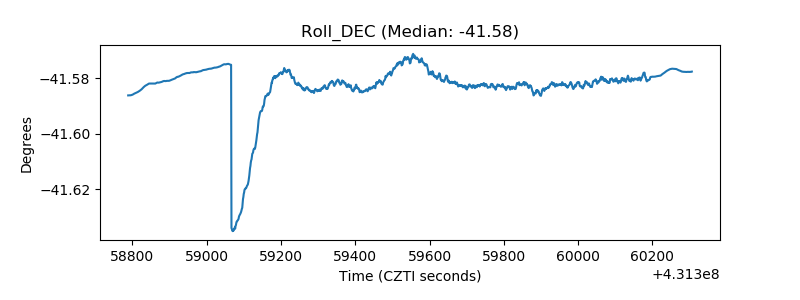 |
| _Roll_RA | 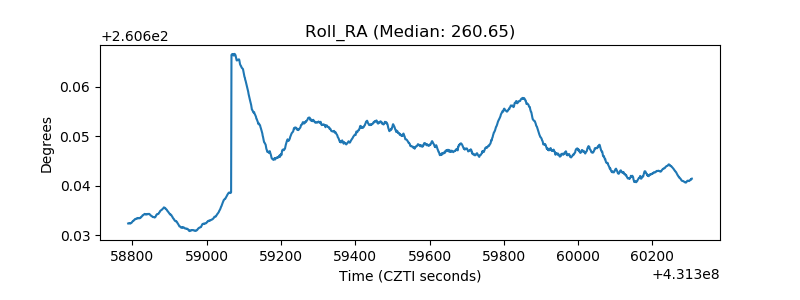 |
| Veto Counter | 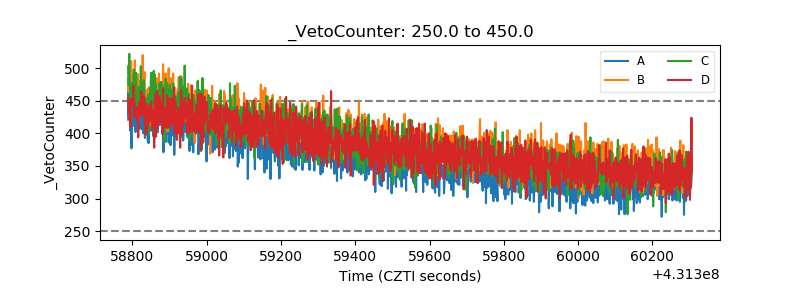 |